Abstract
During human pregnancy, the production of 17-beta-estradiol (E2) rises steadily to eighty fold at term, and placenta has been found to specifically bind estrogens. We have recently demonstrated the expression of estrogen receptor alpha (ER-alpha) protein in human placenta and its localization in villous cytotrophoblast (CT), vascular pericytes, and amniotic fibroblasts. In vitro, E2 stimulated development of large syncytiotrophoblast (ST) aggregates. In the present study we utilized ER-beta affinity purified polyclonal (N19:sc6820) and ER-alpha monoclonal (clone h-151) antibodies. Western blot analysis revealed a single ~52 kDa ER-beta band in chorionic villi (CV) protein extracts. In CV, strong cytoplasmic ER-beta immunoreactivity was confined to ST. Dual color immunohistochemistry revealed asymmetric segregation of ER-alpha in dividing villous CT cells. Prior to separation, the cell nuclei more distant from ST exhibited high ER-alpha, while cell nuclei associated with ST showed diminution of ER-alpha and appearance of ER-beta. In trophoblast cultures, development of ST aggregates was associated with diminution of ER-alpha and appearance of ER-beta immunoreactivity. ER-beta was also detected in endothelial cells, amniotic epithelial cells and fibroblasts, extravillous trophoblast (nuclear and cytoplasmic) and decidual cells (cytoplasmic only). In addition, CFK-E12 (E12) and CWK-F12 (F12) monoclonal antibodies, which recognize ~64 kDa ER-beta with hormone binding domain, showed nuclear-specific reactivity with villous ST, extravillous trophoblast, and amniotic epithelium and fibroblasts. Western blot analysis indicated abundant expression of a ~64 kDa ER-beta variant in trophoblast cultures, significantly higher when compared to the chorionic villi and freshly isolated trophoblast cell protein extracts. This is the first report on ER-beta expression in human placenta and cultured trophoblast. Our data indicate that during trophoblast differentiation, the ER-alpha is associated with a less, and ER-beta with the more differentiated state. Enhanced expression of ~64 kDa ER-beta variant in trophoblast cultures suggests a unique role of ER-beta hormone binding domain in the regulation of trophoblast differentiation. Our data also indicate that asymmetric segregation of ER-alpha may play a role in asymmetric division of estrogen-dependent cells.
Background
Estrogens affect a variety of tissues, including reproductive tissues, bone, liver, cardiovascular system and brain. Table 1 lists the classical and non-classical estrogen sensitive tissues and cells [1]. Although several previous studies have shown that human placenta binds estradiol (E2) [2-4], and estrogens influence various aspects of placental function and fetal development in humans and primates [5-11], the placenta as a target for estrogens is missing. The reason might be an inability of former studies to detect expression of estrogen receptor alpha (ERα) and its immunoreactivity in placental components [12,13]. Yet, forms of the estradiol receptor of differing stability have been detected in human placental tissue [14]. This indicates that some determinants of placental ERα may possibly undergo denaturation during tissue processing and become undetectable, e.g. in paraffin sections.
Table 1.
Estrogen-sensitive tissues and cells (data from reference [1])
| Classical targets | Non-classical targets |
| Ovary | Kidney |
| Vagina | Islets of Langerhans |
| Uterus | Liver |
| Mammary gland | Bone |
| Adrenal gland | Cardiovascular system |
| Prostate | Macrophages |
| Pituitary gland | Thymocytes |
| Hypothalamus | Lymphoid cells |
| Leydig cells | Endothelial cells |
| Osteoblastic cells | |
| Glial cells | |
| Schwann cells |
On the other hand, we have recently shown ERα expression in human term placenta by western blot analysis. ERα immunoreactivity was confined to villous and cultured cytotrophoblast (CT) cells but not syncytiotrophoblast (ST). We also localized ERα immunoreactivity in villous vascular pericytes and extravillous (amniotic) fibroblasts but not in villous endothelial cells, amniotic epithelium, extravillous trophoblast (EVT) or decidual cells. In tissue culture, E2 stimulated trophoblast differentiation into syncytial aggregates [15]. To our knowledge, no attempt has been so far made to study placental expression of ER beta (ERβ).
Although it was first believed that estrogen receptors were predominantly cytoplasmic, it was later proposed that they are located exclusively within the nucleus. It is now clear that these receptors can be found in both the cytoplasm and nucleus, with the ratio dependent upon the cell type and physiological conditions. Some studies also indicate that estrogen receptors reside on the plasma membrane and modulate cellular activity without directly associating with DNA [16]. Human ERβ is encoded by 477 amino acids (~52 kDa) and has substantial homology to ERα (66 kDa) [17,18]. Although both estrogen receptors (ERs) can be expressed in various estrogen-sensitive tissues and cells, evidence is accumulating that their expression varies during cellular proliferation and differentiation [19]. It appears quite clear today that ERβ has biological roles that are distinct from those of ERα, and certain results indicate that ERβ can have effects opposite to those of the ERα [20,21].
Although some in vitro studies suggest both ERs may play redundant roles, a dissimilar tissue distribution indicates otherwise. ERα (αERKO) and ERβ knockout (βERKO) female mice possess a normally developed reproductive tract and maintain expression of the opposite ER [22]. The αERKO female is infertile and exhibits a hypoplastic uterus that is refractory to estrogens. The ovaries of the αERKO female are consistently polycystic and lack evidence of spontaneous ovulation. In contrast, the βERKO female exhibits a hormonally responsive uterus and grossly normal ovaries, but is subfertile in terms of the frequency and size of litters. Double ER knockout (DERKO) mice are infertile, possess the expected reproductive tract structures, but exhibit a remarkably distinct ovarian phenotype characterized by postnatal loss of oocytes and redifferentiation of the remaining somatic cells to Sertolilike cells. This "sexreversal" in the DERKO ovary is accompanied by the ectopic expression of testisspecific genes (reviewed in reference [22]).
A recent study of βERKO mice has shown that ERβ is not required for the normal prepubertal development of the mammary gland but for organization and adhesion of epithelial cells during pregnancy and hence for differentiated tissue morphology [23]. These observations indicate a possibility of complementary (sequential) roles of ERα and ERβ, since ERα appears to be required for the basic development of estrogen sensitive tissues and ERβ seems to be required for their functional maturation.
Besides the ~52 kDa ERβ, additional related forms have been identified at the RNA level, often denoted as "ERβ B". They would generate ~56, 61 and 63 kDa ERβ proteins [24]. Recently developed monoclonal antibodies made to the human ERβ hormone binding domain have been shown to identify ~52 kDa and an additional ~62–64 kDa band in protein extracts from granulosa cells of several mammalian species. Immunohistochemical studies with these antibodies revealed nuclear-specific localization of the ERβ protein in granulosa cells of the rat ovary and in epithelial and some stromal cells of mouse and rat epididymis. Epitope mapping studies indicated that the E12 and F12 antibodies recognize overlapping peptide sequences in the C-terminal region of the hormone-binding domain, a region that is highly conserved among species [18].
Villous CT cells are a type of stem cell which divides during pregnancy including the term placenta [25-27]. However, if the division is symmetric, i.e., resulting in two identical cells, both cells should either proliferate or differentiate. The former situation might result in placental site trophoblastic tumor or choriocarcinoma [28], the latter in the loss of the ability of the villous trophoblast to proliferate. However, ten years ago, biologists began to gain insight into the cellular mechanisms by which a cell divides into two cells of different developmental potentials, a process known as asymmetric division. Asymmetric division is a fundamental means of generating cell diversity and may involve extrinsic or intrinsic factors. With extrinsic factors, daughter cells are equivalent after separation but adopt different fates due to their interactions with the environment. With intrinsic factors, unequal amounts of cell-fate determinants are distributed into the two cells prior to their separation [29]. Among the intrinsic factors underlying asymmetric division, the interactions of the Numb differentiation-associated protein with Notch proliferation-associated signaling is the model most widely studied, ranging from bacteria, yeast, and Drosophila to mammals [30]. Mammalian cells known to exhibit asymmetric division include diverse cell types such as neuronal cells, thymocytes, and satellite cells involved in myogenesis, and the list is growing [29-32].
The aim of present study was to investigate expression and localization of ERβ in normal term placentae as compared to that of ERα. Our data indicate that virtually all cellular compartments of the human placenta express either ERα, ERβ, or both. In addition, we identified asymmetric ERα segregation in dividing villous CT cells.
Materials and Methods
Tissues
Seven normal placentae from deliveries between 36 and 38 weeks of pregnancy were investigated. The source of placental tissue was women with normal pregnancies admitted to the University of Tennessee Medical Center. Excluded were patients with blood transferable infections, e.g., hepatitis and HIV, and apparent ascendent placental infections. The study was approved by the Institutional Review Board.
Tissue processing
The processing started within 30–60 minutes after delivery. Tissue blocks of placental samples were frozen in optimum cutting temperature (O.C.T.) compound (Miles Inc., Elkhart, IN) and stored at -80°C. Frozen sections (7 μm thickness) were fixed in acetone and processed as described previously [15]http://www.RBEj.com/content/1/1/36 and indicated below. All chemicals, except where specified otherwise, were purchased from Sigma Chemical Co., St. Louis, MO.
Dual color immunohistochemistry for Thy-1 of mesenchymal cells and cytokeratin of epithelial cells
To determine a relationship between placental mesenchymal and epithelial components, the slides were subjected to dual color immunohistochemistry for Thy-1 and cytokeratin (CK) immunoreactivity (Thy-1/CK). The slides were first immunostained for Thy-1 differentiation protein of mesenchymal cells (placental fibroblasts, pericytes and decidual cells) as described previously [15], but without hematoxylin counterstain and dehydratation. Briefly, specimens were washed with phosphate buffered saline (PBS) and incubated 20 minutes with mouse-anti human Thy-1, clone F10-44-1 [33,34] (5 μg/ml in PBS) reacting with placental villous pericytes, extravillous fibroblasts, and decidual cells [15]. After extensive washing in PBS, specimens were incubated 20 minutes with swine anti-mouse IgG peroxidase conjugate (SwAM; SEVAC, Prague, Czech Republic) diluted 1:50 and preabsorbed with rat kidney homogenate [15]. Antigen-antibody complexes were detected by standard diaminobenzidine technique (brown color).
After extensive washes in PBS, the slides were incubated for 20 minutes with mouse anti-human cytokeratin 18, clone DC10 (DAKO Corporation, Carpinteria, CA) diluted 1:50 and peroxidase-coupled secondary antibody as above. Antigen-antibody complexes were detected by a DABNi detection kit according to the supplier's manual (Vector Laboratories, Inc., Burlingame, CA), giving the substrate dark blue color. This contrasted with the brown color resulting from the first sequence of immunoreagents (Thy-1 immunostaining). The slides were dehydrated and mounted, without hematoxylin counterstain. A control procedure consisted of dual color immunohistochemistry as above, but both primary antibodies were replaced with PBS.
Since the diaminobenzidine reaction product masks the antigen and catalytic sites of the first sequence of immunoreagents and thus prevents interaction with the reagents of the second sequence [35], a possibility of co-expression in the same cell types has been investigated. Therefore, another set of slides was similarly processed, with the opposite order of primary antibodies (CK/Thy-1). In addition, two sets of slides were immunostained for Thy-1 or CK expression alone, followed by hematoxylin counterstain (not shown).
Differential interference contrast images were captured with a DEI-470 CCD Video Camera System (Optronics Engineering, Goleta, CA) with detail enhancement and CG-7 color frame grabber (Scion Corporation, Frederick, MD) supported by Scion Image public software developed at the National Institutes of Health (Wayne Rasband, NIH, Bethesda, MD). Captured images were compiled using Microsoft® Power-Point® 97 SR-2 (Microsoft Corporation, Redmont, WA) and Microsoft Photo Editor 3.0 (Microsoft Corporation).
Peroxidase immunohistochemistry for ERα and ERβ
Tissue sections were processed for ERα and ERβ immunoexpression using indirect single color immunoperoxidase immunohistochemistry [15]. For ERβ, the slides were incubated at 4°C overnight with affinity purified goat-anti human ERβ polyclonal antibody – ERβ (N-19): sc6820 raised against a peptide mapping at the amino terminus of ERβ of human origin (Santa Cruz Biotechnology, Santa Cruz, CA) diluted 1:20 in PBS. After extensive washing, the slides were incubated with biotinated donkey anti-goat polyclonal antibody (DAKO) pre-absorbed with rat kidney homogenate [15], followed by peroxidase-coupled streptavidin, and the peroxidase visualized by diaminobenzidine as recommended by the kit (LSAB) vendor (DAKO). The slides were dehydrated and mounted, without hematoxylin counterstain. Sections incubated without the primary antibody but with PBS were used as negative controls. Images were captured and processed as indicated above. We used ERα/ERβ dual color immunohistochemistry for co-localization of both ERs.
Specificity of ERβ polyclonal antibody was confirmed by absorption with blocking peptide. The blocking peptide sc-6820 P (Santa Cruz Biotechnology) for N-19 ERβ antibody was mixed with the ERβ antibody at a 10:1 weight ratio, and incubated overnight at 4°C then 2 h at room temperature before the peptide-absorbed antibody was utilized for immunohistochemistry (PA/ERβ, Figure 2H) and western blot controls (PA/ERβ, Figure 6B). As an additional negative control, we tested reactivity of ERα and ERβ antibodies with cdk2 immunoprecipitates (see below).
Figure 2.
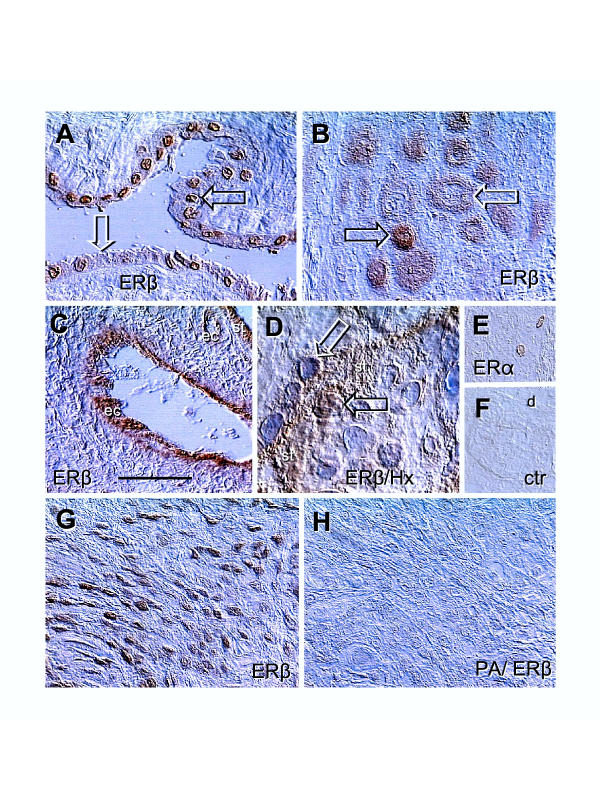
Immunolocalization of ERs in placental membranes and ERβ peptide-absorbed antibody control. [A] Amniotic epithelium with ERβ+ (solid arrow) and ERβ- nuclei (white arrow). [B] Basal plate EVT with high (solid arrow) and diminishing ERβ staining (white arrow). [C] Immunolocalization of ERβ in vascular endothelial cells (ec) of a stem villus. [D] Cytotrophoblast cell merging with ST (st) shows nuclear ERβ immunoreactivity (solid arrow) but ST nuclei are unstained (white arrow). [E] Rarely seen nuclear ERα immunoreactivity in the basal plate decidual cells. [F] Control. [G] EVT in lower magnification, representing ERβ positive control for [H], which is a parallel section incubated with peptide-absorbed ERβ antibody (PA/ERβ). Bar in C = 50 μm for [A–C], 20 μm for [D], and 100 μm for [E-H]. No nuclear counterstain except in panel [D]. Details in text.
Figure 6.
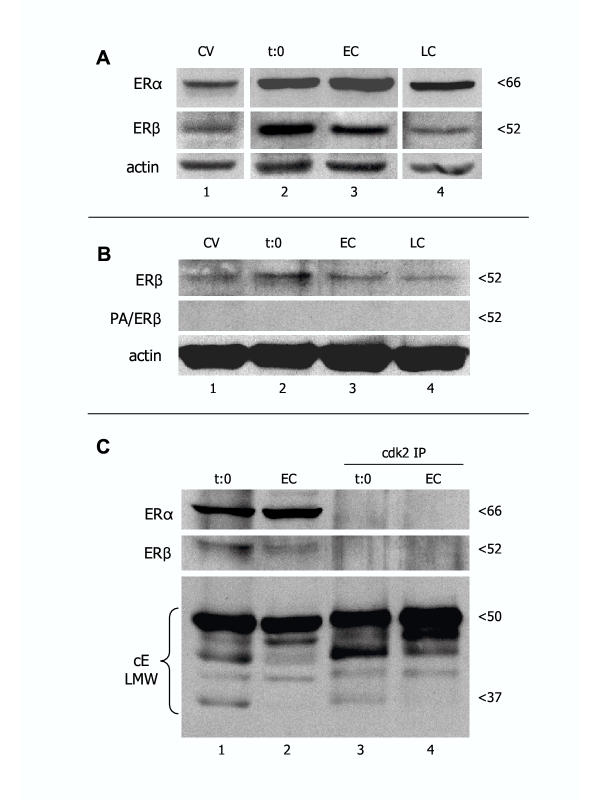
Representative western blot analysis of ERα and ERβ expression in CV, time 0 separated trophoblast cells (t:0), and early (EC) and late trophoblast cultures (LC). [A] All lanes are from the same normal placenta and corresponding cultures, and from the same blot. [B] Absorption of ERβ antibody with blocking peptide (PA/ERβ) resulted in a lack of ERβ band detection in CV from another placenta and derived trophoblast cultures. [C] Demonstration of ERα and ERβ expression in original protein lysates (lanes 1 and 2) and lack of reactivity with cdk2 immunoprecipitates (cdk2 IP; lanes 3 and 4) from time 0 and early trophoblast cultures. Bottom is the positive IP control showing cyclin E low molecular weight (cE LMW) protein variants in both original lysates and cdk2 IPs.
Cell separation and culture
Placental tissue was digested and trophoblast cells isolated and cultured as described previously [15,36]. Briefly, the cells collected after digestion were pooled, washed twice in DMEM containing 25 mM HEPES and 4500 mg/L glucose (DMEM-HG), diluted to 10 ml in DMEM-HG supplemented with heat inactivated 5% fetal bovine serum (FBS) and antibiotics (50 μg/ml gentamycin, 100 U/ml penicillin, and 100 μg/ml streptomycin), and viable large nucleated cells (95% in trypan blue exclusion test) were counted. Cells were seeded in 60 mm Falcon Primaria petris (Fisher Scientific, Pittsburgh, PA), in the amount of 7 × 10⁶ per dish cells in 3 ml DMEM-HG with 5% FBS + antibiotics as above, and cultured in an humidified atmosphere with 5% CO2 at 37°C. The medium was changed every 24 hours.
Immunohistochemical detection of ERα on trophoblast cultures (four or eight chamber slides) was performed as described previously [15], and that of ERβ as above. To prepare cell lysates, freshly isolated trophoblast cells and early (16–24 h) and late trophoblast cultures (72–96 h) were washed twice with ice-cold PBS, lysed by adding ice-cold lysis buffer (20 mM Tris pH 7.5, 200 mM NaCl) containing 1 mM sodium orthovanadate, 0.25% Nonidet P-40, 10 mM sodium fluoride, and 1 mM phenylmethylsulfonyl fluoride, sonicated, centrifuged, and supernatants stored at -80°C until use [15].
Western blot analysis
Placental tissue and trophoblast culture protein extracts were used for the detection of ERβ protein, as previously described [15]. Protein samples (42 μg) were separated on 10% SDS PAGE and transferred onto nitrocellulose membranes. The membranes were washed in Tris-buffered saline containing 0.05% Tween 20 (TBST), blocked by immersing the membrane in 0.5% casein in TBST for 1 h then incubated at 4°C overnight with affinity purified goat anti-ERβ N-19 antibody (Santa Cruz Biotechnology) diluted 1:4000 in blocking reagent. After washing in TBST, the filters were incubated with peroxidaseconjugated donkey anti-goat IgG secondary antibody (Jackson Immunoresearch) for 1 h at a dilution of 1:5000 in blocking reagent. After washing in TBST, the ERβ protein was visualized with a chemiluminescent detection system (ECL; Amersham Pharmacia Biotech, Piscataway, NJ) as recommended by the manufacturer, and exposed on Kodak XAR film (Eastman Kodak, Rochester, NY). Primary antibodies for actin (clone C4, Boehringer Mannheim Corp., Indianapolis, IN) and ERα (clone h-151, StressGen Biotechnologies Corp, Victoria, BC; 0.1 μg/ml) were also used for western blot analysis as described [15].
Monoclonal antibodies to ERβ hormone binding domain
We also used recently developed and well defined mouse monoclonal antibodies CFK-E12 (E12) and CWK-F12 (F12), which were made against human ERβ amino acids 256–505 hormone binding domain lacking the F domain [18]. The antibodies were kindly donated by Dr. Benita S. Katzenellenbogen of the Department of Molecular and Integrative Physiology, University of Illinois College of Medicine, Urbana, Illinois.
We used both antibodies in the form of ascites fluid (1 mg/ml), at 10 μg/ml dilution for immunohistochemistry and 1 μg/ml for western blot analysis (4°C overnight). This was followed by peroxidaseconjugated and rat kidney preabsorbed swine anti-mouse IgG (SEVAC, Prague) or goat anti-mouse IgG and IgM (Jackson Immunoresearch), respectively.
Immunoprecipitation
Cyclin-dependent kinase 2 (cdk2) immunoprecipitates (IP) were utilized as negative controls for ERα monoclonal and ERβ polyclonal antibodies. The cdk2 (M2) affinity purified rabbit polyclonal antibody raised against a peptide mapping at the carboxy terminus of cdk2 of human origin (Santa Cruz Biotechnology) was utilized. Equal amounts (200 μg) of protein from each sample were immunoprecipitated with 0.5 μg cdk2 antibody in 300 μl IP buffer [50 mM Tris (pH 7.5), 5 mM EDTA, 20 mM glycerol, 150 mM NaCl, and 1% NP-40] and 25 μl protein A/G agarose beads (Santa Cruz Biotechnology) on an orbital shaker overnight at 4°C. Immunoprecipitates were collected by centrifugation (11000 × g for 10 min at 4°C), washed five times with 500 μl TG-buffer containing 20 mM Tris, 250 mM NaCl, and 0.5% NP-40. For western blot analysis, IP were resuspended in 20 μl 2 × SDS/sample (Laemmli) buffer and the supernatants were resolved by SDS-PAGE. In parallel, the western blots with original protein lysates were processed. The ERs were detected by probing with ERα and ERβ antibodies as indicated above. The cyclin E antibody served as a positive control for cdk2 IP, as described previously [15].
Quantitative analysis of ERα and ERβ immunoreactivity
Immunohistochemical color images were loaded into Scion Image software, converted to RGB (red), and mean densities evaluated in the areas of 20 × 20 pixels (400 values). The areas were measured in control samples (background) and within ERα and ERβ immunoperoxidase processed samples (crude values). The measurements were copied into Microsoft Excel 2002 (Microsoft Corporation), and background values subtracted from crude measurements to obtain net optical density (O.D.). Net values were utilized for statistical calculations. Blots were quantified as described previously [15].
Statistics
Statistical analysis of data was performed using GraphPad InStat version 3.01 for Windows software (GraphPad Software, San Diego, CA). The net O.D. values of ERα and ERβ immunoreactivity in immunohistochemistry and western blots were transformed (Y=Log [Y]) and subjected to Repeated Measures Analysis of Variance (ANOVA) followed by TukeyKramer Multiple Comparisons Test. Probability values of P < 0.05 were considered significant.
Results
ERβ immunoreactivity in chorionic villi (CV) and placental membranes (Figures 1 and 2)
Figure 1.
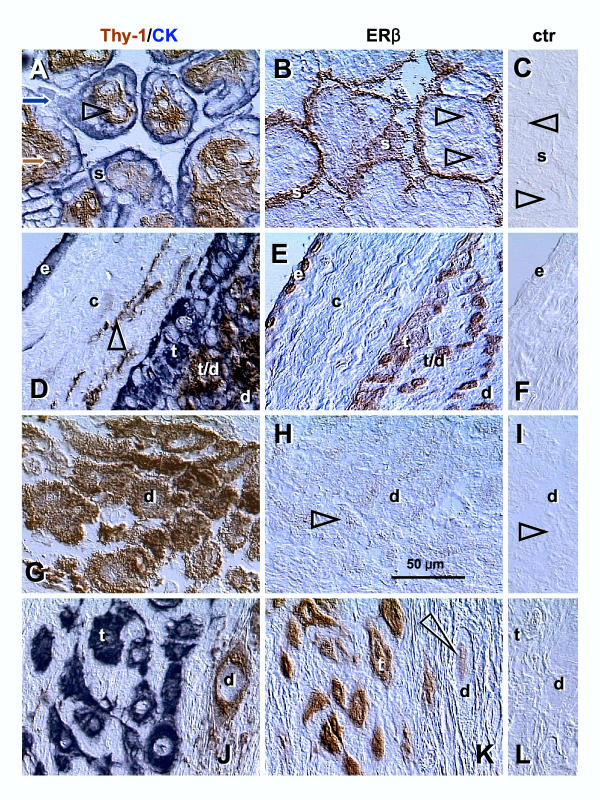
Dual color for Thy-1 differentiation protein and cytokeratin (Thy-1/CK), single color ERβ, and control staining (ctr) in CV and placental membranes. [A–C] Corresponding sections through the terminal villi of normal term placenta: s, syncytiotrophoblast; arrowheads, villous blood sinusoids. [D–F] Placental membranes: e, amniotic epithelium; c, connective tissue; t, extravillous trophoblast; t/d, trophoblast/decidua interface; d, decidual cells; arrowhead, Thy-1+ fibroblasts. [G–I] Placental basal plate decidua (d); arrowheads, comparison of ERβ and control staining. [J–L] Placental basal plate extravillous trophoblast (t) and decidua compartments (d); arrowhead indicates nuclear staining of decidual cell. No hematoxylin counterstain. Details in text.
We used dual color immunohistochemistry without hematoxylin counterstain to show placental mesenchymal cells and epithelial structures (left column, Fig. 1). Parallel sections were investigated for ERβ (mid column) and utilized for controls, where PBS was used instead of the ERβ antibody (right column). Mesenchymal cells expressing Thy-1 differentiation protein (brown color) were represented by pericytes (arrowhead, Fig. 1A), fibroblasts (arrowhead, Fig. 1D) and decidual cells (d, Fig. 1D,1G and 1J). Epithelial structures expressing cytokeratin (blue color) were represented by ST (s, Fig. 1A) and EVT (t, Fig. 1D and 1J). Strong ERβ immunoreactivity was detected in villous ST (Fig. 1B) and weaker staining was apparent in villous sinusoids (arrowheads).
In placental membranes (Fig. 1E), strong ERβ immunoreactivity was confined to amniotic epithelium (e) and EVT (t). Weak staining was associated with connective tissue cells and decidual cells (compare with control, panel F). Decidua in the placental basal plate showed weak ERβ staining of (d Fig. 1H and 1K, compare with controls), but basal plate EVT showed strong ERβ immunoreactivity (t, Fig. 1K).
There was, however a variability of ERβ expression in amniotic epithelium (Fig. 2A Note ERβ+ (solid arrow) and ERβ- nuclei (white arrow). In the basal plate, EVT also exhibited strong (solid arrow) and diminishing ERβ immunoreactivity (white arrow, Fig. 2B). Placental vessels showed ERβ immunoreactivity restricted to the endothelial cells (ec, panel C). In CV, during association of CT cells with ST (st), the nuclear ERβ immunoreactivity was apparent (solid arrow, panel D). However, nuclei of differentiated ST were unstained (white arrow). Decidual cells occasionally (a few cells in one of 7 placentae investigated) exhibited nuclear ERα (panel E, compare with control, panel F). Strong ERβ immunoreactivity of EVT (positive control) is shown in panel G and a lack of immunoreactivity on a parallel section incubated with peptide-absorbed ERβ antibody (PA/ERβ) is shown in panel H. Except in panel D, no nuclear counterstain was utilized.
Dual color immunohistochemistry for ERα and ERβ immunoreactivity in chorionic villi (Figure 3)
Figure 3.
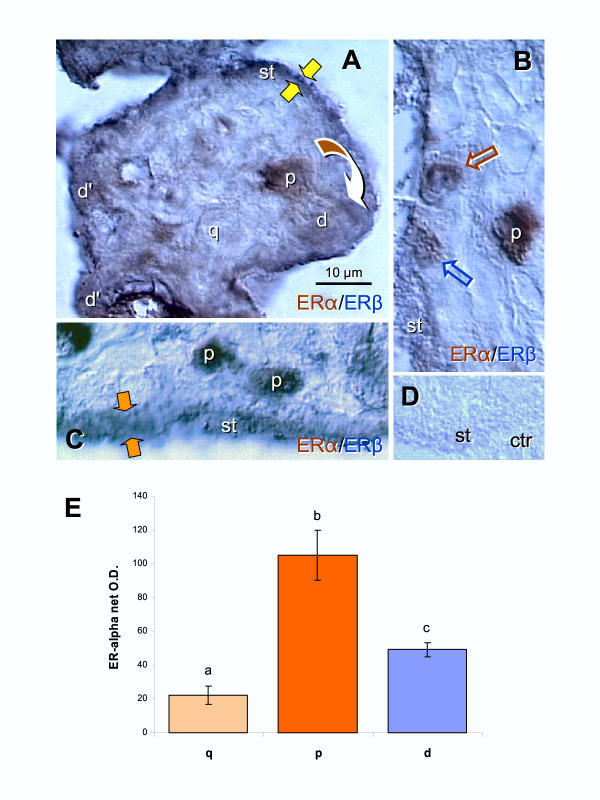
Dual color immunohistochemistry for ERα (brown) and ERβ (dark blue) in CV. [A] Dividing CT cell (arched arrow) shows strong ERα staining (brown color) in the parental (p) cell and depletion in the daughter cell (d) merging with ST. A quiescent CT cell (q) shows weak nuclear ERα staining. Additional "daughter cells" shoving brown/blue color transition are indicated as (d'). Dark blue (ERβ) staining dominates mature ST (st). Yellow arrows indicate very narrow ST. [B] Strong brown nuclear ERα immunoreactivity of parental CT cell (p), and gradual diminution of ERα and increase of ERβ in daughter cells (brown and blue arrows) merging with ERβ+ (blue) ST. [C] Dividing CT giving rise to two parental cells with high ERα immunostaining. Orange arrows indicate relatively wide ST. [D] Control. [E] Quantitative evaluation of ERα immunoreactivity in quiescent, parental and daughter cells. Each column represents mean from six net O.D. measurements ± SD. Different column superscripts indicate significant difference. Details in text.
The relationship between ERα and ERβ immunoreactivity in CV was also investigated by dual color immunohistochemistry (Fig. 3). We observed that dividing CT cells prior to separation (arched arrow) show strong ERα expression in the parental cell (p; distant from ST) and weak expression in the daughter (d) merging with very narrow ST (~2 μm, yellow arrows; Fig. 3A). Note that the dividing cell exhibits a perpendicular (90 degrees) long axis to the plane of the ST layer (see discussion for importance and comment). Additional differentiating daughter CT cells (d') show brown/blue color contrasting with dark blue of differentiated syncytium (st). There were also isolated CT cells in the villous stroma (quiescent, q; or G0), which showed very weak nuclear ERα.
Another strongly ERα+ parental CT cell in the villous stroma is shown in Fig. 3B. Differentiating daughter CT cells associated with ST showed gradual diminution of ERα and increase of ERβ (brown and blue arrows) merging with an ERβ+ (blue) ST. Note that single color staining in Fig. 2D indicates that the CT cells merging with ST (solid arrow) exhibit nuclear ERβ. We also occasionally detected symmetric division of CT resulting in two parental cells with strong nuclear ERα staining (Fig. 3C Note the parallel long axis of dividing cells to the plane of ST and relatively wide ST (~8 μm, orange arrows). Panel D is a control for dual color immunohistochemistry, where both primary antibodies were replaced with PBS.
Quantitative evaluation of ERα immunoreactivity in quiescent (q), parental (p) and daughter cells (d) during asymmetric divisions is shown in Fig. 3E. The ERα immunoreactivity was lowest in quiescent cells and highest in parental cells during asymmetric division. However, daughter cells showed significant diminution of ERα when compared to parental cells. Statistical analysis indicated overall ANOVA P < 0.0001, and differences between all columns P < 0.01.
Comparison of ERβ and ERα immunoreactivity in cultured trophoblast (Figures 4 and 5)
Figure 4.
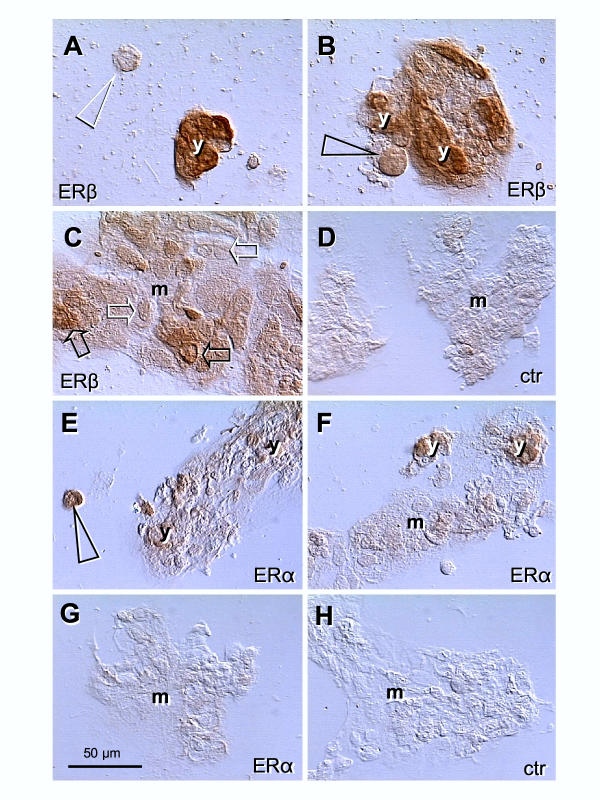
Immunolocalization of ERβ and ERα in the late trophoblast culture (68 h). [A] Isolated CT cells are unstained (arrowhead) but strong ERβ nuclear and cytoplasmic immunostaining accompanies young ST aggregates (y). [B] CT cell associated with ST shows ERβ immunoreactivity (arrowhead). [C] Mature ST (m) shows a diminution of ERβ nuclear staining (solid > white arrows) with persisting cytoplasmic immunoreactivity. [D] Secondary antibody control. [E] Isolated CT cells show strong ERα immunostaining (arrowhead) persisting in young ST aggregates [y, E and F] but diminishing in mature ST [m; F and G]. [H] Secondary antibody control.
Figure 5.
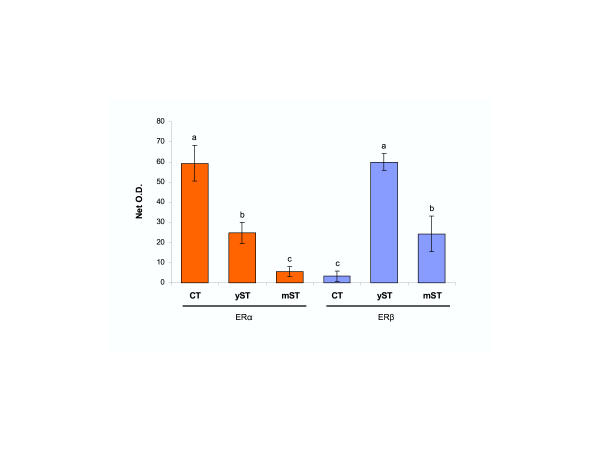
Quantitative evaluation of ERα and ERβ immunoreactivity in late trophoblast cultures. CT, cytotrophoblast; yST, young ST; mST, mature ST (see Fig. 4 for examples). Each column represents mean from six net O.D. measurements ± SD. Different column superscripts indicate significant difference. Details in text.
To determine an association of ERβ and ERα immunoreactivity with differentiation of mononucleated trophoblast cells into syncytial aggregates, we investigated isolated cytotrophoblast cells and young and mature syncytial aggregates in tissue cultures. The trophoblast cultures showed a lack of ERβ immunoreactivity in isolated trophoblast cells (white arrowhead, Fig. 4A). However, strong staining accompanied young (small) syncytial aggregates (y, panels A and B). Cytotrophoblast cells associated with small aggregates showed an increase in ERβ immunoreactivity (arrowhead, panel B). Development of mature ST aggregates (m, panel C) was associated with gradual diminution of nuclear staining (solid > white arrows), but persisting cytoplasmic ERβ immunoreactivity. Panel D shows control staining with PBS and anti-goat secondary antibody. In contrast, ERα immunoreactivity was detected in isolated cultured trophoblast cells (arrowhead, Fig. 4E). The staining persisted in young syncytial aggregates (y, panels E and F) but diminished in mature ST (m, panels F and G). Panel D shows control staining with PBS and anti-mouse secondary antibody.
Quantitative evaluation of ERα and ERβ immunoreactivity in late tissue cultures is shown in Fig. 5. ERα immunoreactivity was highest in isolated CT cells (CT), moderate in young syncytial aggregates (yST) and virtually undetectable (not significantly different from background values) in mature syncytia (mST). However, ERβ immunoreactivity was virtually undetectable in isolated CT cells, highest in young syncytial aggregates, and moderate expression persisted in mature syncytia. Statistical analysis has shown overall ANOVA P < 0.0001), and differences between columns with different superscripts P < 0.01.
Expression of ERα and ERβ proteins in vivo and in vitro (Figure 6)
We used western blot analysis in order to evaluate overall expression of ERα and ERβ proteins in vivo and in cultured trophoblast. Expression of ERα and ERβ proteins was detected in CV, isolated trophoblast cells at time 0 (t:0), and early (EC) and late trophoblast cultures (LC, Fig. 6A). Both ERs showed higher expression in time 0 and early cultures when compared to CV and late trophoblast culture.
We also tested the specificity of primary antibodies in western blots. When the ERβ antibody was pre-absorbed with blocking peptide (PA/ERβ), no bands were detected (Fig. 6B). ERα and ERβ bands in original protein extracts (lanes 1 and 2) and a lack of ER protein bands in cdk2 IPs (lanes 3 and 4) is shown in Fig. 6C. Probing for cyclin E (positive control) showed low molecular weight protein variants in original protein lysates and IPs.
ERβ hormone binding domain (Figure 7 and 8)
Figure 7.
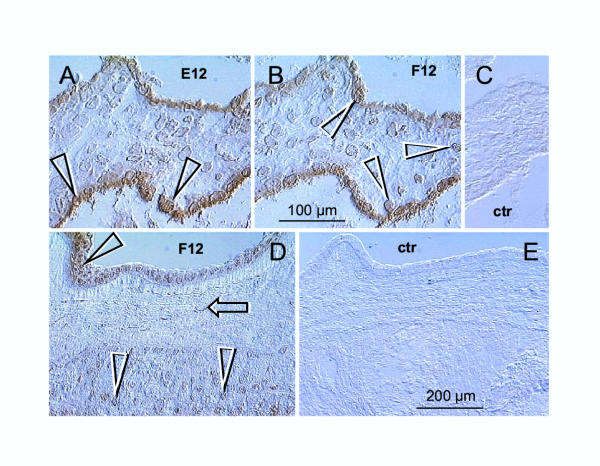
Immunoreactivity of the E12 and F12 antibodies recognizing ERβ hormone binding domain in CV and placental membranes. [A] The E12 antibody shows nuclear-specific localization of ERβ in villous ST (full arrowheads). [B] The F12 antibody shows nuclear-specific localization of ERβ in villous ST and adjacent CT cells merging with ST (white arrowheads). [C] Control for panels [A] and [B]. [D] In placental membranes, the F12 (and E12 – data not shown) antibodies showed nuclear-specific localization of ERβ in amniotic epithelium (full arrowhead), fibroblasts (arrow) and EVT (white arrowheads) – compare with control in [E]. Bar in [B] for [A–C]; bar in [E] for [D and E].
Figure 8.
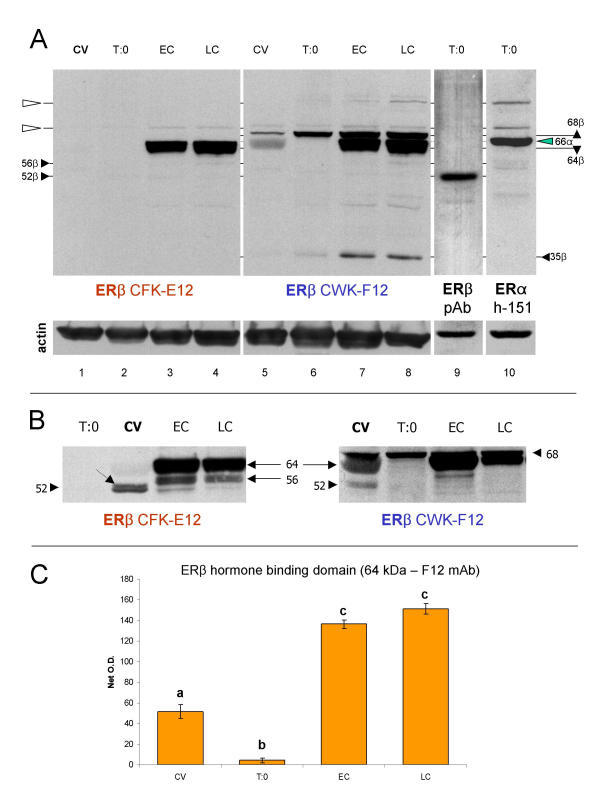
Western blot analysis of ERβ hormone binding domain with E12 and F12 monoclonal antibodies. [A] Both antibodies identify ~64 kDa band, abundant in early (EC) and late cultures (LC). The F12 antibody (lanes 5–8) also identifies a distinct ~68 kDa and ~35 kDa bands, which show enhanced expression in trophoblast cultures. Note a virtual lack of ~52 kDa ERβ band in lanes 1–8, identified by polyclonal antibody [ERβ pAb (N-19)] in lane 9. The N-19 antibody (lane 9) does not show any reactivity except at ~52 kDa. Lane 10 shows ERα (h-151 antibody) band at 66 kDa (green arrowhead), which does not interfere with ~64 and 68 kDa reactivity of E12 and F12 antibodies. Open arrowheads indicate narrow bands, possibly non-specific reactivities shared among monoclonal antibodies. [B] Protein extracts from another placenta show similar character of expression of ~64 kDa ERβ hormone binding domain. Relatively strong ~56 kDa E12 immunoreactivity is also evident in trophoblast cultures. Both antibodies identify a distinct ~52 kDa ERβ in protein extracts from chorionic villi (CV), which is barely detectable in trophoblast cultures. Dotted arrow indicates adjacent ~53 kDa band. [C] Quantitative evaluation of ~64 kDa ERβ protein identified by F12 antibody in [A]. Each column represents a mean from six net O.D. measurements ± SD. Different column superscripts indicate P < 0.01.
Our observations from CV show nuclear specific reactivity of E12 antibody with villous ST (full arrows, Fig. 7A vs. control, 7C). The immunoreactivity of F12 antibody was similar, but the nuclei of cytotrophoblast cells associated with ST were also stained (white arrows, Fig. 7B). Both, E12 and F12 antibodies (Fig. 7D, vs. control, Fig. 7E) showed nuclear immunoreactivity specifically localized in amniotic fibroblasts (arrow), epithelium (full arrowhead) and EVT (white arrowheads).
Western blot analysis with E12 and F12 antibodies (Fig. 8A) showed an abundant expression of a ~64 kDa ERβ protein variant (64β) in trophoblast cultures. The F12 antibody also revealed a distinct ~68 kDa band (68β), above the 66 kDa ERα. The expression of this protein was higher in time 0 and cultured trophoblast (lanes 6–8), as compared to CV (lane 5). This antibody also specifically identified a 35 kDa (35β), probably ERβ protein fragment (see ref. [18]), higher in trophoblast cultures (lanes 7 and 8). However, in protein extracts from CV and trophoblast cultures from this placenta, no prominent band at ~52 kDa was detected by E12 and F12 antibodies (lines 1–8, Fig. 8A).
For comparison, lane 9 shows a distinct single band revealed by ERβ N-19 polyclonal antibody at ~52 kDa (52β) in time 0 trophoblast culture (T:0, ERβ pAb). The reactivity of ERα monoclonal antibody in lane 10 (ERα h-151) indicates a distinct band at 66 kDa (green arrowhead, 66α), not interfering with the ~64 band identified by E12 antibody and ~64 and 68 kDa bands identified by F12 antibody. Note higher molecular weight narrow bands (open arrowheads), probably nonspecific reactivities of ERα and ERβ mouse-anti human monoclonal antibodies.
Figure 8B shows western blot analysis of another placenta. The expression of ~64 kDa ERβ is most prominent in early culture (EC), protein extracts from chorionic villi show distinct ~52 kDa ERβ variant (dotted arrow indicates adjacent ~53 kDa band), and trophoblast cultures show ~56 kDa band identified with E12 antibody in particular.
Quantitative evaluation of ~64 kDa hormone binding domain (Fig. 8C) shows more than three fold increased expression in trophoblast cultures as compared to the CV and time 0 protein extracts. Overall ANOVA was P < 0.0001, post test revealed P < 0.01 differences between columns with different superscripts. The data indicate that the expression of ~64 kDa ERβ protein with hormone binding domain significantly increases in early cultures (EC vs. CV and T:0) and high expression persists in late cultures (LC).
Placental localization of ERα and ERβ immunoreactivity (Table 2)
Table 2.
Expression of ERα, and ~52 and 64 kDa ERβ in human term placentae
| Placental cell type | ERα | ERβ (N-19,~52 kDa) | ERβ (E12, ~64 kDa) |
| Villous cytotrophoblast | +a | -b | - |
| Syncytiotrophoblast | - | +c | +a |
| Vascular pericytes | +d | - | - |
| Endothelial cells | - | +a | - |
| Extravillous trophoblast | - | +d | +a |
| Extravillous fibroblasts | +d | +d | +a |
| Amniotic epithelium | - | +a | +a |
| Decidua | (+)e | +c | - |
aNuclear. bCoexpression with ERα during early differentiation of CT cells. c Cytoplasmic. dNuclear/cytoplasmic. e Rare occurrence.
ERα and ERβ (~52 kDa) immunoreactivity in various placental cell types is summarized in Table 2. From trophoblast cell types, the villous CT expressed ERα only, while ST and EVT showed ERβ. However, CT cells merging with ST and young syncytial aggregates showed expression of both ERs. Other epithelial, mesenchymal or vascular cell types showed either ERα (pericytes) or ERβ (endothelial cells, amniotic epithelium, decidua). Rare decidual cells showed nuclear ERα. Interestingly, nuclear and/or cytoplasmic expression of ERs varied depending on the cell type/stage (see superscripts in Table 2). Both ERs were also detected in some cells in the extravillous connective tissue. Table 2 also shows that expression of ERβ with hormone binding domain (~64 kDa) is exclusively nuclear, associated with ST, EVT, and amniotic epithelium and fibroblasts. Therefore, these placental cell types appear to be responsive to estrogens via the nuclear ERβ hormone binding domain.
Expression of the cell cycle-related proteins in the placenta and derived cultures (Figure 9)
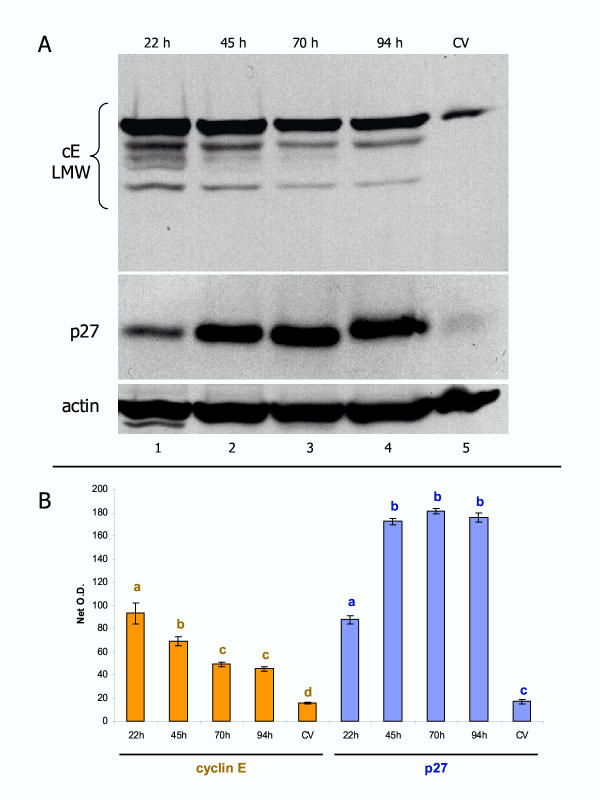
Figure 9.
Representative comparison of cyclin E and p27 protein expression in vivo and in vitro. [A] Normal placenta shows a weak expression of cyclin E low molecular weight variants (cE LMW, lane 5). Early trophoblast culture shows high cE LMW expression (lane 1) followed by gradual diminution (lanes 2–4). p27 expression is also weak in vivo, but gradually increases during trophoblast cultivation. [B] Quantitative evaluation of cE LMW and p27 blots. Each column represents mean from six net O.D. measurements ± SD. Different column superscripts (with identical color) indicate P < 0.001.
To understand better the role of other proteins involved in the regulation of trophoblast proliferation and differentiation in vivo and in vitro, we also compared expression of some cell cycle-related proteins in vivo and in vitro. In normal placentae, the expression of cyclin E (cE), which is involved in the stimulation of cell cycle progression [37], was low, as was that of p27 (cE antagonist) promoting terminal differentiation of cells [38] (lane 5, Fig. 9A). This is in agreement with occasional trophoblast proliferation in normal term placentae [25], apparently not prevented by high p27 expression. In early cultures, expression of both proteins increased significantly (lane 1, Fig. 9A; see also panel B for quantitative evaluation). During culture, initially high expression of cE significantly decreased at 45 and 70 hours, and remained low at 94 hours. However, moderate expression of p27 in early cultures significantly increased at 45 hours and remained extremely high till the end of the culture. These trends were observed in all cultures from normal placentae investigated. Such observations indicate that the p27 antiproliferative effect may play an important role in the prevention of cultured trophoblast proliferation and, therefore, promote an overall tendency of cultured trophoblast cells toward terminal differentiation (see also Discussion).
Discussion
To our knowledge, this is the first study showing placental ERβ protein expression by western blot analysis and ERβ immunoreactivity in placental cell types. We also show a comparison of placental ERα and ERβ protein expression and cellular localization. Our observations indicate that various cellular components of human placenta express either ERα or ERβ. Furthermore, we show in vivo and in vitro that ERα+/ERβ- CT cells differentiate into ERα+/ERβ+ young and ERα-/ERβ+ mature ST aggregates.
In situ hybridization and immunolocalization of ERα and ERβ in a variety of reproductive tract tissues in males and females have shown that in most instances either ERα or ERβ is expressed in a particular cell type, although some cell types, e.g., Leydig cells, ovarian surface epithelium, and epithelial and stromal cells of the uterus and breast, may show expression of both ERs [39-41]. However, since only a proportion of cells were detected to express ERα or ERβ in a single color immunohistochemistry [42], such an approach cannot demonstrate coexpression of the ERs in a particular cell, nor indicate eventual transition from one ER subtype to another during differentiation.
However, recent double color immunohistochemistry experiments indicate that the cells in the mouse proximal efferent ductule epithelium can be separated into three types with distinct expression of ERs: (1) ERα+/ERβ-, (2) ERα+/ERβ+ and (3) ERα-/ERβ+ [43]. The authors did not provide any functional explanation of these observations. Nevertheless, our study also shows that these three types of ER expression can be detected in villous trophoblast. Moreover, our data indicate that there is a switch in ER expression from type (1) ERα+/ERβ- to type (2) ERα+/ERβ+ and finally to type (3) ERα-/ERβ+ during trophoblast differentiation in vivo, and this observation was confirmed by the study of trophoblast differentiation in vitro.
As mentioned in the Introduction, recent studies of the functional significance of ERβ in βERKO mice show that ERα is sufficient for basic differentiation of estrogen-sensitive tissue. However, a lack of ERβ results in a defect in terminally differentiated tissue morphology [23] and indicates that ERβ expression is required for terminal differentiation of estrogen-dependent cells. Our study concurs with such observations, since we show that ERβ expression is associated with terminal differentiation of trophoblast. Moreover, we show a switch from nuclear to cytoplasmic ERβ expression in terminally differentiated ST and EVT. In addition, the decidual cells, which are known to exhibit degenerative changes at term [44], show marked diminution of cytoplasmic ERβ. This suggests that terminal aging and degeneration of estrogen responsive cells are accompanied by a progressive loss of ERβ expression.
Our ERα and ERβ single and dual color immunohistochemistry experiments show that daughter CT cells derived from ERα+ parental cells coexpress both ERs during early stages of differentiation, and lose ERα during their terminal differentiation into the ST. The differentiation of CT was associated with very narrow (~2 μm) ST, which may need complementation by additional CT cells to function. However, the parental and daughter cells showed in vivo differences in nuclear ER immunoreactivity prior to their complete separation. While the parental cell showed high nuclear ERα, the daughter cell associated with ST showed marked diminution of ERα immunoreactivity and an increase of differentiation-associated ERβ protein.
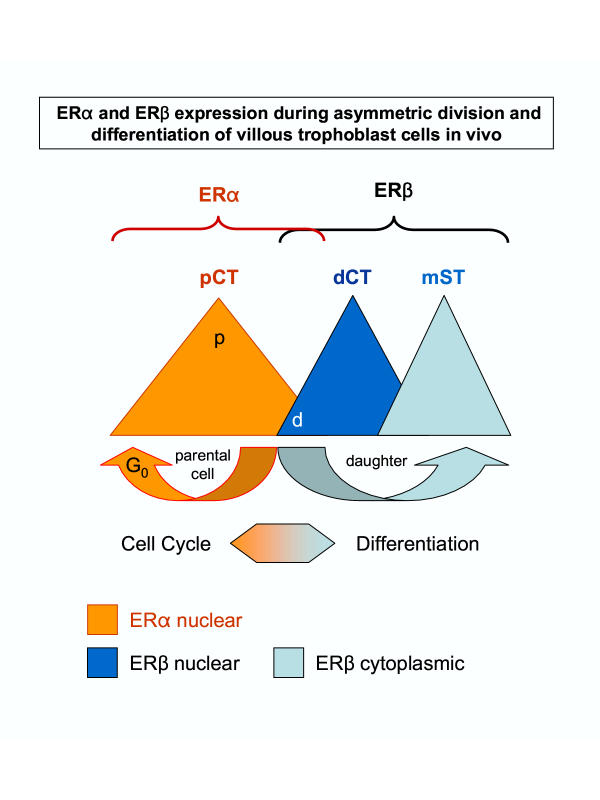
These observations parallel recent studies that postmitotic cells may exhibit asymmetric distribution of the differentiation-associated proteins prior to their separation. Asymmetric division may involve extrinsic (influence of adjacent cells) or intrinsic factors. Among the intrinsic factors underlying asymmetric division, the interactions of the Numb differentiation-associated protein with Notch proliferation-associated signaling is the model most widely studied, ranging from bacteria, yeast, and Drosophila to mammals [30]. When the neuronal progenitor cells undergo asymmetric division (20% in neuronal tissue cell culture) they produce neuronal daughter cells to which Numb protein segregates preferentially, and such daughter cells show an enhanced differentiation of neuronal processes [45]. Interestingly, Numb is firstly associated with one pole of the plasma membrane of a dividing cell, and subsequently with one of the two resulting nuclei [29,45]. Our study indicates that preservation of nuclear ERα in one of two postmitotic cells is associated with the ability of CT to replicate and diminution of ERα and appearance of nuclear ERβ dictates a generation of a daughter cell that is committed to differentiate (Fig. 10).
Figure 10.
Simplified schematic view of ERα and ERβ differential expression during asymmetric division and differentiation of villous trophoblast cells in vivo (postmitotic cell surface and cytoplasmic ERα expression – see ref. [15], is not included). pCT, parental CT; dC1T, differentiating CT; mST, mature ST; p, postmitotic parental cells; d, postmitotic daughter cells. Details in text.
The model presented in Fig. 10 can be used to explain, at least in part, the role of ERs in proliferation and differentiation of other estrogen-dependent cell types. However, it has to be considered that ERs are certainly not the only proteins which are involved in decisions of estrogen-dependent cells to proliferate or differentiate. At least cell cycle related proteins, either suppressors or facilitators, and growth factors and cytokines produced by stromal cells [1,46-49] should be considered in addition to the promitotic effect of E2 mediated via ERα. Figure 10 may not be applicable for transformed cells with abnormal ER variants, or cells exhibiting only one type of ER. For example, expression of ERβ only may indicate that differentiation but not proliferation is estrogen-dependent.
Former studies also indicated that the decision between symmetric and asymmetric division in vivo depends on the mitotic spindle orientation. During fly neurogenesis, the neuroblasts delaminate from a monolayer of ectodermal cells. The ectodermal cells at the surface of the Drosophila embryo divide with the axes of their mitotic spindle parallel to the plane of the ectodermal monolayer. In contrast, a neuroblast divides along the apical-basal axis, so that the axes of its mitotic spindles are perpendicular to the plane of the ectodermal layer. Thus, the mitotic spindle of the neuroblast has to reorientate by 90 degrees from the plane of the ectodermal layer [50].The orientation of the mitotic spindle correlates with the asymmetric distribution of Numb [29].
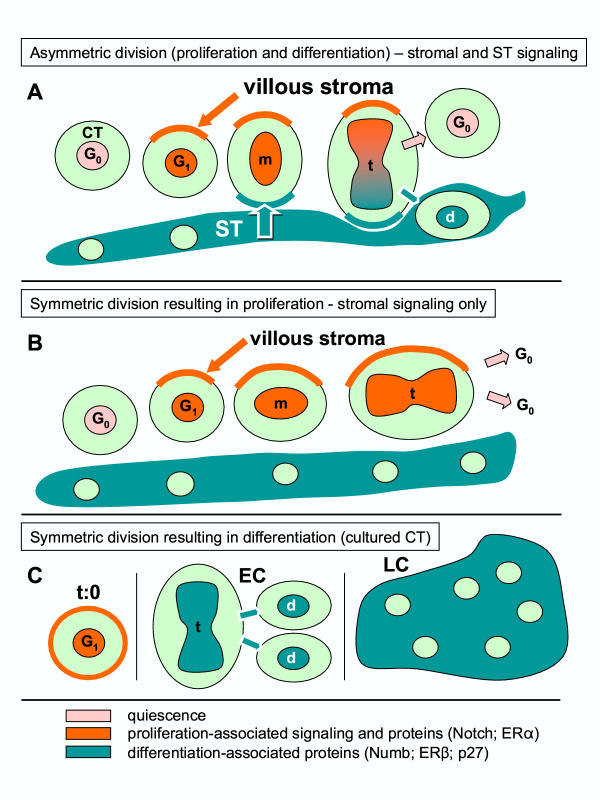
Figure 3A shows that similar perpendicular orientation, i.e., 90 degrees from the plane of ST layer (toward the villous core), applies for asymmetrically dividing villous CT. Hence, in CV, one pole of dividing CT cells is associated with mature ST and the other with the mesenchymal villous core (stroma). It is possible to speculate that the poles of dividing CT cells are influenced differently – the juxta-syncytial pole toward differentiation and juxta-mesenchymal toward proliferation. Therefore, the extrinsic factors (type of neighboring cells) may dictate asymmetric segregation of intrinsic factors determining the fate of dividing cells. In other words, asymmetric division in vivo may be a result of the influence of both extrinsic and intrinsic factors. If so, the extrinsic factors should be viewed as inducers and intrinsic factors as effectors of asymmetric division. Based on available data [29,30,45,50-52] and our observations, a possible sequence of events involved in asymmetric division of villous CT cells is given in Figure 11A. Note an involvement of stromal (stimulation of CT division) and ST signaling (stimulation of cell differentiation). Figure 11B indicates that symmetric division of ST may result from the presence of stromal and absence of ST signaling.
Figure 11.
Structure-related arrangement of asymmetric division (proliferation and differentiation) of villous CT cells. [A], symmetric division resulting in proliferation [B], and symmetric division resulting in differentiation [C]. m, metaphase; t, telophase; d, differentiating cell; EC, early trophoblast culture; LC, late culture. Relevant references and details are given in text.
However, perpendicular orientation of dividing trophoblast cells in vivo cannot be achieved in vitro, because the complex villous structure, and the villous core in particular, is absent. Although ERα > ERβ transition was also observed during trophoblast differentiation in culture, the cultured trophoblast cells are expected to undergo symmetric division toward the differentiated phenotype rather than asymmetric division. Indeed, early cultures show proliferating CT cells, which are gradually transformed into the differentiating CT cells and syncytial aggregates during the culture [15], possibly due to the prevalence of differentiation signals in the absence of stromal signaling (Figure 11C). This view is supported by gradual diminution of promitotic cyclin E and an increase of antimitotic p27 proteins during trophoblast culture (Fig. 9). Finally, regarding the placenta, it is important to consider the stage of pregnancy. For early pregnancy, the scheme in Figure 10 can possibly be extended to other cell types (decidua, EVT), in contrast to the term placenta where only villous CT cells are dividing [25-27].
We recently showed that exogenous E2 markedly stimulates development of large syncytial aggregates in trophoblast cultures [15]. We also observed that this effect can be abolished with pure anti-estrogen ICI 182,780 (unpublished data). These data indicate that trophoblast differentiation is estrogen-dependent. Since trophoblast differentiation is associated with transition from ERα to ERβ expression, with temporary co-expression of both, one may assume that both ERs are involved in estrogen stimulated trophoblast differentiation. Since production of placental hormones is characteristic of mature syncytium [5,9,11,53,54], which shows in vivo cytoplasmic ERβ expression only, one may also assume that estrogens stimulate production of placental hormones by ST.
Studies on localization and expression of ERβ hormone binding domain recognized by E12 and F12 monoclonal antibodies in human placenta are of particular interest. Immunohistochemical studies with these antibodies by Choi et al. [18] revealed nuclear-specific localization of the ERβ protein in granulosa cells of the rat ovary and in epithelial and some stromal cells of mouse and rat epididymis. Specificity of the E12 and F12 monoclonal antibodies was verified by western blot analysis using baculovirus expressed form of human ERβ (53 kDa) [18]. These antibodies were also reported to identify an additional ~62–64 kDa band in protein extracts from granulosa cells of several mammalian species, in addition to the ~52 kDa band [18].
Our observations on human placenta show that E12 and F12 antibodies exhibit nuclear-specific reactivity with placental ST. Therefore, cytoplasmic reactivity in mature ST detected by N-19 polyclonal antibody, which recognizes a single ~52 kDa band, might not be related to the ERβ variant with a hormone binding domain. Indeed, in human trophoblast cultures, the E12 and F12 antibodies are shown to exhibit virtually no reactivity with the ~52 kDa variant and the N-19 polyclonal antibody shows no reactivity at ~64 kDa. Therefore, one may speculate that the placental ~52 kDa ERβ variant is not necessarily a hormone binding protein. One may also assume that the placental ERβ hormone binding variant recognized by E12 and F12 antibodies does not contain or expose epitopes which are recognized by the N-19 ERβ polyclonal antibody which shows reactivity with trophoblast cultures. The E12 and F12 antibodies have been shown to react with baculovirus expressed ~53 kDa form of human ERβ protein [18]. Yet, it is possible that mammalian cells naturally expressing ERβ produce two protein variants, with and without ERβ hormone binding domain, resulting from (post-) translational modifications of the ERβ protein.
Interestingly, villous cytotrophoblast cells merging with syncytium showed nuclear-specific F12, but not E12 immunoreactivity. Hence, the epitope associated with the ~64 kDa ERβ hormone binding variant recognized by E12 and F12 can be excluded, but the ~68 kDa variant recognized by F12 might be considered to be involved in early trophoblast differentiation. Since the F12 antibody also failed to recognize a distinct ~52 kDa band in human granulosa cell protein extracts [18], and the E12 antibody did not show any reactivity at ~68 kDa, one may speculate that the ~68 kDa band might be another ERβ protein variant. Indeed, it has been indicated that it is unlikely that the E12 and F12 antibodies recognize exactly the same state of the epitope since the F12 antibody was much more efficient in immunoprecipitation of the native ERβ protein generated in vitro [18]. We also show that E12 antibody identifies the ~56 kDa band in trophoblast cultures barely visible in extracts analyzed by F12 antibody (Fig. 8B).
Nevertheless, as compared to CV and time 0 protein extracts, trophoblast differentiation in early and late tissue cultures was associated with a more than three fold increase of the ~64 kDa ERβ hormone binding variant (Fig. 8C), while the ~52 kDa protein identified by N-19 polyclonal antibody showed a tendency to decline in late cultures (Fig. 6A). Therefore, the ERβ hormone binding protein appears to play a dominant role in the hormone-stimulated terminal differentiation of trophoblast, while the ~52 kDa ERβ protein might be somehow related to the non-hormonal regulation of early stages of trophoblast differentiation (see proposed role of ERβ in asymmetric division of estrogen-dependent cells discussed above). The importance of ERβ hormone binding variants in stimulation of terminal trophoblast differentiation is supported by our observation on the stimulatory effect of E2 for the formation of large syncytial aggregates [15].
From the above it appears that in human placenta, there are at least two ERβ proteins: (1) the cytoplasmic and nuclear ~52 kDa ERβ with N-terminal related epitopes recognized by N-19 polyclonal antibody and lacking a hormone binding domain recognized by the E12 and F12 antibodies, and (2) the nuclear-specific ~64 kDa ERβ with a hormone binding domain recognized by E12 and F12 antibodies and lacking epitopes recognized by N-19 polyclonal antibody. The existence of these two distinct ERβ proteins is particularly supported by their different expression in trophoblast cultures (compare Fig. 6A and 8A and 8B). A possibility exists that there is an additional ~68 kDa ERβ protein, which is recognized exclusively by the F12 antibody (Fig. 8A and 8B) and expressed in the nuclei of early differentiating trophoblast cells merging with ST (Fig. 7B).
Conclusion
In conclusion, our observations concur with recent views on the importance of ERα in the proliferation and ERβ in the maturation of estrogen-dependent cells. Asymmetric segregation of ERα in dividing villous CT cells, accompanied by appearance of ERβ in differentiating daughter cells, suggests a unique role of ERs in asymmetric division of estrogen-dependent cells. Significantly enhanced expression of the ~64 kDa ERβ hormone binding variant in differentiating trophoblast cells and stimulation of trophoblast differentiation by estrogens indicates a unique role of the ERβ hormone binding domain in the regulation of placental function. Since ST is a major source of placental hormones, which ensure optimal conditions for the fetus and mother, ERβ expression by ST may be involved in stimulation of placental hormonal production by estrogens.
Acknowledgments
Acknowledgment
Supported by Physician's Medical Education and Research Foundation grant #93040, Knoxville, Tennessee, to A.B. We thank Dr. Benita S. Katzenellenbogen of the Department of Molecular and Integrative Physiology, University of Illinois College of Medicine, Urbana, Illinois, for generous gift of CWK-F12 and CFK-E12 anti-ERβ monoclonal antibodies. Skillful technical assistance of Martina Hajkova, M.S., is gratefully acknowledged.
Contributor Information
Antonin Bukovsky, Email: rbe@utk.edu.
Michael R Caudle, Email: MCaudle@mc.utmck.edu.
Maria Cekanova, Email: mcekanov@utk.edu.
Romaine I Fernando, Email: rfernan2@utk.edu.
Jay Wimalasena, Email: jwimalas@utk.edu.
James S Foster, Email: stefano5@hotmail.com.
Donald C Henley, Email: dchenley99@yahoo.com.
Robert F Elder, Email: RElder@mc.utmck.edu.
References
- Diel P. Tissue-specific estrogenic response and molecular mechanisms. Toxicol Lett. 2002;127:217–224. doi: 10.1016/s0378-4274(01)00503-3. [DOI] [PubMed] [Google Scholar]
- Younes MA, Besch NF, Besch PK. Estradiol and progesterone binding in human term placental cytosol. Am J Obstet Gynecol. 1981;141:170–174. doi: 10.1016/s0002-9378(16)32586-8. [DOI] [PubMed] [Google Scholar]
- Kneussl ES, Ances IG, Albrecht ED. A specific cytosolic estrogen receptor in human term placenta. Am J Obstet Gynecol. 1982;144:803–809. doi: 10.1016/0002-9378(82)90356-8. [DOI] [PubMed] [Google Scholar]
- Khan-Dawood FS, Dawood MY. Estrogen and progesterone receptor and hormone levels in human myometrium and placenta in term pregnancy. Am J Obstet Gynecol. 1984;150:501–505. doi: 10.1016/s0002-9378(84)90428-9. [DOI] [PubMed] [Google Scholar]
- Castracane VD, Goldzieher JW. The relationship of estrogen to placental steroidogenesis in the baboon. J Clin Endocrinol Metab. 1986;62:1163–1166. doi: 10.1210/jcem-62-6-1163. [DOI] [PubMed] [Google Scholar]
- Baggia S, Albrecht ED, Pepe GJ. Regulation of 11 beta-hydroxysteroid dehydrogenase activity in the baboon placenta by estrogen. Endocrinology. 1990;126:2742–2748. doi: 10.1210/endo-126-5-2742. [DOI] [PubMed] [Google Scholar]
- Petraglia F, Vaughan J, Vale W. Steroid hormones modulate the release of immunoreactive gonadotropin-releasing hormone from cultured human placental cells. J Clin Endocrinol Metab. 1990;70:1173–1178. doi: 10.1210/jcem-70-4-1173. [DOI] [PubMed] [Google Scholar]
- Chibbar R, Wong S, Miller FD, Mitchell BF. Estrogen stimulates oxytocin gene expression in human chorio-decidua. J Clin Endocrinol Metab. 1995;80:567–572. doi: 10.1210/jcem.80.2.7852522. [DOI] [PubMed] [Google Scholar]
- Shanker YG, Rao AJ. Regulation of progesterone biosynthesis in the human placenta by estradiol 17 beta and progesterone. Biochem Mol Biol Int. 1997;43:591–599. doi: 10.1080/15216549700204401. [DOI] [PubMed] [Google Scholar]
- Sun K, Yang K, Challis JR. Regulation of 11beta-hydroxysteroid dehydrogenase type 2 by progesterone, estrogen, and the cyclic adenosine 5'-monophosphate pathway in cultured human placental and chorionic trophoblasts. Biol Reprod. 1998;58:1379–1384. doi: 10.1095/biolreprod58.6.1379. [DOI] [PubMed] [Google Scholar]
- Pepe GJ, Albrecht ED. Regulation of functional differentiation of the placental villous syncytiotrophoblast by estrogen during primate pregnancy. Steroids. 1999;64:624–627. doi: 10.1016/s0039-128x(99)00043-4. [DOI] [PubMed] [Google Scholar]
- Taddei G, Noei I, Periti E, Borri P, Torricelli F, Tozzi P, Moncini D, Paglierani M, Branconi F. Chorion villosum does not express progesterone and estrogen receptors during the first trimester of pregnancy. Gynecol Obstet Invest. 1996;42:77–79. doi: 10.1159/000291895. [DOI] [PubMed] [Google Scholar]
- Rossmanith WG, Wolfahrt S, Ecker A, Eberhardt E. The demonstration of progesterone, but not of estrogen, receptors in the developing human placenta. Horm Metab Res. 1997;29:604–610. doi: 10.1055/s-2007-979109. [DOI] [PubMed] [Google Scholar]
- Laminski NA, Hammond KD. Receptors for oestradiol in human placenta. Placenta. 1985;6:383–389. doi: 10.1016/s0143-4004(85)80015-1. [DOI] [PubMed] [Google Scholar]
- Bukovsky A, Cekanova M, Caudle MR, Wimalasena J, Foster JS, Henley DC, Elder RF. Expression and localization of estrogen receptor-alpha protein in normal and abnormal term placentae and stimulation of trophoblast differentiation by estradiol. Reprod Biol Endocrinol. 2003;1:13. doi: 10.1186/1477-7827-1-13. [DOI] [PMC free article] [PubMed] [Google Scholar]
- Rosenfeld CS, Wagner JS, Roberts RM, Lubahn DB. Intraovarian actions of oestrogen. Reproduction. 2001;122:215–226. doi: 10.1530/rep.0.1220215. [DOI] [PubMed] [Google Scholar]
- Girdler F, Brotherick I. The oestrogen receptors (ER alpha and ER beta) and their role in breast cancer: a review. The Breast. 2000;9:194–200. doi: 10.1054/brst.2000.0203. [DOI] [PubMed] [Google Scholar]
- Choi I, Ko C, Park-Sarge OK, Nie R, Hess RA, Graves C, Katzenellenbogen BS. Human estrogen receptor beta-specific monoclonal antibodies: characterization and use in studies of estrogen receptor beta protein expression in reproductive tissues. Mol Cell Endocrinol. 2001;181:139–150. doi: 10.1016/s0303-7207(01)00492-0. [DOI] [PubMed] [Google Scholar]
- Yang P, Kriatchko A, Roy SK. Expression of ER-alpha and ER-beta in the hamster ovary: differential regulation by gonadotropins and ovarian steroid hormones. Endocrinology. 2002;143:2385–2398. doi: 10.1210/endo.143.6.8858. [DOI] [PubMed] [Google Scholar]
- Gustafsson JA. Estrogen receptor beta – a new dimension in estrogen mechanism of action. J Endocrinol. 1999;163:379–383. doi: 10.1677/joe.0.1630379. [DOI] [PubMed] [Google Scholar]
- Gustafsson JA, Warner M. Estrogen receptor beta in the breast: role in estrogen responsiveness and development of breast cancer. J Steroid Biochem Mol Biol. 2000;74:245–248. doi: 10.1016/s0960-0760(00)00130-8. [DOI] [PubMed] [Google Scholar]
- Couse JF, Korach KS. Contrasting phenotypes in reproductive tissues of female estrogen receptor null mice. Ann N Y Acad Sci. 2001;948:1–8. doi: 10.1111/j.1749-6632.2001.tb03981.x. [DOI] [PubMed] [Google Scholar]
- Forster C, Makela S, Warri A, Kietz S, Becker D, Hultenby K, Warner M, Gustafsson JA. Involvement of estrogen receptor beta in terminal differentiation of mammary gland epithelium. Proc Natl Acad Sci U S A. 2002;99:15578–15583. doi: 10.1073/pnas.192561299. [DOI] [PMC free article] [PubMed] [Google Scholar]
- O'Brien ML, Park K, In Y, Park-Sarge OK. Characterization of estrogen receptor-beta (ERbeta) messenger ribonucleic acid and protein expression in rat granulosa cells. Endocrinology. 1999;140:4530–4541. doi: 10.1210/endo.140.10.7032. [DOI] [PubMed] [Google Scholar]
- Arnholdt H, Meisel F, Fandrey K, Lohrs U. Proliferation of villous trophoblast of the human placenta in normal and abnormal pregnancies. Virchows Arch B Cell Pathol Incl Mol Pathol. 1991;60:365–372. doi: 10.1007/BF02899568. [DOI] [PubMed] [Google Scholar]
- Esterman A, Greco MA, Mitani Y, Finlay TH, Ismail-Beigi F, Dancis J. The effect of hypoxia on human trophoblast in culture: morphology, glucose transport and metabolism. Placenta. 1997;18:129–136. doi: 10.1016/s0143-4004(97)90084-9. [DOI] [PubMed] [Google Scholar]
- Yamada Z, Kitagawa M, Takemura T, Hirokawa K. Effect of maternal age on incidences of apoptotic and proliferative cells in trophoblasts of full-term human placenta. Mol Hum Reprod. 2001;7:1179–1185. doi: 10.1093/molehr/7.12.1179. [DOI] [PubMed] [Google Scholar]
- Shih IM, Kurman RJ. Ki-67 labeling index in the differential diagnosis of exaggerated placental site, placental site trophoblastic tumor, and choriocarcinoma: a double immunohistochemical staining technique using Ki-67 and Mel-CAM antibodies. Hum Pathol. 1998;29:27–33. doi: 10.1016/s0046-8177(98)90386-0. [DOI] [PubMed] [Google Scholar]
- Jan YN, Jan LY. Asymmetric cell division. Nature. 1998;392:775–778. doi: 10.1038/33854. [DOI] [PubMed] [Google Scholar]
- Shen Q, Temple S. Creating asymmetric cell divisions by skewing endocytosis. Sci STKE. 2002;2002:E52. doi: 10.1126/stke.2002.162.pe52. [DOI] [PubMed] [Google Scholar]
- Conboy IM, Rando TA. The regulation of Notch signaling controls satellite cell activation and cell fate determination in postnatal myogenesis. Dev Cell. 2002;3:397–409. doi: 10.1016/s1534-5807(02)00254-x. [DOI] [PubMed] [Google Scholar]
- French MB, Koch U, Shaye RE, McGill MA, Dho SE, Guidos CJ, McGlade CJ. Transgenic expression of numb inhibits notch signaling in immature thymocytes but does not alter T cell fate specification. J Immunol. 2002;168:3173–3180. doi: 10.4049/jimmunol.168.7.3173. [DOI] [PubMed] [Google Scholar]
- McKenzie JL, Fabre JW. Human Thy-1: unusual localization and possible functional significance in lymphoid tissues. J Immunol. 1981;126:843–850. [PubMed] [Google Scholar]
- Williams AF, Parekh RB, Wing DR, Willis AC, Barclay AN, Dalchau R, Fabre JW, Dwek RA, Rademacher TW. Comparative analysis of the N-glycans of rat, mouse and human Thy-1. Site-specific oligosaccharide patterns of neural Thy-1, a member of the immunoglobulin superfamily. Glycobiology. 1993;3:339–348. doi: 10.1093/glycob/3.4.339. [DOI] [PubMed] [Google Scholar]
- Sternberger LA, Joseph SA. The unlabelled antibody method. Contrasting color staining of paired hormones without antibody removal. J Histochem Cytochem. 1979;27:1424–1429. doi: 10.1177/27.11.92498. [DOI] [PubMed] [Google Scholar]
- McKenzie PP, Foster JS, House S, Bukovsky A, Caudle MR, Wimalasena J. Expression of G1 cyclins and cyclin-dependent kinase-2 activity during terminal differentiation of cultured human trophoblast. Biol Reprod. 1998;58:1283–1289. doi: 10.1095/biolreprod58.5.1283. [DOI] [PubMed] [Google Scholar]
- Hayashi H, Ogawa N, Ishiwa N, Yazawa T, Inayama Y, Ito T, Kitamura H. High cyclin E and low p27/Kip1 expressions are potentially poor prognostic factors in lung adenocarcinoma patients. Lung Cancer. 2001;34:59–65. doi: 10.1016/s0169-5002(01)00211-2. [DOI] [PubMed] [Google Scholar]
- McArthur GA, Foley KP, Fero ML, Walkley CR, Deans AJ, Roberts JM, Eisenman RN. MAD1 and p27(KIP1) cooperate to promote terminal differentiation of granulocytes and to inhibit Myc expression and cyclin E-CDK2 activity. Mol Cell Biol. 2002;22:3014–3023. doi: 10.1128/MCB.22.9.3014-3023.2002. [DOI] [PMC free article] [PubMed] [Google Scholar]
- Mowa CN, Iwanaga T. Differential distribution of oestrogen receptor-alpha and -beta mRNAs in the female reproductive organ of rats as revealed by in situ hybridization. J Endocrinol. 2000;165:59–66. doi: 10.1677/joe.0.1650059. [DOI] [PubMed] [Google Scholar]
- Wang H, Eriksson H, Sahlin L. Estrogen receptors alpha and beta in the female reproductive tract of the rat during the estrous cycle. Biol Reprod. 2000;63:1331–1340. doi: 10.1095/biolreprod63.5.1331. [DOI] [PubMed] [Google Scholar]
- Pelletier G, El Alfy M. Immunocytochemical localization of estrogen receptors alpha and beta in the human reproductive organs. J Clin Endocrinol Metab. 2000;85:4835–4840. doi: 10.1210/jcem.85.12.7029. [DOI] [PubMed] [Google Scholar]
- Jarvinen TA, Pelto-Huikko M, Holli K, Isola J. Estrogen receptor beta is coexpressed with ERalpha and PR and associated with nodal status, grade, and proliferation rate in breast cancer. Am J Pathol. 2000;156:29–35. doi: 10.1016/s0002-9440(10)64702-5. [DOI] [PMC free article] [PubMed] [Google Scholar]
- Zhou Q, Nie R, Prins GS, Saunders PT, Katzenellenbogen BS, Hess RA. Localization of androgen and estrogen receptors in adult male mouse reproductive tract. J Androl. 2002;23:870–881. [PubMed] [Google Scholar]
- Benirschke K, Kaufmann P. Pathology of the Human Placenta. 3. New York: Springer; 1995. [Google Scholar]
- Shen Q, Zhong W, Jan YN, Temple S. Asymmetric Numb distribution is critical for asymmetric cell division of mouse cerebral cortical stem cells and neuroblasts. Development. 2002;129:4843–4853. doi: 10.1242/dev.129.20.4843. [DOI] [PubMed] [Google Scholar]
- Klotz DM, Hewitt SC, Ciana P, Raviscioni M, Lindzey JK, Foley J, Maggi A, DiAugustine RP, Korach KS. Requirement of estrogen receptor-alpha in insulin-like growth factor-1 (IGF-1)-induced uterine responses and in vivo evidence for IGF-1/estrogen receptor cross-talk. J Biol Chem. 2002;277:8531–8537. doi: 10.1074/jbc.M109592200. [DOI] [PubMed] [Google Scholar]
- Buchanan DL, Kurita T, Taylor JA, Lubahn DB, Cunha GR, Cooke PS. Role of stromal and epithelial estrogen receptors in vaginal epithelial proliferation, stratification, and cornification. Endocrinology. 1998;139:4345–4352. doi: 10.1210/endo.139.10.6241. [DOI] [PubMed] [Google Scholar]
- Kanai M, Shiozawa T, Xin L, Nikaido T, Fujii S. Immunohistochemical detection of sex steroid receptors, cyclins, and cyclin-dependent kinases in the normal and neoplastic squamous epithelia of the uterine cervix. Cancer. 1998;82:1709–1719. doi: 10.1002/(sici)1097-0142(19980501)82:9<1709::aid-cncr18>3.0.co;2-8. [DOI] [PubMed] [Google Scholar]
- Cooke PS, Buchanan DL, Young P, Setiawan T, Brody J, Korach KS, Taylor J, Lubahn DB, Cunha GR. Stromal estrogen receptors mediate mitogenic effects of estradiol on uterine epithelium. Proc Natl Acad Sci U S A. 1997;94:6535–6540. doi: 10.1073/pnas.94.12.6535. [DOI] [PMC free article] [PubMed] [Google Scholar]
- Kraut R, Chia W, Jan LY, Jan YN, Knoblich JA. Role of inscuteable in orienting asymmetric cell divisions in Drosophila. Nature. 1996;383:50–55. doi: 10.1038/383050a0. [DOI] [PubMed] [Google Scholar]
- Cayouette M, Raff M. Asymmetric segregation of Numb: a mechanism for neural specification from Drosophila to mammals. Nat Neurosci. 2002;5:1265–1269. doi: 10.1038/nn1202-1265. [DOI] [PubMed] [Google Scholar]
- Petersen PH, Zou K, Hwang JK, Jan YN, Zhong W. Progenitor cell maintenance requires numb and numblike during mouse neurogenesis. Nature. 2002;419:929–934. doi: 10.1038/nature01124. [DOI] [PubMed] [Google Scholar]
- Kliman HJ, Nestler JE, Sermasi E, Sanger JM, Strauss JF. Purification, characterization, and in vitro differentiation of cytotrophoblasts from human term placentae. Endocrinology. 1986;118:1567–1582. doi: 10.1210/endo-118-4-1567. [DOI] [PubMed] [Google Scholar]
- Petraglia F, de Micheroux AA, Florio P, Salvatori M, Gallinelli A, Cela V, Palumbo MA, Genazzani AR. Steroid-protein interaction in human placenta. J Steroid Biochem Mol Biol. 1995;53:227–231. doi: 10.1016/0960-0760(95)00052-2. [DOI] [PubMed] [Google Scholar]


