Abstract
Circadian rhythms possess the ability to robustly entrain to the environmental cycles. This ability relies on the phase synchronization of circadian rhythm gene regulation to different environmental cues, of which light is the most obvious and important. The elucidation of the mechanism of circadian entrainment requires an understanding of circadian phase behavior. This article presents two phase analyses of oscillatory systems for infinitesimal and finite perturbations based on isochrons as a phase metric of a limit cycle. The phase response curve of circadian rhythm can be computed from the results of the analyses. The application to a mechanistic Drosophila circadian rhythm model gives experimentally testable hypotheses for the control mechanisms of circadian phase responses and evidence for the role of phase and period modulations in circadian photic entrainment.
INTRODUCTION
Circadian rhythms regulate the daily activity cycle of many different species, from the unimolecular Neurospora to highly multicellular mammals, as an evolutionary adaptation to the earth's rotation. The rhythm is governed by the regulation of several key genes which produces endogenous oscillations of the mRNA and protein levels with a period of ∼24 h (hence the term circadian, meaning approximately a day). Although the genes differ from species to species, the architectures of different circadian gene networks are remarkably preserved, suggesting an evolutionary convergence (1). This architecture consists of multiple feedback loops (coupled negative and positive feedbacks) producing a limit-cycle oscillator. Advances in genetics and molecular biology have begun to elucidate the circadian genes and their roles in different organisms including cyanobacteria, Neurospora, fruit fly (Drosophila), and mammals (2). The effectors of circadian rhythm control many hormonal, physiological, and psychomotor performance functions, which, among other things, impart the organism's rest-activity cycle (3).
Biological systems, including circadian rhythms, are known to exhibit robustness to internal and external disturbances (4–6). Here, robustness constitutes the ability to maintain certain functions under extrinsic and intrinsic uncertainties (7). The endogenous circadian period shows little dependence to temperature fluctuations (external) (8) and inherent stochastic noise in gene expression (internal) (9,10). One key feature of circadian rhythms is their ability to robustly entrain or phase-synchronize to natural cycles, such as day and night. This feature is also the least understood process in chronobiology (11,12). Many circadian disorders arise because of the failure of an organism in entraining its internal circadian clock to the environmental light-dark cycles (13).
Entrainment refers to an active (dynamic) synchronization response of a free-running oscillator to a cyclic input. The dynamic nature of entrainment is exemplified in the phase response curve (PRC), in which phase shifts depend on the internal circadian phase at the entraining cue application (14). To elucidate the mechanisms of circadian entrainment necessitates an understanding of circadian phase behavior. Existing studies on the robustness of circadian rhythms mainly focused on the amplitude and period sensitivity analysis (7,15,16), which do not directly convey the circadian phase behavior. Period sensitivity only measures cycle-to-cycle phase change, and amplitude sensitivity has no direct correlation with the phase. Though arguably of higher importance than, for example, the period, there has been little study on the phase behavior analysis of circadian rhythms.
Circadian rhythms represent only one example of oscillatory systems in biology. Other important oscillating systems include cell cycle and neuronal activity. The key attributes of these systems, including period and phase, do not directly translate into the traditional framework of sensitivity analysis. This work presents systems theoretic tools based on isochrons for analyzing the phase response of oscillatory systems to perturbations in system parameters. Two phase response analyses with respect to infinitesimal and finite parameter variations are presented. The former builds on the analysis developed for oscillatory chemical systems (17), with extensions to other phase response measures (such as the PRC). The latter method provides a phase analysis with respect to finite parameter perturbations for which the linearity assumption in local sensitivity analysis may fail (such as in modeling light input in the circadian rhythm (18)). The utility of these analyses are demonstrated using two Drosophila circadian rhythm models (19,20). The analysis of a mechanistic Drosophila circadian model (19) suggests for the underlying mechanism for photic entrainment in Drosophila.
PRELIMINARY
The systems considered in this work are described by coupled ordinary differential equations,
 |
(1) |
where x ∈ Rn denotes the states, p ∈ Rm denotes the parameters, t is the time, and f is a vector of (nonlinear) functions of the states and parameters. The states typically represent the mRNA and protein concentrations, and the parameters consist of the kinetic constants of different processes such as transcription, translation, and phosphorylation. The state trajectory x(t) is assumed to evolve to an asymptotically stable limit cycle (a closed trajectory in the state space such as shown in Fig. 1), independent from the initial conditions.
FIGURE 1.
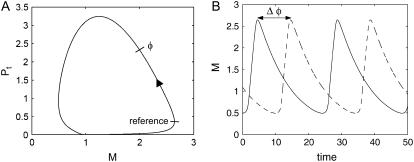
(A) An asymptotically stable limit cycle of a simple two-state Drosophila circadian model. The phase φ is defined as the time distance between the reference and the current state on the limit cycle (modulo the period). (B) Two trajectories in a limit cycle with a phase difference of Δφ; the solid trajectory leads the dashed, or vice versa, the dashed trajectory lags the solid.
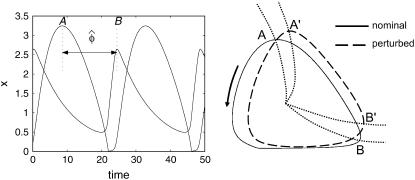
Before discussing the phase response analysis, it is important to define the meaning of “phase”. The phase φ in a limit cycle refers to the (relative) position on the orbit, which is measured here by the elapsed time (modulo the period) to go from a reference point to the current position on the limit cycle (see Fig. 1). Consequently, time and phase are interchangeable when the trajectory is on the limit cycle. In addition, the phase difference between two trajectories can be defined as the difference in the time it takes for each trajectory to achieve the same phase on the limit cycle (again, modulo the period), as illustrated in Fig. 1. Thus, a positive-phase difference implies a phase lag and a negative value implies a phase lead. Note that this assignment differs from the common convention in chronobiology, in which the converse is used; a negative phase difference describes a phase lag (21).
ISOCHRONS
The enabling concept for quantifying phase in the current work would be phase-level sets known as isochrons (22). An isochron of a limit cycle is a set of points from which state trajectories evolve to the same phase on the limit cycle (as t → ∞). In a two-state system, the isochrons η(t) can be visualized as lines traversing the limit cycle (see Fig. 2). Naturally, the isochron η(t) overlaps with the isochron η(t + kτ) where k is an integer and τ is the period. Isochrons have been used extensively in investigating the dynamics of neural oscillators (see for example (23–25)). This concept has also been applied to qualitatively illustrate phase resetting in circadian rhythm (11).
FIGURE 2.
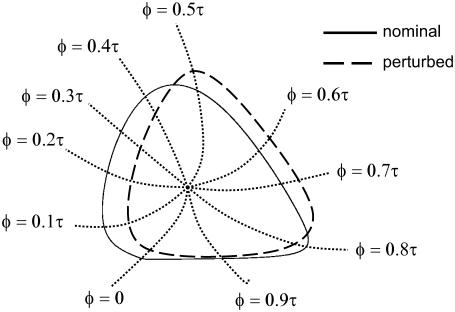
A hypothetical two-state limit cycle model and a corresponding perturbed limit cycle. The role of isochrons is to transform the state space into one variable phase axis. The phase of other limit cycles in the same state space can be measured using the nominal isochrons.
The phase difference between two points in the basin of attraction of a limit cycle (not necessarily on the orbit) can be directly computed as the time difference between the isochrons to which these points belong. This phase definition is equivalent to measuring the time difference between two trajectories to reach the same isochron. In other words, the isochrons act as the phase grids of a limit cycle. Direct computation of the isochrons is prohibitively expensive, especially for higher-order systems. The usual approach employs a phase model or a coordinate transformation to phase variables (22,24). Another method involves backward integration of the system starting from the limit cycle, and collection of points at a time interval of the period (J. Moehlis, University of California Santa Barbara, private communication, 2005). In this work, the analyses do not require the full mapping of the isochrons.
PHASE RESPONSE ANALYSIS
Infinitesimal parameter perturbation
The influence of an infinitesimal parameter perturbation on the system outputs fits into the framework of sensitivity analysis. First-order sensitivity coefficients provide the most direct quantification,
 |
(2) |
where Si,j is the sensitivity coefficient of the ith system output yi with respect to the jth parameter pj (27). Although this definition implicitly assumes the continuity of the output with respect to the parameters, such analysis has been developed for systems in which this assumption does not hold, such as in discrete stochastic systems (28). The system outputs typically comprise the states or some functions of the states, and thus the coefficients in Eq. 2 can be computed directly from the state sensitivities. However, in circadian rhythm and other oscillatory systems, the system attributes including period and phase cannot be easily represented as algebraic functions of the states, and thus necessitates developing a different type of sensitivity analysis.
There exist several methods to compute the state sensitivities from Eq. 1 such as Direct, Green's function, and finite difference methods (27). The Direct and Green's function methods obtain the sensitivities by solving the derivative of Eq. 1 with respect to each parameter,
 |
(3) |
where J(t) is the Jacobian matrix of f with respect to x (i.e., Ji, j = ∂fi/∂xj). The initial conditions to Eq. 3 are typically zero except when pj is an initial condition of Eq. 1. The latter method solves a different differential equation for the Green's function matrix 
 |
(4) |
with the initial condition  . The sensitivities can be computed from the Green's function matrix according to
 |
(5) |
Since t′ is the integrating variable, the adjoint of Eq. 4 is a more practical system to solve, as
 |
(6) |
where  and the final value condition is
  . The adjoint Green function
  must be solved backward in time t′. This method becomes more efficient than the Direct method when m > n.
Phase sensitivity to initial conditions
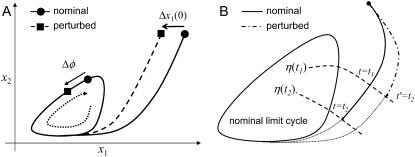
The phase response with respect to infinitesimal variations in initial condition (IC) represents the simplest phase analysis, but is necessary for the development of more complicated parametric sensitivity. The effect of changes in IC is only transient, i.e., the perturbed trajectory will eventually approach the nominal limit cycle as shown in Fig. 3. Thus, the phase difference corresponds to the isochron shift due to the perturbation. Since the computation of isochrons is computationally prohibitive, the phase shift is instead measured on the limit cycle (see Fig. 3) giving the formulation (17)
 |
(7) |
where Qj is the IC phase sensitivity with respect to xj(0) and xi is an arbitrary ith state of the system. The first term on the right-hand side describes the change in the reference state xi at time t′ caused by a change in xj(0). The corresponding phase shift depends on how fast the system is moving at time t′, which is captured by the second term. The limit in Eq. 7 highlights the fact that the trajectory can only asymptotically approach the limit cycle. Numerically, the limit should not pose a problem for many systems as the phase sensitivities can be computed to sufficient accuracy after a few cycles around the orbit.
FIGURE 3.
(A) Phase sensitivity with respect to initial conditions in a two-state system. In this case, the initial condition change induces a positive phase difference (phase lag). (B) Phase sensitivity with respect to the model parameters. The phase difference due to a parameter perturbation is t2−t1. The dotted lines correspond to trajectories with nominal parameters, which imply that the phase difference is measured on the nominal limit cycle.
A more efficient method to compute Qj uses the Green's function matrix
 |
(8) |
which requires the computation of only one row of the adjoint Green's function matrix Γ. Note that Eq. 8 gives not only the phase sensitivity coefficients with respect to perturbations of the initial condition but also to the states at any given time t.
Remark. The phase sensitivity to IC gives the combination of local state perturbations such that the combined phase difference is zero:
 |
(9) |
The above formulation gives an alternate procedure to compute the isochrons for a two-state system (n = 2). Here, the isochrons are lines traversing the limit cycle, whose local slopes are given by the ratio of the phase sensitivities Qj.
Parametric phase sensitivity
The phase analysis of parametric variations poses a higher degree of difficulty as perturbations in the parameters will give different limit cycles from the nominal parameters, and the comparison of phase between two different limit cycles is problematic. As noted in the previous section, the phase difference at time t between the perturbed and nominal trajectories can be defined as the time difference of each trajectory to reach the isochron η(t). Application of the same concept on the parameter perturbations allows the formulation of parametric phase sensitivity (17)
 |
(10) |
The subscript η signifies that the parametric phase sensitivity is measured in reference to a given isochron, η(t). Equation 10 suggests that the parametric phase sensitivity reflects the cumulative phase shifts from the difference between the perturbed and nominal states. Note that the phase difference is measured here on the same nominal limit cycle, which is illustrated in Fig. 3.
Period sensitivity
When a parameter perturbation causes a period change, the parametric phase sensitivity diverges as the phase difference accumulates for every cycle around the orbit (29). The rate of accumulation around each cycle is exactly equal to the period change, which provides a method to quantify the period sensitivities from Eq. 10 (17),
 |
(11) |
where t is sufficiently large to exclude transient behavior. The removal of the period change effects from the phase sensitivities provides the local variations of phase,
 |
(12) |
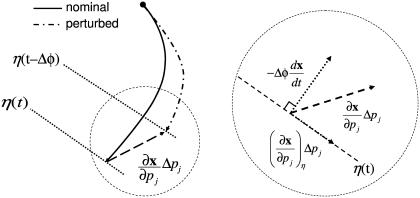
The parametric phase sensitivity reflects only one part (path-dependent) of the state sensitivities. The remainder corresponds to variations in the trajectory that lie on the isochron η(t) as these variations do not produce a phase shift (path-independent). Fig. 4 illustrates an alternate derivation to Kramer et al. (17) for the decomposition of state sensitivities into the path-dependent and path-independent parts:
 |
(13) |
A similar decomposition also exists that separates the state sensitivities into the shape and periodic contributions (30),
 |
(14) |
FIGURE 4.
A geometrical decomposition of state sensitivity into path-dependent and -independent parts. A perturbation in a parameter can change the state trajectory, whose magnitude and direction are given by the state sensitivity as shown in the left figure (dashed arrow). This difference consists of two parts as magnified in the right figure; the first is a path-dependent change causing the phase shift Δφ (dotted arrow perpendicular to the isochron), and the second is a path-independent portion along the isochron. Note that the path-dependent phase change  is equivalent to
Relative phase sensitivity
Aside from the definition used in the previous sections, the term phase can also describe the time separation between two relative reference isochrons in the limit cycle, such as peaks and/or troughs of the states, as illustrated in Fig. 5. A special case of this phase definition is the period, which is the time distance between the same consecutive peak/troughs. Sensitivity analysis of this relative phase  can also fit in the framework of the preceding phase sensitivity. However, the most intuitive method to evaluate the relative phase sensitivity from Eq. 10 in the spirit of Eq. 11, proves to be incorrect (results not shown). The complexity arises because a parameter perturbation can change the limit cycle shape such that the peaks/troughs references move to different isochrons (see Fig. 5). In this case, the parametric sensitivity reflects the difference between how long it takes the perturbed trajectory to travel from the isochrons A′ to B′ and the nominal trajectory from A to B. Consequently, the computation of the relative phase sensitivity needs to correct for the aforementioned shape change effect
 |
(15) |
where
 |
(16) |
and g(t) is some function of time. The last term in Eq. 15 takes into account the isochron shifts due to the shape change in the limit cycle.
FIGURE 5.
Sensitivity analysis of the alternate phase  shown here as the peak-to-peak time separation. The parameter perturbations can produce changes in the shape of the limit cycle which shifts the reference isochrons of
  from A to A′ and from B to B′.
Remark. As noted, the period sensitivity is a special case of the aforementioned relative phase sensitivity. In such as case, the correction terms in Eq. 15 cancel out, which gives Eq. 11.
Finite parameter perturbation
Sensitivity analysis captures the system changes to infinitesimal variations in the parameters (including initial conditions). However, the linear sensitivity coefficients may be inaccurate for larger parameter perturbations due to the nonlinearity of the systems (a limit cycle model is inherently nonlinear). In practice, finite parameter perturbations are used to model different inputs to the limit cycle system, such as light entrainment in circadian rhythm (18) or gene knockouts (31). As mentioned above, such parameter perturbations can change the limit cycle to which the states evolve. Nevertheless, the phase response to finite parameter perturbations can still be evaluated using the same isochron-based approach. Fig. 2 illustrates a hypothetical limit cycle model in which one of the parameter is perturbed.
The following algorithm outlines the computation of phase response to a finite parameter perturbation:
Generate the perturbed limit cycle (i.e., the system with one or more of its parameters perturbed).
Discretize the perturbed limit cycle (usually equally spaced in time).
From each discretized point, simulate a nominal trajectory (the system with the original parameters) to approach the nominal limit cycle. The simulation length is selected to be an integer multiple of the nominal period. This length varies from system to system according to the strength of attraction to the limit cycle (for the circadian rhythm model used here (19), the trajectories approach the nominal limit cycle to a sufficient accuracy in five cycles).
Record the state vector at the final time and associate this information with the initial condition. Each perturbed-nominal state vector pair belongs to the same isochron.
Select one pair of perturbed-nominal states from item 4 as the reference. From the nominal reference, compute the phase (time distance) to the remaining nominal states identified in item 4 in sequence. (Note that the perturbed phases are equally spaced by design in item 2.)
Compute the phase response, Δφ, by subtracting the nominal phases in item 5 from the corresponding perturbed phase.
As in the above sensitivity analysis, the phase response can be normalized to the magnitude of the parameter perturbation, which constitutes a finite difference approximation (27). Also, the period change can be obtained from the phase response after one period around the limit cycle.
Remark 1. The phase response of one orbit around the limit cycle suffices for computing the continuing cycles as the phase shift cumulatively sums. The computational cost of the above algorithm scales linearly with the number of discretization points in item 2.
Remark 2. The premise of the above algorithm is to use the nominal system's isochrons as a metric for phase. The assumption in this approach is that the perturbed limit cycle lies inside the basin of attraction of the nominal system. Although the phase difference of interest here is between the nominal and perturbed limit cycles, the same method also applies for arbitrary limit cycles as long as these limit cycles satisfy the aforementioned assumption. This assumption can be relaxed to only include the discretized points in item 2.
PHASE RESPONSE CURVE
In circadian rhythm, the efficacy of an entraining agent typically depends on the time at which it is administered. This efficacy is summarized in a phase response curve (PRC), which gives the phase shift induced by a pulse of entraining agent at different phases in a circadian clock. The PRC represents the dynamical aspect of the phase response. By definition, an entraining agent needs to modify the phase of the endogenous oscillator. For this reason, modeling environmental cues typically involves perturbations on one or more parameters (18). If the perturbation is sufficiently small and/or the system behaves considerably linear, the parametric phase sensitivity provides an avenue to compute the PRC. In this case, the PRC, ρ(t), represents the accumulated phase shift over the duration of entrainment effect,
 |
(17) |
where Δθ denotes the effective duration of parameter changes caused by the resetting pulse, r is the total number of parameters affected by the entrainment, and Δpj represents the magnitude of parameter change due to entrainment.
The algorithm for computing the phase response to finite perturbations gives an alternative, and more accurate, method to compute the PRC. Here, the perturbed limit cycle corresponds to the system with constant exposure to the entraining cue. The PRC can be computed using a similar formula
 |
(18) |
where  is the phase response to finite parameter perturbations Δp.
CASE STUDIES
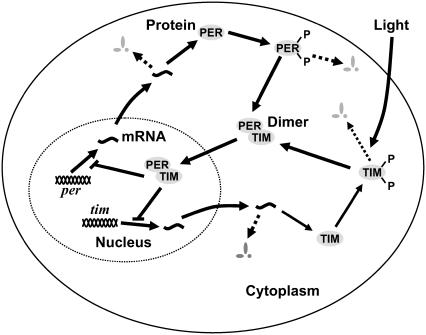
The case studies are based on models of Drosophila (fruit fly) circadian rhythm gene networks: a simple two-state model (20) and a 10-state mechanistic model with light entrainment input (19). The circadian clock in a fruit fly consists of a gene regulation where the key genes' transcriptions: period (Per) and timeless (Tim), are repressed by their own proteins (PER and TIM) (8), as illustrated in Fig. 6. The regulation produces autonomous oscillations of mRNA and protein concentrations because of the effective delay between the transcription of mRNAs and the nuclear translocation of repressor proteins (1). In Drosophila, the core circadian clock exists mainly in lateral neurons in the central brain (8).
FIGURE 6.
An overview of Drosophila circadian rhythm gene regulation. The key genes are Per and Tim, which correspondingly produce the proteins PER and TIM. In the cell, the proteins can become phosphorylated and then degraded, or form the dimer PER-TIM, which in turn inhibits the transcription of per and tim in the nucleus. Light preferentially increases the rate of degradation of TIM protein.
Simple Drosophila circadian rhythm
One of the simplest models of the autonomous circadian rhythm tracks only the mRNA and protein concentrations (20),
 |
(19) |
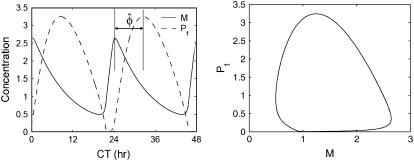
where M and Pt denote the mRNA (per or tim) and the protein (PER or TIM) concentrations respectively, and [νm, km, νp, kp1, kp2, kp3, Keq, Pcrit, Jp] are the model parameters. For the parameter values given in Tyson et al. (20), the system has an asymptotically stable limit cycle with a period of ∼25 h (see Fig. 7).
FIGURE 7.
A simple Drosophila circadian rhythm model with an oscillatory response and its corresponding limit cycle. The time is reported in circadian time (CT), which scales the endogenous period to 24 h.
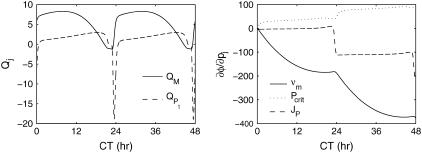
The phase sensitivities in Eqs. 7 and 10 along the limit cycle are presented in Fig. 8. The period sensitivities can be directly calculated from the parametric phase sensitivity curves at t = τ. Comparisons to the SVD method (30) in Table 1 confirm the accuracy of the period sensitivities. In fact, the present approach gives the most accurate estimates of period sensitivities among the existing techniques (30,32) because the only source of inaccuracy comes from simulation error (other methods involve additional numerical approximations). Using the relative phase definition as the (smaller) time separation between the peaks of M and Pt ( h), Table 2 lists the relative period sensitivities Eq. 15 that are in general agreement with the crude estimates from a finite difference approach (27).
FIGURE 8.
Phase sensitivities of a two-state circadian rhythm model. For clarity, only three of the parametric phase sensitivities were plotted.
TABLE 1.
Period sensitivities of two-state circadian model
| p | This work | SVD* |
|---|---|---|
| νm | 2.5297 | 2.5064 |
| km | −187.87 | −188.18 |
| νp | 5.0452 | 6.7089 |
| kp1 | −0.0399 | −0.0921 |
| kp2 | −31.775 | −32.752 |
| kp3 | −90.793 | −93.415 |
| Keq | 0.0028 | 0.0041 |
| Pcrit | 48.088 | 47.363 |
| Jp | −108.22 | −105.36 |
SVD approach as in Zak et al. (30).
TABLE 2.
Relative phase sensitivities
| p | This work | Finite difference |
|---|---|---|
| νm | 0.8543 | 0.4923 |
| km | −63.457 | −56.512 |
| νp | 1.7014 | 0.9846 |
| kp1 | −0.0135 | 0.0223 |
| kp2 | −10.724 | −7.6604 |
| kp3 | −30.635 | −35.982 |
| Keq | 0.0010 | −0.0001 |
| Pcrit | 16.241 | 3.6333 |
| Jp | −36.517 | −17.517 |
10-state Drosophila circadian rhythm
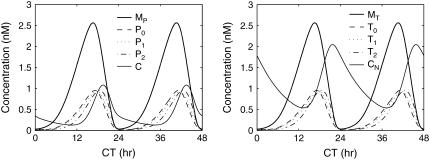
Light entrainment necessitates modeling the transcriptional regulation of both key proteins PER and TIM, since light selectively promotes the degradation of TIM (33,34). The second model consists of two negative feedback loops as shown in Fig. 6, and involves 10 states (two mRNAs, two proteins, two phosphorylated forms of each protein, and cytoplasmic and nucleic dimers) with 38 model parameters (not shown here for brevity) (19). Photic entrainment increases the rate constant of TIM degradation, where a 10-min light pulse is assumed to double the rate constant for a duration of 3 h (18). The autonomous oscillatory response of the model in absence of light is shown in Fig. 9.
FIGURE 9.
Oscillatory behavior of a mechanistic model of Drosophila circadian rhythm. The model includes both the per and tim mRNAs (MP and MT, respectively), the proteins and their phosphorylated forms (P0, P1, P2 for PER and T0, T1, T2 for TIM), and the PER-TIM dimer complexes (cytoplasmic C and nucleic CN).
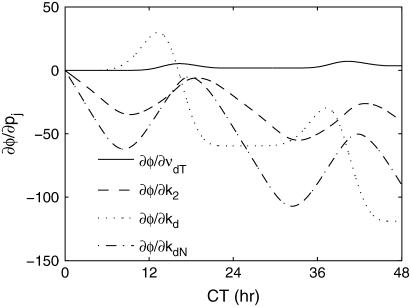
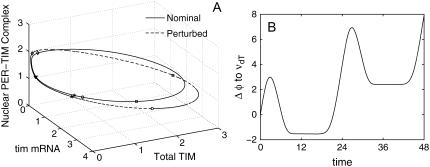
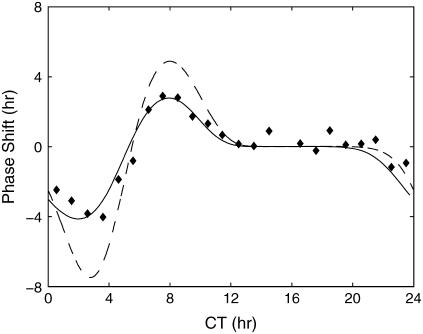
The inclusion of light input in the model allows the construction of PRCs from the phase analyses. The parametric phase sensitivities with respect to infinitesimal and finite perturbations are shown in Figs. 10 and 11, respectively. The light-induced TIM degradation can cause both phase advance and delay depending on the timing of the light input, as indicated by the positive (delay) and negative (advance) sloping curves in the phase sensitivity analyses (most apparent in Fig. 11). As expected, the PRCs for a 10-min light pulse (assuming Δθ = 3 h and 100% perturbation in the rate constant (18)) exhibit both phase advance and delay, as shown in Fig 12. As light induces a strong effect on the TIM degradation, local sensitivity analysis in Fig. 10 may give inaccurate prediction of the phase shifts due to the nonlinearity of the system, which explains the superior accuracy of phase analysis using a finite perturbation in predicting the PRC.
FIGURE 10.
Parametric phase sensitivities of the 10-state mechanistic Drosophila circadian rhythm model. The parameters νdT, k2, kd, and kdN refer to the TIM degradation rate constant, the nuclear transport constant of the dimer PER-TIM, the degradation rate constant of proteins, and the degradation rate constant of nuclear dimer, respectively.
FIGURE 11.
(A) Nominal and perturbed limit cycles of 10-state Drosophila model with representative pairs of points on the same isochrons. Each pair of perturbed-nominal states is marked by the same symbol. (B) Phase response to a finite perturbation in the TIM protein degradation rate constant (νdT). The parameter is increased by 100% of the nominal value.
FIGURE 12.
Experimental and numerical PRCs of Drosophila circadian rhythm. The experimental data were adapted from Hall and Rosbash (46). The predicted PRCs come from the phase response analysis of finite (solid line) and infinitesimal perturbations (dashed line). In a PRC, a positive value of phase shift indicates a phase advance and vice versa, a negative value for a phase delay.
DISCUSSION
The aforementioned phase analyses allow the study of different key attributes of an oscillatory biological system, including the period sensitivity and the PRC, from a single curve: the parametric phase sensitivity ∂φ/∂pj in the first analysis and the phase response Δφ in the second. Here, isochrons provided a key concept to measure phase in a limit cycle. The present analyses however, do not require an explicit computation of the isochrons, which avoids the high computational cost. The first analysis builds on previous work (17), which is rederived above in the framework of isochrons and extended to other notions of phase response behavior. The algorithm in the second analysis derives from the concept of isochrons, but does not entail the typical coordinate transformation of the system to phase variables required in other isochron-based approaches (22,24). The analysis of such a transformed system gives little insight, since the parameters in the model no longer have physical interpretations. In contrast, both analyses here can be directly applied to mechanistic models of biological oscillatory systems, where the states represent physical entities (mRNAs and proteins), and the model parameters correspond to the kinetics of underlying processes (such as rates of transcription and translation). Such analysis permits a direct identification of processes in the system that are most responsible for a given behavior.
A recent work on the phase analysis of circadian rhythm presented the concept of impulse response curves (IRCs) (35), which quantify the system output change from an impulse parameter perturbation. The IRCs and the infinitesimal phase sensitivities (17) are equivalent phase analyses, in which the slope of the parametric phase sensitivities with respect to time give the IRCs, i.e.,
 |
(20) |
where  is the IRC of the period to an impulse perturbation in the parameter pi. There are several advantages of the present approach over the IRC. Numerically, the computation of the PRCs or phase shifts in general involves only subtraction operations (see Eq. 17 or Eq. 18), while the same computation requires an integration of the IRCs. As in the phase analysis of infinitesimal perturbation, the IRCs represent a local (linear) analysis, which may give inaccurate predictions of the (nonlinear) phase response to large (finite) perturbations. In addition, the use of isochrons permits the comparison of any arbitrary limit cycles in the basin of attraction of the reference limit cycle.
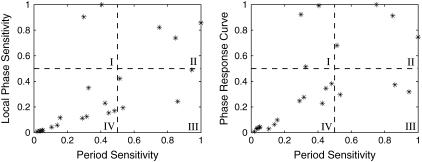
The phase analysis of the mechanistic Drosophila model (19) provides a classification of the circadian parameters, as shown in Fig. 13. Quadrants I and III represent the parameters exerting strong effect on either phase response or period modulation, respectively. On the other hand, quadrants II and IV contain the parameters having comparable effects on both the phase and period; comparably strong in II and comparably weak in IV. The parameters in quadrant I are consistently associated with the transcription of mRNAs (parameters νsP, νsT, KIP, and KIT in (19)). Quadrant III contains the parameters involved in the formation and nuclear transportation of PER-TIM dimers (parameters k1, k2, and k3). Finally, the parameters with comparably strong phase and period effects control the degradation of both mRNAs and proteins, and the protein translation (parameters νmT, νmP, νdP, νdT, ksP, and ksT).
FIGURE 13.
Correlation between the parametric sensitivity of period and phase responses. The axes represent the normalized magnitude with respect to the largest among the parameters, such that the value 1 refers to the parameter with the largest sensitivity magnitude. The local phase sensitivity is from Eq. 12 and the PRC is computed for a pulse of infinitesimal parameter perturbation (i.e., the slope of parametric phase sensitivity). The parameters are grouped based on 50% ratio to the largest sensitivity magnitude.
Fig. 13 suggests that there exist overlapping control mechanisms as well as specialized regulatory points that modulate the period and/or phase responses to perturbations in the system. This classification can be experimentally tested using genetic experiments that change the value of associated parameters. For example, transcription rates can be varied by tuning the promoter strength using directed evolution (36), translation rates can be controlled using ribosomal binding sites of different activities (37), and degradation kinetic of mRNA can be altered through modification of its secondary structure for stability (38). The experiments can confirm or disprove the analysis based on the observed period versus phase changes. As an example, altering the transcription rates should give little change in the endogenous period but large shifts in the phase response, such as the relative timing of the peaks and/or troughs of mRNAs and proteins.
Fig. 13 also provides insights into the photic entrainment in Drosophila circadian rhythm. In chronobiology, there exists two classical models for the mechanism of photic entrainment. One model uses the system phase response to explain entrainment (nonparametric entrainment by Pittendrigh), and another uses the system period modulation (parametric entrainment by Aschoff) (39). Another hypothesis has also been proposed suggesting both period and phase modulation in circadian entrainment (40). This hypothesis was partly supported by the observations called “aftereffects” in which the circadian periods between pre- and post-entrainment differ (41). Such a phenomenon has been observed in many organisms, for example in fruit flies (42), cockroaches (43), Bulla gouldiana (44), and hamster (45). As noted above, light input increases the TIM degradation rate in Drosophila, and thus, exerts comparable phase and period response (parameter νdT in quadrant II). That is, the analysis in Fig. 13 provides support for the role of both period and phase modulation in Drosophila photic entrainment. This result provides the first theoretical confirmation of such behavior at the gene regulation level.
Finally, the relative phase in Eq. 15 is useful in the model identification of oscillatory systems. Parameter values in biological models are typically very difficult to obtain and thus, the magnitudes-of-state predictions often carry limited value. Therefore, data fitting in modeling biological systems needs to rely on relative measures such as the peak-to-peak time separation in the case of an oscillatory system. For example, the peaks of PER and TIM levels in Drosophila circadian rhythm typically lag those of their respective mRNAs by ∼6 h (8). In addition, the experiments in circadian rhythm heavily rely on behavioral measurements, such as activity cycles in the form of actograms (21), that have only phase information. Here, the relative phase sensitivities can direct the parameter estimation to match experimental observations.
CONCLUSIONS
The most important function of a circadian rhythm relies on the system phase response to synchronize its endogenous phase with the entraining cue, such as light. The phase analyses presented in this work offer a method for quantifying the dependence of phase response on the system parameters using isochron-based phase measures. Application of the analyses on a mechanistic model of Drosophila circadian rhythm (19) produced the classification of processes in the circadian gene regulation based on their phase and period response contributions. In particular, the mRNA transcriptions were found to preferentially regulate the phase response of the Drosophila circadian model. In addition, photic entrainment in this system by modulating the TIM degradation was identified to have comparable control over the phase and period responses, in agreement with literature evidences. The resulting classifications can be tested using genetic experiments to alter the kinetic of processes in the circadian gene regulation.
Acknowledgments
This work was supported by the Institute for Collaborative Biotechnologies through grant No. DAAD19-03-D-0004 from the U.S. Army Research Office and by the Defense Advanced Research Projects Agency BioCOMP program.
References
- 1.Wager-Smith, K., and S. A. Kay. 2000. Circadian rhythm genetics: from flies to mice to humans. Nat. Genet. 26:23–27. [DOI] [PubMed] [Google Scholar]
- 2.Dunlap, J. C. 2004. Molecular biology of circadian pacemaker systems. In Chronobiology: Biological Timekeeping. J. C. Dunlap, J. J. Loros, and P. J. DeCoursey, editors. Sinauer Associates, Sunderland, MA.
- 3.Moore, R. Y. 1997. Circadian rhythms: basic neurobiology and clinical applications. Annu. Rev. Med. 48:253–266. [DOI] [PubMed] [Google Scholar]
- 4.Csete, M., and J. Doyle. 2004. Bow ties, metabolism and disease. Trends Biotechnol. 22:446–450. [DOI] [PubMed] [Google Scholar]
- 5.Kitano, H. 2004. Biological robustness. Nat. Rev. Genet. 5:826–837. [DOI] [PubMed] [Google Scholar]
- 6.Stelling, J., U. Sauer, Z. Szallasi, F. J. Doyle III, and J. Doyle. 2004. Robustness of cellular functions. Cell. 118:675–685. [DOI] [PubMed] [Google Scholar]
- 7.Stelling, J., E. D. Gilles, and F. J. Doyle III. 2004. Robustness properties of circadian clock architectures. Proc. Natl. Acad. Sci. USA. 101:13210–13215. [DOI] [PMC free article] [PubMed] [Google Scholar]
- 8.Williams, J. A., and A. Sehgal. 2001. Molecular components of the circadian system in Drosophila. Brain Res. Rev. 63:729–755. [DOI] [PubMed] [Google Scholar]
- 9.Forger, D. B., and C. S. Peskin. 2005. Stochastic simulation of the mammalian circadian clock. Proc. Natl. Acad. Sci. USA. 102:321–324. [DOI] [PMC free article] [PubMed] [Google Scholar]
- 10.Gonze, D., J. Halloy, J.-C. Leloup, and A. Goldbeter. 2003. Stochastic models for circadian rhythms: effect of molecular noise on periodic and chaotic behavior. CR Biologies. 326:189–203. [DOI] [PubMed] [Google Scholar]
- 11.Johnson, C. H., J. A. Elliott, and R. Foster. 2003. Entrainment of circadian programs. Chronobiol. Int. 20:741–774. [DOI] [PubMed] [Google Scholar]
- 12.Roenneberg, T., S. Daan, and M. Merrow. 2003. The art of entrainment. J. Biol. Rhythms. 18:183–194. [DOI] [PubMed] [Google Scholar]
- 13.Cermakian, N., and D. B. Boivin. 2003. A molecular perspective of human circadian rhythm disorders. Brain Res. Rev. 42:204–220. [DOI] [PubMed] [Google Scholar]
- 14.Johnson, C. H. 1999. Forty years of PRCs—what have we learned? Chronobiol. Int. 16:711–743. [DOI] [PubMed] [Google Scholar]
- 15.Ingalls, B. 2004. Autonomously oscillating biochemical systems: parametric sensitivity of extrema and period. IEE Sys. Biol. 1:62–70. [DOI] [PubMed] [Google Scholar]
- 16.Leloup, J.-C., and A. Goldbeter. 2004. Modeling the mammalian circadian clock: sensitive analysis and multiplicity of oscillatory mechanisms. J. Theor. Biol. 230:541–562. [DOI] [PubMed] [Google Scholar]
- 17.Kramer, M. A., H. Rabitz, and J. M. Calo. 1984. Sensitivity analysis of oscillatory systems. Appl. Math. Model. 8:328–340. [Google Scholar]
- 18.Leloup, J. C., D. Gonze, and A. Goldbeter. 1999. Limit cycle models for circadian rhythms based on transcriptional regulation in Drosophila and Neurospora. J. Biol. Rhythms. 14:433–448. [DOI] [PubMed] [Google Scholar]
- 19.Leloup, J.-C., and A. Goldbeter. 1998. A model for circadian rhythms in Drosophila incorporating the formation of a complex between the PER and TIM proteins. J. Biol. Rhythms. 13:70–87. [DOI] [PubMed] [Google Scholar]
- 20.Tyson, J. J., C. I. Hong, C. D. Thron, and B. Novak. 1999. Simple model of circadian rhythms based on dimerization and proteolysis of PER and TIM. Biophys. J. 77:2411–2417. [DOI] [PMC free article] [PubMed] [Google Scholar]
- 21.Dunlap, J. C., J. J. Loros, and P. J. DeCoursey (editors). 2004. Chronobiology: Biological Timekeeping. Sinauer Associates, Sunderland, MA.
- 22.Winfree, A. T. 2001. The Geometry of Biological Time. Springer-Verlag, New York, NY.
- 23.Brown, E., J. Moehlis, and P. Holmes. 2004. On the phase reduction and response dynamics of neural oscillator populations. Neural Comput. 16:673–715. [DOI] [PubMed] [Google Scholar]
- 24.Ermentrout, G. B., and N. Kopell. 1984. Frequency plateaus in a chain of weakly coupled oscillators. I. SIAM J. Math. Anal. 15:215–237. [Google Scholar]
- 25.Ermentrout, G. B., and N. Kopell. 1991. Multiple pulse interactions and averaging in systems of coupled neural oscillators. J. Math. Biol. 29:195–217. [Google Scholar]
- 26.Reference deleted in proof.
- 27.Varma, A., M. Morbidelli, and H. Wu. 1999. Parametric Sensitivity in Chemical Systems. Oxford University Press, New York, NY.
- 28.Gunawan, R., Y. Cao, L. Petzold, and F. J. Doyle III. 2005. Sensitivity analysis of discrete stochastic systems. Biophys. J. 88:2530–2540. [DOI] [PMC free article] [PubMed] [Google Scholar]
- 29.Tomović, R., and M. Vukobratović. 1972. General Sensitivity Theory. Elsevier, New York, NY.
- 30.Zak, D. E., J. Stelling, and F. J. Doyle III. 2005. Sensitivity analysis of oscillatory (bio)chemical systems. Comput. Chem. Eng. 29:663–673. [Google Scholar]
- 31.Forger, D. B., and C. S. Peskin. 2003. A detailed predictive model of the mammalian circadian clock. Proc. Natl. Acad. Sci. USA. 100:14806–14811. [DOI] [PMC free article] [PubMed] [Google Scholar]
- 32.Larter, R., H. Rabitz, and M. Kramer. 1984. Sensitivity analysis of limit cycles with application to the Brusselator. J. Chem. Phys. 80:4120–4128. [Google Scholar]
- 33.Myers, M. P., K. Wager-Smith, A. Rothenfluh-Hilfiker, and M. W. Young. 1996. Light-induced degradation of TIMELESS and entrainment of the Drosophila circadian clock. Science. 271:1736–1740. [DOI] [PubMed] [Google Scholar]
- 34.Zeng, H., Z. Qian, M. P. Myers, and M. Rosbash. 1996. A light-entrainment mechanism for the Drosophila circadian clock. Nature. 380:129–135. [DOI] [PubMed] [Google Scholar]
- 35.Rand, D. A., B. V. Shulgin, D. Salazar, and A. J. Millar. 2004. Design principles underlying circadian clocks. J. Roy. Soc. Interface. 1:119–130. [DOI] [PMC free article] [PubMed] [Google Scholar]
- 36.Alper, H., C. Fischer, E. Nevoigt, and G. Stephanopoulos. 2005. Tuning genetic control through promoter engineering. Proc. Natl. Acad. Sci. USA. 102:12678–12683. [DOI] [PMC free article] [PubMed] [Google Scholar]
- 37.de Smit, M. H., and J. van Duin. 1990. Secondary structure of the ribosome binding site determines translational efficiency: a quantitative analysis. Proc. Natl. Acad. Sci. USA. 87:7668–7672. [DOI] [PMC free article] [PubMed] [Google Scholar]
- 38.Smolke, C. D., T. A. Carrier, and J. D. Keasling. 2000. Coordinated, differential expression of two genes through directed mRNA cleavage and stabilization by secondary structures. Appl. Environ. Microbiol. 66:5399–5405. [DOI] [PMC free article] [PubMed] [Google Scholar]
- 39.Daan, S. 2000. The Colin S. Pittendrigh Lecture. Colin Pittendrigh, Jürgen Aschoff, and the natural entrainment of circadian systems. J. Biol. Rhythms. 15:195–207. [DOI] [PubMed] [Google Scholar]
- 40.Beersma, D. G., S. Daan, and R. A. Hut. 1999. Accuracy of circadian entrainment under fluctuating light conditions: contributions of phase and period responses. J. Biol. Rhythms. 14:320–329. [DOI] [PubMed] [Google Scholar]
- 41.Pittendrigh, C. S. 1960. Circadian rhythms and the circadian organization of living systems. Cold Spring Harb. Symp. Quant. Biol. 25:159–184. [DOI] [PubMed] [Google Scholar]
- 42.Kumar, S., and V. K. Sharma. 2004. Entrainment properties of the locomotor activity rhythm of Drosophila melanogaster under different photoperiodic regimens. Biol. Rhythm Res. 35:377–388. [Google Scholar]
- 43.Page, T. L., C. Mans, and G. Griffeth. 2001. History dependence of circadian pacemaker period in the cockroach. J. Insect Physiol. 47:1085–1093. [DOI] [PubMed] [Google Scholar]
- 44.Page, T. L., G. T. Wassmer, J. Fletcher, and G. D. Block. 1997. Aftereffects of entrainment on the period of the pacemaker in the eye of the mollusk Bulla gouldiana. J. Biol. Rhythms. 12:218–225. [DOI] [PubMed] [Google Scholar]
- 45.Chiesa, J. J., M. Anglès-Pujolràs, A. Díez-Noguera, and T. Cambras. 2006. History-dependent changes in entrainment of the activity rhythm in the Syrian hamster (Mesocricetus auratus). J. Biol. Rhythms. 21:45–57. [DOI] [PubMed] [Google Scholar]
- 46.Hall, J. C., and M. Rosbash. 1987. Genes and biological rhythms. Trends Genet. 3:185–191. [Google Scholar]


