Abstract
Pancreatic islets of Langerhans display complex intracellular calcium changes in response to glucose that include fast (seconds), slow (∼5 min), and mixed fast/slow oscillations; the slow and mixed oscillations are likely responsible for the pulses of plasma insulin observed in vivo. To better understand the mechanisms underlying these diverse patterns, we systematically analyzed the effects of glucose on period, amplitude, and plateau fraction (the fraction of time spent in the active phase) of the various regimes of calcium oscillations. We found that in both fast and slow islets, increasing glucose had limited effects on amplitude and period, but increased plateau fraction. In some islets, however, glucose caused a major shift in the amplitude and period of oscillations, which we attribute to a conversion between ionic and glycolytic modes (i.e., regime change). Raising glucose increased the plateau fraction equally in fast, slow, and regime-changing islets. A mathematical model of the pancreatic islet consisting of an ionic subsystem interacting with a slower metabolic oscillatory subsystem can account for these complex islet calcium oscillations by modifying the relative contributions of oscillatory metabolism and oscillatory ionic mechanisms to electrical activity, with coupling occurring via KATP channels.
INTRODUCTION
Glucose plays a prominent role in regulating insulin secretion from pancreatic islet β-cells. At low glucose concentrations (<3 mM), islets are electrically silent, and secrete insulin at low, basal levels. In response to glucose stimulation (>5–7 mM), glucose metabolism and mitochondrial energy production increase (1–3). The resulting increase in the ATP/ADP ratio closes KATP channels and depolarizes the β-cell to initiate electrical activity, calcium influx, and insulin secretion (4). The ensuing glucose-stimulated activity is oscillatory, and is believed to be important for physiological insulin release (5–7).
Oscillatory activity in pancreatic islets was first described as electrical bursts of repeated action potential firing at a period of ∼30 s in response to elevated glucose (8). Subsequent studies determined that these rhythms result primarily from the coordinated activity of calcium and potassium ion currents (9–13) and that burst frequency and duration are glucose-dependent (10,14,15). Insulin secretion resulting from these fast oscillations correlates well with the burst plateau fraction, the ratio of time spent in the active phase to the total burst period (10,16–18). The time spent in the active phase progressively increases with glucose concentration, while the time spent in the silent phase is reduced. The increase in plateau fraction likely is linked to secretion because it results in an increase in the mean intracellular calcium ([Ca2+]i) (19,20).
Although the above physiological studies have established that mouse pancreatic β-cells and islets are rhythmic with a period of tens of seconds, the established period of pulsatile insulin secretion measured in vivo ranges from 3 to 10 min in many species (21–26). More than a decade after bursting was first identified in islets, it was reported that islets can also display oscillatory activity with a period of ∼5 min (27,28), which is more consistent with the period of in vivo insulin secretion. Subsequent reports have established that for islets these slow oscillations occur in electrical activity (19,20), [Ca2+]i (20,29), and insulin secretion (25), as well as in a variety of metabolic quantities including O2 consumption (30,31), glucose consumption (32), and mitochondrial membrane potential (33–36). Slow islet oscillations have also been closely correlated temporally with oscillations in insulin secretion in vitro (18,29,37) and in vivo (38,39), suggesting that islet oscillations are indeed important for physiological insulin secretion.
The fast and slow rhythms in islet electrical activity can interact to produce a wide variety of oscillatory patterns in [Ca2+]i (20,32,40,41). In this study, we systematically analyzed the effects of different glucose concentrations on the period, amplitude, and plateau fraction of [Ca2+]i oscillations of fast (period < 200 s) and slow/mixed (period > 200 s) islets. The rationale for the study was twofold. First, although it is known that glucose modulates fast oscillations in islets by increasing plateau fraction over a range of concentrations, much less is known about how glucose modulates slow islet oscillations, in part because this has not been systematically or extensively studied in whole islets. In contrast, numerous studies have shown that isolated β-cells are not sensitive to modulation by glucose once they are triggered to oscillate (42,43). By extension, it has been suggested that islets exhibiting slow oscillations behave similarly (44). Secondly, building on prior suggestions that glycolytic oscillations drive calcium oscillations in β-cells (45), we recently proposed that fast and slow islet oscillations may reflect the quantitative interaction of a fast ionic oscillatory process with slow, glycolytic oscillations (46). As a test of the model, we compared the model's predictions with experimental data describing glucose modulation of islets exhibiting fast, slow, or mixed oscillations. We present the predictions of the combined model in the Discussion in the form of a concise diagram, which can account for the great variety of islet behaviors we see in terms of the degree of overlap between oscillatory ionic or metabolic processes.
Our findings are thus in accord with our central hypothesis that there are two separate oscillatory mechanisms in islets; one that produces fast bursting and one that produces slow bursting. Our data also demonstrate that it is possible to induce a transition from bursting driven by one mechanism to bursting driven by the other, by changing the glucose concentration. We postulate that the fast bursting is driven by calcium feedback on K+ channels, whereas the slow bursting is driven by oscillations in glycolysis, and demonstrate that a mathematical model combining glycolytic oscillations and calcium feedback can account for the effects of glucose on period, amplitude, and plateau fraction in fast and slow islets and for regime change.
MATERIALS AND METHODS
Islet isolation and culturing
Islets were isolated from male Swiss-Webster mice (25–35 g) using protocols that are in accordance with the Animal Care and Use Committee of Virginia Commonwealth University as previously described (20). Briefly, mice were sacrificed by cervical dislocation and their pancreases rapidly removed. Collagenase (Crescent Chemical, Islandia, NY) was then injected at 2 mg/ml into the pancreas via the bile duct or through direct injection, and islets were incubated for 10–20 min to allow them to become free of the exocrine pancreas. Islets were then hand-picked twice under a dissecting microscope and placed in RPMI at 37°C in a 95/5% air/CO2 mixture for ∼24 h before experimentation.
Intracellular calcium measurements
[Ca2+]i was measured using the ratiometric dye Fura-2 as previously described (20). Briefly, islets were loaded with 2 μM Fura-2-AM for 20 min, washed, and incubated an additional 10 min. [Ca2+]i measurements were made by placing mouse islets in a small volume perfusion chamber (Warner Instruments, Hamden, CT) mounted on the stage of an Olympus IX50 inverted fluorescence microscope equipped with Fura-2 optics (Olympus, Tokyo, Japan). Excitation light was supplied to the preparation via a light pipe transmitting light from a xenon burner. A galvanometer-driven mirror and dichroic cube were used to produce excitation at 340 and 380 nm (“HyperSwitch,” IonOptix, Milton, MA). Ratios were collected at 510 nm using a photomultiplier (Electron Tubes, Middlesex, UK) and were analyzed using IonWizard software (IonOptix).
For each [Ca2+]i recording, islets were Fura-loaded in saline solution containing the same glucose concentration as the first part of the recording. Each islet was then exposed to one or two additional glucose concentrations. Typically, each step was made to a higher glucose concentration, although some islets were exposed to a higher concentration and then taken back to the starting concentration to show reversibility (Fig. 6 A). Some islets were exposed to drugs to reduce glycolytic activity (Fig. 12). Although no islet was exposed to more than three different glucose concentrations, dose-response relationships for period, amplitude, and plateau fraction were generated by using the following glucose concentrations (in mM) for different islets: 2.8, 4, 6, 8, 9, 11.1, 13, 15, 20, and 25. Note that not all glucose concentrations are presented in the Results because activity was not present at low glucose and islet activity reached a plateau at high glucose concentrations.
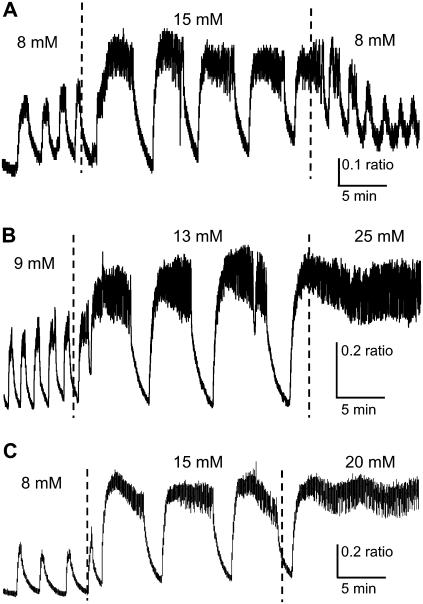
FIGURE 6.
Examples of regime change in islet [Ca2+]i patterns. (A) Fast [Ca2+]i bursts reversibly change to slow oscillations of greater period, amplitude, and plateau fraction as glucose is increased and then decreased. (B) Fast [Ca2+]i bursts progressively change to slow oscillations and eventually a sustained plateau as glucose is increased from 9 to 13 to 25 mM glucose. (C) Slow subthreshold oscillations change progressively to fast bursting, and eventually a sustained plateau as glucose is increased from 8 to 15 to 20 mM glucose. Note that the plateau is oscillatory, suggesting modulated continuous spike activity.
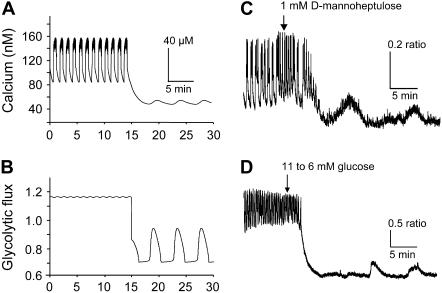
FIGURE 12.
Prediction of subthreshold [Ca2+]i oscillations by reducing glucokinase activity. (A,B) A purely fast [Ca2+]i pattern (A) is predicted by the model at a very high rate of glucokinase activity (JGK = 0.4 s−1) and a moderate rate for the constant component of glycolysis (r = 1.0 s−1). Modestly lowering both rates (JGK = 0.2 s−1, r = 0.7) converts the fast pattern to a slow subthreshold oscillation in which glycolysis begins to oscillate (B) but is able to induce only a small ripple in [Ca2+]i (A). (gKCa = 300, gCa = 1000, gKATP = 25,000, kγ = 10, and vγ = 2.2.) The predicted conversion of [Ca2+]i patterns is demonstrated experimentally by treating islets with a low dose of the glucokinase inhibitor mannoheptulose (C) or by reducing glucose from 11 mM to 6 mM (D).
NAD(P)H autofluorescence measurements
Measurements of the reduced forms of NAD and NADP, referred to as NAD(P)H, were made in islets using the same Olympus IX50 inverted fluorescence microscope equipped with Fura-2 optics as used for the Fura-2/AM measurements. Instead of loading islets with Fura-2/AM, however, islets were placed directly into the recording chamber to record islet NAD(P)H autofluorescence using 340-nm excitation and 510-nm emission. Although the peak excitation and emission wavelengths to measure NAD(P)H are ideally 360 and 450 nm, respectively, our recording settings were nonetheless sufficiently sensitive to detect glucose-induced changes in fluorescence that were consistent with previous reports of NAD(P)H (47–50). Islets in this study were exposed to glucose concentrations of 2.8, 11.1, 20, 25, and/or 50 mM. Because of the small signal/noise ratio involved in autofluorescence measurements, signals were filtered using a box function in IGOR Pro Ver. 5 (Wavemetrics, Lake Oswego, OR).
Mathematical modeling
We used a previously published mathematical model (46) to interpret and account for the experimental data. We have shown previously that this model can account for slow, fast, and mixed bursting patterns by varying a few key parameters. A brief description of the model is provided here, emphasizing the key components and parameters. A more detailed description is given in the Appendix and in Bertram et al. (46). (Computer programs for the model can be downloaded from http://www.math.fsu.edu/∼bertram or http://mrb.niddk.nih.gov/sherman.)
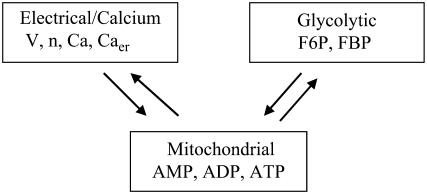
The model has three components: an electrical and calcium component, a glycolytic component, and a simple mitochondrial component (Fig. 1). The glycolytic component can either be oscillatory or stationary, depending on the values of the parameters. The oscillation is due to positive feedback onto phosphofructokinase (PFK) of its product fructose 1,6-bisphosphate (FBP), as occurs in the M-type isoform of PFK (51). The most important parameter is the glucokinase (GK) reaction rate (JGK), which determines the input to PFK. For large or small values of JGK the glycolytic variables do not oscillate. However, for intermediate values of JGK the glycolytic variables exhibit a slow oscillation, with period of ∼5 min. Glycolysis has downstream effects on the mitochondrial ATP production (it is the input to the mitochondria), so that slow glycolytic oscillations cause slow oscillations in the adenine nucleotide concentrations. In addition to the oscillatory glycolytic input, we assume that there is input through a nonoscillatory glycolytic pathway. This could be through the C- or L-type isoforms of PFK, which do not produce oscillations due to lack of FBP feedback (51). In our model, the parameter r represents glycolytic flux through the C/L-type PFK isoform. Flux through the M-type isoform is given by
 |
(1) |
where JGPDH is the glyceraldehyde 3-phosphate dehydrogenase (GPDH) rate, which is the output of the (M-type) glycolytic component. Parameters kγ and vγ are adjusted to produce different model behaviors, as is the flux r through the C/L-type PFK isoform. Our model does not distinguish between adenine nucleotide concentrations in the cytosol and those in the mitochondria; it is tacitly assumed that they are equal. ADP and ATP act on KATP-channels in the plasma membrane. ADP activates and ATP inhibits these channels, and the KATP-channel conductance is therefore determined by the combined effects of ADP and ATP. In this way the mitochondrial component affects the electrical component. Indeed, the interaction is mutual, since an elevation in the cytosolic Ca2+ concentration inhibits ATP production, as described by Keizer and Magnus (52).
FIGURE 1.
Illustration of the three model components. Arrows indicate interactions between components.
When glycolysis is nonoscillatory the combined model can produce fast bursting. This is driven by direct Ca2+ feedback onto Ca2+-activated K+ channels, also called Kslow channels (53,54), and by indirect Ca2+ feedback onto KATP-channels, through the inhibitory effect of Ca2+ on ATP production (55). When glycolysis is in an oscillatory state, the combined model can produce slow bursting (period of several minutes) or “compound bursting,” consisting of episodes of fast bursts separated by long silent phases. Our main modeling goal in this study was to investigate whether we could account for the full range of effects of glucose concentration on islet calcium oscillations by independently varying the intensity of the oscillatory and constant components of glycolytic drive to the mitochondria, JGK and r. Adjustments were made in other parameters, specifically the Ca2+, K(Ca), and KATP-channel conductances, gCa, gK(Ca), and gK(ATP), and νγ and kγ to account for the heterogeneity of amplitude and frequency of the oscillations observed in the experiments, but these parameters were not allowed to vary with the glucose concentration.
Statistics and analysis
The period, amplitude, and plateau fraction of calcium oscillations were calculated with an in-house macro written for use in Igor Pro software. For presentation and statistical analysis, islet responses were divided into three categories: fast, slow, and regime change. Fast islets were separated from slow islets based on a cutoff period of below (fast) or above (slow) 200 s. Compound patterns were combined with slow for analysis as in previous studies (39). Islets included in the regime change category showed a >200% change in period at different glucose concentrations (mean change 437 ± 84%), whereas islets in the fast and slow groups showed changes <200% (mean 148 ± 8% for fast and 132 ± 8% for slow). To assess the effects of glucose on the period, amplitude, and plateau fraction for fast, slow, and regime change categories, glucose concentrations were combined into groups 6–9 mM, 11.1 mM, and 13–15 mM glucose, and differences were assessed by two-tailed t-test. For experiments involving mannoheptulose, a paired t-test was used to assess effects. For NAD(P)H measurements, oscillations were identified by visual inspection, and a χ-square test was used to assess differences in the percent of islets displaying oscillations at different glucose concentrations. A p-value <0.05 was considered significant for all statistical tests.
RESULTS
Glucose-stimulated changes in fast [Ca2+]i oscillations
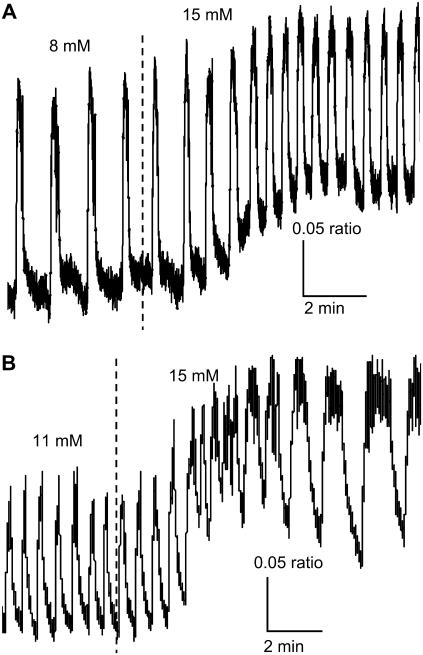
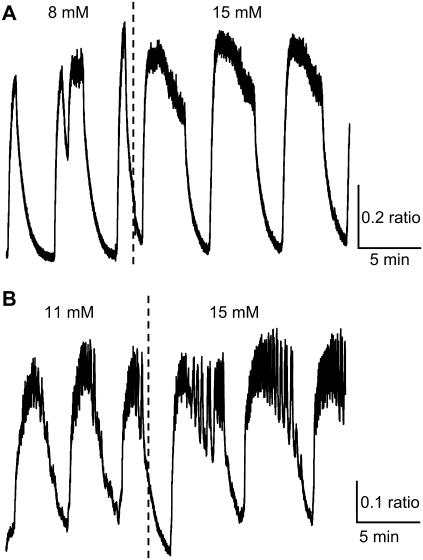
Fast oscillations (bursting) result from the interactions of ion channels that are activated at sufficiently stimulatory glucose concentrations. In Fig. 2, we demonstrate two representative examples of fast [Ca2+]i bursts. In Fig. 2 A, the islet was initially exposed to 8 mM glucose, and subsequently the glucose concentration was increased to 15 mM. The burst period increased when glucose concentration was increased. In Fig. 2 B, in contrast, the burst period decreased when glucose was raised from 11 to 15 mM. In both cases, the nadir-to-peak amplitude was unaffected by the increase in glucose concentration, the baseline [Ca2+]i increased and there was an increase in the plateau fraction, although for different reasons. In Fig. 2 A the time spent in the silent phase decreased so that the plateau fraction increased from 22 to 32%, whereas in Fig. 2 B the time spent in the active phase increased, again resulting in an increased plateau fraction from 34 to 56%.
FIGURE 2.
Two examples of the response to glucose of fast islet [Ca2+]i oscillations. (A) [Ca2+]i bursts decrease in period and increase in plateau fraction as glucose is raised from 8 to 15 mM glucose due to a reduction in the time spent in the silent phase of each burst. (B) [Ca2+]i bursts increase in period and plateau fraction as glucose is increased from 11 to 15 mM glucose due to an increase in the time spent in the active phase.
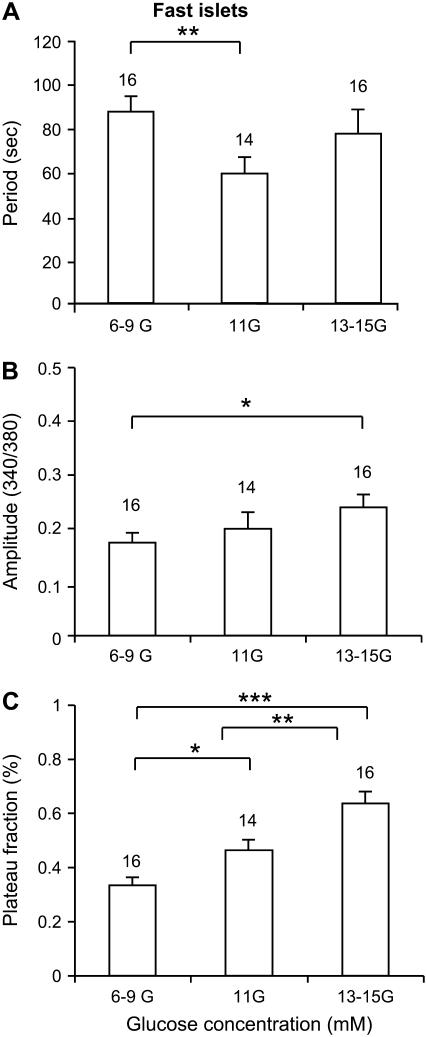
The effects of increasing the glucose concentration on fast islets are summarized in Fig. 3. The oscillation period first declines and then rises with increased glucose forming a U-shaped curve (Fig. 3 A). There is only a small increase in the oscillation amplitude (Fig. 3 B). For fast islets, this U-shaped response of burst period versus glucose concentration has been well documented (10,56,57). The plateau fraction increases gradually as the glucose concentration is increased (Fig. 3 C), again consistent with those prior studies.
FIGURE 3.
Summary of the effects of glucose on fast bursting islets in terms of period (A), amplitude (B), and plateau fraction (C). *Indicates p < 0.05, **p < 0.01, ***p < 0.001.
Glucose-stimulated changes in slow [Ca2+]i oscillations
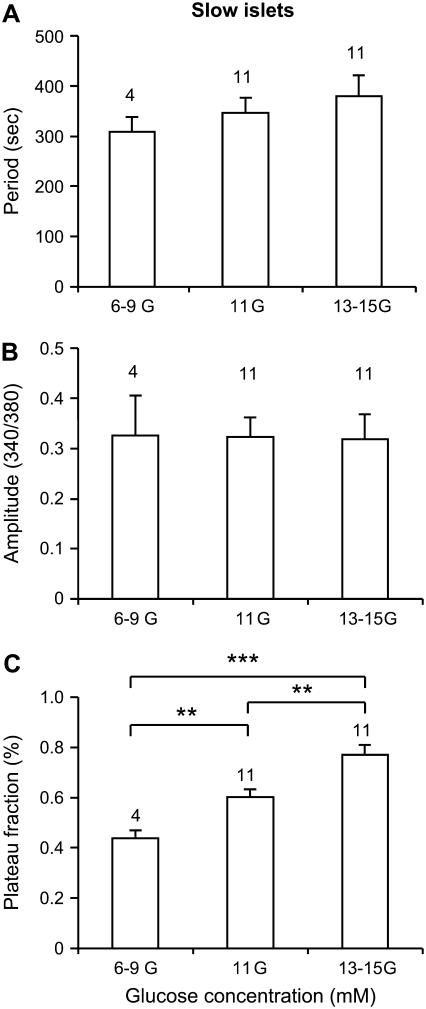
We next examined the effects of glucose on slow [Ca2+]i oscillations. While slow oscillations in [Ca2+]i have been reported frequently in the literature, a systematic comparison of the glucose-sensitivity of slow and fast patterns in the same islet preparation, to our knowledge, has not been previously reported. As shown in the two examples in Fig. 4, the most striking feature of the response of slow [Ca2+]i oscillations to increased glucose is an increase in the duration of the active phase, here the portion of elevated [Ca2+]i, whether steady or with superimposed fast oscillations. In Fig. 4 A, the plateau fraction increased from 40 to 61%, whereas the mean period only increased by 14 s from 332 to 346 s. In Fig. 4 B, the switch from 11 to 15 mM glucose resulted in an increase in plateau fraction from 52 to 73%, and an increase in period from 196 to 263 s. The amplitude of [Ca2+]i oscillations was not affected in either example, which is representative of the overall data summarized in Fig. 5. No significant change in the period (Fig. 5 A) or amplitude (Fig. 5 B) was detected for different concentrations of glucose. There was a significant increase, however, in the plateau fraction with increased glucose concentration (Fig. 5 C).
FIGURE 4.
Two examples of the response to glucose of slow islet [Ca2+]i oscillations. (A,B) [Ca2+]i oscillations increase in plateau fraction as glucose is increased due to the greater time spent in the active phase and a reduction in time spent in the silent phase. In each case, the period of oscillations was only slightly increased. In panel B, fast bursts are superimposed on the slow oscillations (compound oscillations).
FIGURE 5.
Summary of the effects of glucose on slow islet oscillations in terms of period (A), amplitude (B), and plateau fraction (C). *Indicates p < 0.05, **p < 0.01, ***p < 0.001.
Regime change in islet [Ca2+]i oscillations
In the previous figures, islets that were fast in low glucose remained fast in higher glucose (Figs. 2 and 3), and islets that were slow in low glucose remained slow in higher glucose (Figs. 4 and 5). Fig. 6 shows another type of islet response, in which fast islets became slow islets when the glucose concentration was increased. As shown in Fig. 6 A, when the glucose concentration was stepped from 8 to 15 mM, large changes in the period (125–347 s), amplitude (0.17–0.33 Fura-2 ratio 340/380 nm), and plateau fraction (49–73%) occurred in the islet [Ca2+]i oscillations. When returned to 8 mM glucose, the [Ca2+]i oscillations again become faster and smaller in amplitude (Fig. 6 A), demonstrating that this effect is reversible. A similar effect was observed when another islet was stepped from 9 to 13 mM glucose (Fig. 6 B), with large increases observed in period (93–473 s), amplitude (0.22–0.44 ratio), and plateau fraction (43–69%). An additional step to 25 mM glucose resulted in a sustained active phase with superimposed fast bursts that continued for at least 25 min until the recording was stopped (Fig. 6 B). The example in Fig. 6 C is similar to that in Fig. 6 B, except that at the 20 mM glucose step a slow underlying oscillation is evident, with a period (∼330 s) that is similar to the period (∼370 s) of slow bursting in 15 mM glucose.
We call the dramatic increase in oscillation period and amplitude “regime change.”
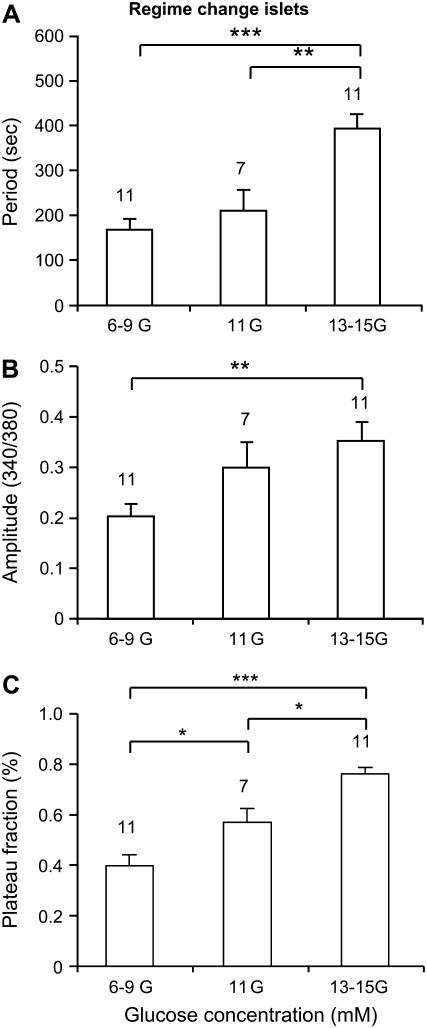
Fig. 7 summarizes data for islets that exhibited a regime change when the glucose concentration was increased. These are characterized by large increases in the oscillation period (Fig. 7 A) and amplitude (Fig. 7 B), and an increase in the plateau fraction (Fig. 7 C). The dramatic increases in oscillation period and amplitude are much greater than those observed in fast or slow islets that did not go through a regime change.
FIGURE 7.
Summary of the effects of glucose on regime-changing islets in terms of period (A), amplitude (B), and plateau fraction (C). *Indicates p < 0.05, **p < 0.01, ***p < 0.001. Note that this figure excludes data from the small fraction of islets that responded to increased glucose with regime change from slow to fast patterns (see example in Fig. 14), since these changes are opposite to the trends represented here. The changes described in this figure remain statistically significant even with the inclusion of these contrary islets.
A comparative summary of islet glucose responses
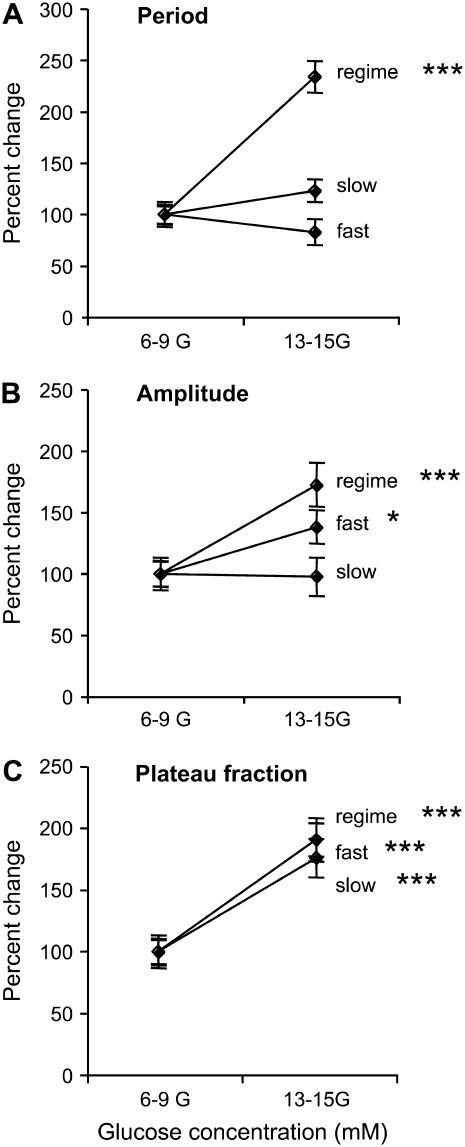
The responses of fast, slow, and regime changing islets to increases in the glucose concentration are compared in Fig. 8. Here we show percent changes in period, amplitude, and plateau fraction when the glucose concentration is increased from the 6–9 mM range to the 13–15 mM range. There is no significant change in period for fast or slow islets when the glucose concentration is increased (Fig. 8 A). The amplitude is also unchanged in slow islets, but exhibits a small, but statistically significant, increase in fast islets (Fig. 8 B). However, islets that go through a regime change show almost a doubling in both of these measures. Interestingly, fast, slow, and regime-changing islets all increased in plateau fraction by approximately a factor of 2 when the glucose concentration was increased (Fig. 8 C).
FIGURE 8.
Summary of the fractional changes in period (A), amplitude (B), and plateau fraction (C) from low to high glucose concentrations. Fast (n = 16), slow (n = 11), and regime change (n = 11) are plotted together to illustrate the differences and similarities.
Modeling results
How can we account for fast and slow oscillations, and the regime change that often occurs between the two? One explanation is that fast and slow oscillations are driven by distinct mechanisms, and that regime change reflects a switch from one burst mechanism to the other. We have previously proposed that fast bursting is driven by Ca2+ feedback onto ion channels, while slow bursting is driven by oscillations in glycolysis (46). We now demonstrate with computer simulations that this model can account for the glucose responses shown in the previous figures.
As described in Materials and Methods, we represent increases in glucose concentration by means of increases in the steady component of glycolysis (represented by parameter r) or the oscillatory component of glycolysis (represented by parameter JGK) or both. Other parameters were varied to fine-tune the period and amplitude of [Ca2+]i measured in the corresponding experiments, which were heterogeneous, but are not changed with the glucose concentration.
Glucose response of fast oscillation
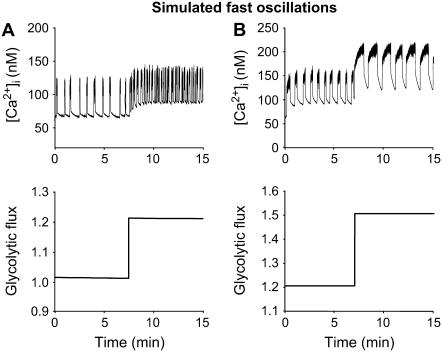
In Fig. 9, the [Ca2+]i patterns presented in Fig. 2 are simulated by the model, along with the predicted underlying shifts in flux from glycolysis to the mitochondria (bottom panels). The glycolytic flux is defined as the sum of the constant and oscillatory inputs from glycolysis, r + γ (Eq. 1, Materials and Methods). Fig. 9 A shows a case like Fig. 2 A, in which the rise in glucose (simulated by increasing r from 1.0 to 1.4) decreases the oscillation period from ∼95 s to ∼64 s due to a shortening of the silent phase. Fig. 9 B shows a case like Fig. 2 B, in which the oscillation period increases from ∼78 s to ∼94 s due to a lengthening of the active phase (simulated by increasing r from 1.2 to 1.5 and JGK from 0.02 s−1 to 0.025 s−1). In Fig. 9, A and B, as in Fig. 2, there is an increase in the baseline [Ca2+]i, due to the increased glycolytic flux. There is also an increase in plateau fraction, but no change in the nadir-to-peak amplitude. In both cases, glycolytic output is nonoscillatory and increases in a steady-state manner with glucose. Thus, the mechanism underlying this fast pattern is purely electrical.
FIGURE 9.
Simulation of the glucose response of fast activity; compare to Fig. 2. Fast bursting is driven by purely electrical mechanisms; the input from glycolysis, r + γ, is constant at any glucose level. (A) Fast [Ca2+]i oscillations become faster while glycolytic flux increases in a steady-state manner. This is achieved by increasing the flux through glucokinase JGK from 0.02 s−1 to 0.03 s−1 and increasing r from 1.0 to 1.4. Shortening of the silent phase leads to a decrease in the period from 95 to 64 s (gKca = 450, gCa = 1000, gKATP = 25,000, kγ = 10, JGK = 0.02, and vγ = 2.2). (B) The period of these fast oscillations is increased from 78 s to 94 s due to lengthening of the active phase, which is achieved by increasing the flux through glucokinase from 0.02 s−1 to 0.025 s−1 and r from 1.2 to 1.5 (gKCa = 300, gCa = 1000, gKATP = 26,000, kγ = 10, JGK = 0.02, and vγ = 2.2).
Glucose response of slow oscillations
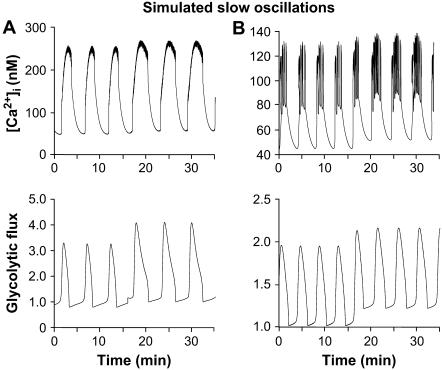
In the model, slow and compound bursting are driven by glycolytic oscillations, as shown by the oscillating glycolytic flux in Fig. 10, A and B. The glycolytic flux oscillation (bottom panels) is in-phase with [Ca2+]i oscillations. Fig. 10 A shows pure slow oscillations, which occur when the electrical oscillation is itself relatively slow and phase locks in a 1:1 manner with the metabolic oscillation. A combined increase in JGK (0.10 s−1–0.15 s−1) and in r (0.7–0.9) led to an increase in the active phase duration of the [Ca2+]i oscillations (top panel). The period increased from 6.3 min to 6.5 min, and the plateau fraction increased from 0.28 to 0.38. Compare with the experimental data in Fig. 4 A. As in the case of fast oscillations, there was no change in the amplitude, but for the slow, the baseline remained unchanged as well.
FIGURE 10.
Simulation of the glucose response of slow activity; compare to Fig. 4. (A) Pure slow [Ca2+]i oscillations (top panel) driven by glycolytic oscillations (bottom panel). Increase in JGK (0.10 s−1–0.15 s−1) and increase in r (0.7–0.9) caused an increase in the active phase duration. The period increased from 6.3 min to 6.5 min; and the plateau fraction increased from 0.28 to 0.38 (gKCa = 25, gCa = 1000, gKATP = 27,000, kγ = 5, and vγ = 10). (B) Compound oscillations. An increase in r (1.0–1.2) caused an increase in the active phase duration, which resulted in an increase in period from 4.1 min to 4.5 min and an increase in the plateau fraction from 0.36 to 0.46. Consistent with what is seen experimentally (Fig. 4), no change in amplitude was seen and only a modest increase in period (gKCa = 900, gCa = 900, gKATP = 26,000, kγ =10, JGK = 0.2, and vγ = 10).
Fig. 10 B shows a compound bursting pattern consisting of an episode of fast bursts followed by a long silent episode with no bursting. Compare with Fig. 4 B. Compound bursting occurs when the ionic oscillations are much faster than the metabolic ones and phase lock in a many:1 manner. An increase in r (1.0–1.2) caused an increase of the active phase duration, which resulted in an increase in period from 4.1 min to 4.5 min. The plateau fraction also consequently increased, from 0.36 to 0.46. Both of these results are consistent with the experimental data in Figs. 4 and 5. As in the pure slow case (Fig. 10 A), there was no significant change in the [Ca2+]i amplitude. The increase in r led to an increase in the baseline in the glycolytic flux, which was reflected in the baseline of the Ca2+ oscillation.
Glucose response leading to regime change
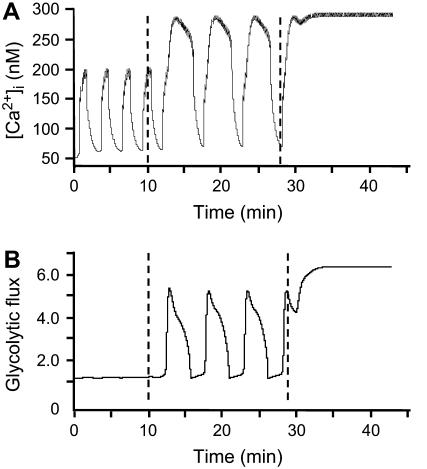
In Fig. 6, small fast [Ca2+]i oscillations observed in low glucose give way to large slow [Ca2+]i oscillations in high glucose. These examples were classified as regime change based on the large increase in period of the [Ca2+]i oscillation, but regime change is always accompanied by a large increase in amplitude. In Fig. 11, we show that both features flow naturally in the model from a switch between pure electrical (Ca2+ feedback) and glycolytic oscillations. Fig. 11 A shows the simulated [Ca2+]i time course (compare with Fig. 6 B) and Fig. 11 B shows the predicted time course of the glycolytic flux. An increase in glucokinase reaction rate (JGK = 0.02 s−1, 0.2 s−1, 0.6 s−1) results in a dramatic increase in the plateau fraction, period, and amplitude of the [Ca2+]i oscillations. At the lowest level of stimulation, fast oscillations are driven by the electrical mechanism only. At the intermediate level, slow oscillations are driven by the combined influence of electrical and glycolytic mechanisms. Finally, at the highest level, glycolytic output is high and constant due to the large amount of fuel feeding into the glycolytic cycle.
FIGURE 11.
Simulation of regime change; compare to Fig. 6. Simulated [Ca2+]i oscillations (A) with corresponding glycolytic flux (B). The input from glycolysis is constant. For the simulations of low (8 mM), intermediate (15 mM), and high (20 mM) glucose, JGK was increased from 0.02 s−1 to 0.2 s−1 to 0.6 s−1. At the lowest JGK level, the mechanism underlying [Ca2+]i oscillations is purely electrical, whereas at the intermediate level, the oscillations are driven by the combined influence of glycolytic and [Ca2+]i-dependent ionic mechanisms. At the highest value, oscillations cease, leaving only fast spiking, because the system is saturated (gKCa = 25, gCa = 1000, gKATP = 27,000, kγ = 10, vγ = 50, and r = 1.0).
Model prediction: reducing glycolysis can also cause regime change
The experimental observations and simulations of regime change in Figs. 6 and 11, respectively, suggest that at low glucose, fast oscillations can occur without accompanying slow metabolic oscillations even in islets that are capable of exhibiting slow oscillations at a higher glucose concentration. Our interpretation is that both mechanisms are present, but the electrical oscillations have a lower threshold than the metabolic oscillations. This suggests that the reverse might be true as well: some islets may have a lower threshold for generating glycolytic oscillations than electrical oscillations. Further, in such a case, increasing glucose may cause the glycolytic oscillations to reach the tonically “on” state, which is achieved in Fig. 6 B at 25 mM at a moderate glucose level, say 11 mM, for which the electrical subsystem can still oscillate. Conversely, the model predicts that some islets displaying fast [Ca2+]i patterns have high glycolytic flux and could be brought into the oscillatory range of glycolysis by reducing the amount of glycolytic flux (Fig. 12, A and B). Partially inhibiting GK would then terminate the fast [Ca2+]i bursts at the same time that it activates slow glycolytically driven oscillations, which could be detected as subthreshold oscillations in [Ca2+]i through their effect on ATP-sensitive K+ channels and the membrane potential.
To test this prediction, we treated islets displaying fast [Ca2+]i oscillations with mannoheptulose, a GK inhibitor. At a dose of 1 mM, mannoheptulose only partially inhibits GK activity (58). As predicted by the model, in some cases this partial inhibition converted fast patterns to slow subthreshold oscillations in experimental tests (Fig. 12 C, n = 5 of 9 islets). Similarly, reducing glucose from 11 to 6 mM also produced conversion from fast to slow subthreshold oscillations in two of four islets (Fig. 12 D). A larger mannoheptulose dose, 5 mM, completely eliminated either fast or slow activity (n = 6 of 6 islets) in accordance with the model, just as reducing glucose to 2.8 mM eliminates activity (data not shown).
Model prediction: metabolic oscillations occur for intermediate glucose levels
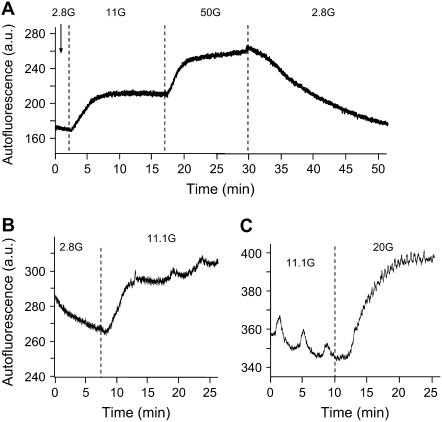
In the previous sections, we have shown that a model combining ionic and metabolic oscillations in different ways can account for all the patterns we have observed. Although our model is thus consistent with the experimental findings, we have yet to present any evidence that oscillations in metabolism occur within a range of glucose concentrations. To this end, we examined patterns in NAD(P)H autofluorescence from islets with the same equipment used to measure [Ca2+]i. In Fig. 13 A, changes in NAD(P)H autofluorescence are shown as glucose is raised from 2.8 to 11 to 50 mM and then back to 2.8 mM. Increasing glucose from 2.8 to 11 mM consistently increased autofluorescence from 253 ± 33 to 300 ± 38 arbitrary units (a.u.), a significant increase as assessed by a two-tailed paired t-test (p < 0.001, n = 24). Similar increases were observed when increasing from 11 to 20 or 25 mM glucose (369 ± 74 in 11 mM versus 409 ± 79 a.u. in 20–25 mM, p < 0.05, n = 10).
FIGURE 13.
NAD(P)H autofluorescence measurements in islets. (A) An example of changes in NAD(P)H in response to different glucose concentrations, with each glucose change denoted by vertical dotted lines. (B) An example of oscillations in NAD(P)H emerging as glucose is increased from 2.8 to 11 mM glucose. (C) An example of slow oscillations in NAD(P)H disappearing when glucose increases from 11 to 20 mM glucose.
We also monitored these recordings for oscillations in islet NAD(P)H autofluorescence. There were several cases in which oscillations in NAD(P)H emerged after increasing glucose from 2.8 to 11 mM glucose (Fig. 13 B, n = 6 of 24). Among the other 18 islets, six displayed only fast NAD(P)H oscillations in 11.1 mM glucose, 10 displayed no oscillations, and two displayed slow oscillations in both 2.8 and 11.1 mM glucose. As shown in Fig. 13 C, oscillations observed in 11.1 mM glucose often disappeared at higher glucose concentrations of 20 or 25 mM (n = 3 of 4). The fraction of islets demonstrating slow oscillations was greatest in 11 mM glucose (18/37), with a very small fraction in both 2.8 (2/25) and 20–25 mM (1/11) glucose. The difference was highly significant statistically (p < 0.001 by the χ-square test). The mean period of the oscillations observed in 11.1 mM glucose was estimated by visual inspection to be 308 ± 30 s, n = 18 of 37 measurements. These findings support the model prediction that there is a range of glucose concentrations in which slow oscillations in metabolism may occur (11.1 mM glucose in these experiments), with lower (2.8 mM) or higher (20 or 25 mM) glucose concentrations much less likely to support slow oscillations in metabolism.
DISCUSSION
We have systematically studied for the first time the effects of glucose on the period, amplitude, and plateau fraction of both fast and slow [Ca2+]i oscillations in the same islet preparation, and, indeed, in many cases in the same islet. Our results on the fast and slow oscillations individually are compatible with previous reports, but the observation that changes in glucose concentration (or, more generally, glucokinase activity) are sufficient to interconvert the fast and slow modes is novel. We have also for the first time interpreted the response to glucose using a mathematical model that is able to account for both fast and slow oscillations, yielding new insights into the mechanisms underlying the two rhythms and how they interact. These results lead us to conclude that both rhythms are part of the repertoire of normal islets and we suggest that both likely contribute to the overall islet response to glucose.
Summary of findings
As others have observed since at least the 1970s, we found that fast oscillations respond to glucose primarily with an increase in plateau fraction (10). We observed as well the U-shaped dependence of oscillation period on glucose concentration, which is derivative of the increase in plateau fraction (Figs. 2 and 3 A). At low glucose, where the active phase is short and the silent phase is long, increasing glucose primarily shortens the silent phase and hence decreases period. At higher glucose, where the active phase is long and the silent phase is short, further increase of glucose primarily lengthens the active phase, increasing period. Thus, period is minimized when the plateau fraction is near one-half. Overall, there is only a modest change in period, especially when compared with the full range of islet period achieved by fast and slow oscillations combined. Amplitude is likewise little affected. The increase in cytosolic Ca2+ is due to an increase in both the baseline (Fig. 2) and the plateau fraction. This increase in time-averaged [Ca2+]i likely accounts at least in part for the often-reported correlation of secretion with plateau fraction (10,59) but may not be the sole explanation (see below).
With regard to the slow oscillations, we have confirmed previous findings that the period and amplitude are at best only modestly affected by glucose concentration. We found that, as for the fast oscillations, the main effect of glucose was to raise plateau fraction. Such increase in period as we found was mainly due to an increase in the duration of the active phase or bursting episode, analogous to the increase of period seen in some cases for the fast oscillations (Fig. 2 B). One may wonder why we did not also see reduction of period with glucose elevation, due to reduction of the silent phase duration, as we did for the fast islets (Fig. 2 A). Such a decrease was in fact observed previously for slow oscillations ((29), their Figs. 1, 4, and 5), and is also predicted by the model for islets just above the threshold for oscillations (not shown). We believe that if we had more measurements for glucose levels just above threshold we would have seen this as well.
We therefore depart from previous conclusions that, in contrast to the fast oscillations, the slow oscillations are not glucose-sensitive once the threshold for activity is passed (42,43). Rather, we find that both modes of oscillation are affected by glucose in similar ways. As all reports agree, both modes are absent at low glucose and present at intermediate glucose levels that correspond to the in vivo physiological range, and both give way to a tonic elevation of [Ca2+]i at very high glucose. However, we find further that both undergo an increase in plateau fraction as glucose concentration is raised.
Also consistent with our modeling studies, we observed many instances in which islet activity shifted markedly in terms of oscillation period, amplitude, and plateau fraction when the glucose concentration was changed. We call this response “regime change”. This concept of regime change is important because it shows that both fast and slow patterns can occur within a single islet, demonstrating that they are not an artifact of the mouse strain or experimental conditions.
As others have noted (15,37,38,45), the slow oscillations with period of ∼5 min are in the correct range to account for the slow oscillations in insulin observed in vivo. This important link between slow in vitro and in vivo rhythms is further strengthened by the recent finding of similarities in period between in vivo plasma insulin oscillations and [Ca2+]i oscillations measured from the islets of the same mice in vitro (39). Thus, the case for slow islet [Ca2+]i oscillations as the pacemaker for in vivo insulin pulsatility is very strong. We feel that the present finding that the degree of increase in plateau fraction was approximately the same for the fast and slow modes (Fig. 8 C) suggests an important role for the fast oscillations as well and perhaps an underlying coordination of the two modes. In both the compound and pure slow variants of the slow oscillations in our model, the faster electrical subsystem is the process that the slow metabolic oscillation modulates. We have observed several examples of slow subthreshold [Ca2+]i oscillations (Figs. 6 C and 12 C), which we interpret as cases in which the slow metabolic oscillator is active but is unable to trigger significant [Ca2+]i fluctuations because the fast ionic oscillator is below the minimum threshold (Fig. 12, C and D) or above the maximum threshold (Fig. 6 C) for oscillations. See further interpretation below.
Schematic model
We have shown that the combined ionic-glycolytic model (46) can account for the responses of both fast and slow oscillations to glucose (Figs. 9–11), whether they stay within mode (Figs. 2 and 4) or switch modes (Fig. 6). The model further led to a prediction that a switch from fast to slow (in this case, subthreshold) oscillations could be induced by lowering glucose or partially inhibiting glucokinase pharmacologically (Fig. 12).
A key element of the model is the prediction that metabolic oscillations occur over an intermediate range of glucose but are absent at very low and high glucose. If the flux is very low, there is insufficient substrate for PFK to trigger an autocatalytic surge in FBP production. If the flux is very high, the substrate is never depleted, and PFK activity remains tonically elevated. In either case, [Ca2+]i levels would be governed by ionic mechanisms alone. We have in fact confirmed that NAD(P)H oscillations occur predominantly at intermediate glucose concentrations (∼11 mM; see Figs. 13 and 14), as recently reported (50). This off/oscillating/on pattern also holds for the ionic component of the model, and is, in fact, a universal feature of oscillators based on fast activation, slow inhibition kinetics. Thus, this positive finding is not itself proof of our specific model, nor even that the metabolic oscillations are glycolytic in origin. It is nonetheless a minimum requirement.
FIGURE 14.
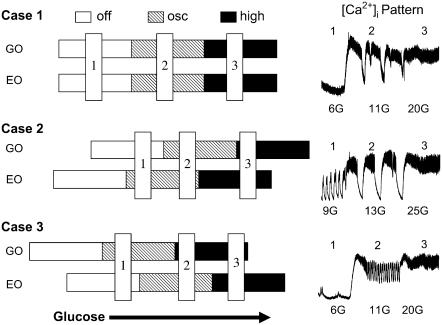
A schematic representation of the different relationships between the mechanisms that drive fast electrical oscillations (EO) and slow glycolytic oscillations (GO), and the [Ca2+]i patterns that result from the various interactions. See text for details.
These results were achieved with a detailed model involving multiple ion currents, two calcium compartments, and two metabolic subsystems to describe the glycolytic and mitochondrial dynamics. However, the explanatory power of the model can be largely encapsulated by a simple set of assumptions, diagrammed in Fig. 14. All one need assume is that:
There are electrical and glycolytic subsystems that can oscillate independently of each other (EO and GO in Fig. 14).
Each subsystem has a lower threshold for glucose at which oscillations begin and an upper threshold at which oscillations lock up at a high steady state (the open, hatched, and solid bars in Fig. 14).
The two subsystems can interact through the KATP-channel, which allows the glycolytic oscillations to modulate the electrical oscillations.
The simplest case (Case 1 in Fig. 14) is that the EO and GO increase their activity in step as glucose increases. Thus, at low glucose KATP-channels are open and the rate of glycolysis is very low, so there is neither electrical nor metabolic activity. When glucose is raised sufficiently, glycolysis begins oscillating and the islet depolarizes to permit bursts of electrical activity. These can be mixed, as shown in the inset to Case 1, or be purely slow, as in Fig. 4 A, depending on the intrinsic frequency of the electrical subsystem. At very high glucose concentrations, glycolysis is continuous and nonoscillatory, and electrical activity is also continuous because the islet is too depolarized to generate bursts.
However, some of our observations are best accounted for by assuming that the electrical oscillator and the glycolytic oscillator can have different thresholds for activation. The model suggests two possible outcomes that are described by sliding the horizontal activity bars in Cases 2 and 3. In Case 2, the threshold for electrical activity is lower than for glycolysis, and electrical activity occurs at a glucose concentration for which glycolytic flux is low and steady. As glucose is raised, however, glycolysis begins to oscillate, resulting in large slow oscillations in [Ca2+]i like those observed at 13 mM glucose (inset, Case 2). At very high glucose both the EO and GO saturate, producing a plateau of high [Ca2+]i. An alternative pattern predicted when the EO has a lower threshold than the GO is shown in Fig. 6 C. This would happen if the vertical blue bar labeled 3 in Case 2 were shifted to the left, so that the EO is saturated but the GO is still oscillating, resulting in modulated continuous spike activity.
In Case 3, we illustrate what happens when the GO has a lower threshold than the EO. Now, in the low glucose state, slow oscillations in glycolysis occur, but result only in subthreshold oscillations in the [Ca2+]i pattern. This could happen if, for example, the KATP conductance is too large for electrical bursts to occur. At sufficiently high glucose concentrations, fast bursting electrical activity can ensue, at the same time that glycolytic flux is too high to support oscillations and instead locks up at a plateau. Then, the only observed oscillation in islet [Ca2+]i would be the fast one. The inset shows that such a pattern can indeed be observed. Such subthreshold oscillations were observed six times among 18 recordings in 6 mM glucose, and five of the former were purely fast in 11 mM glucose as depicted in the inset. This is of course just the opposite of the experiment shown in Fig. 12, in which fast oscillations were converted to slow, subthreshold oscillations by reducing glucose or adding a small dose of mannoheptulose (i.e., stepping from 2 to 1 in Case 3), demonstrating that the effect is reversible.
Alternative models
We had previously shown (46) that the ionic-glycolytic model could account for the three observed patterns of islet [Ca2+]i oscillations, fast, slow, and mixed, but the requirement in this study that the model account for the diverse patterns of progression from one mode to another has imposed a major additional constraint. The success of the model in reproducing all the observed patterns lends significant new support to the model. We do not know of any alternative mathematical model that would be capable of explaining such rich behavior. The only other model that can presently account even for the existence of the mixed fast and slow pattern, for example, is the recently published model of Kang et al. (60). However, in that model, the mixed pattern stems from modulation of fast bursting by insulin feedback on glucose uptake, which means that the slow oscillations depend on the fast. This is not compatible with our observation of subthreshold slow oscillations. The same objection would apply to any model in which slow oscillations are strongly dependent on negative feedback by cytosolic Ca2+, including the phantom-bursting model we have previously proposed (46) and the model of Fridlyand et al. (61).
Another hypothesis to account for the fast, slow, and mixed oscillation patterns is that the fast oscillations are due to cAMP-dependent release of store Ca2+ (43). In this view, fast oscillations in islets result from release of glucagon by α-cells, which raises cAMP in the β-cells; isolated cells see no glucagon and therefore are slow. Based on this idea, one might suggest that regime change occurs when an increase in glucose reduces the activity of α-cells. However, we saw regime change in response to both glucose increases and decreases (Figs. 6 and 12). More directly, we found that the slower Ca2+ patterns we studied were only modestly modulated by the membrane-permeant cAMP analog 8-bromo-cAMP (C. S. Nunemaker and L. S. Satin, unpublished). This is consistent with the report of Beauvois et al. ((62), Fig. 5) that forskolin could not elicit Ca2+ release in islets from NMRI mice but could do so in the ob/ob islets used by Liu et al. (43). Our results, especially the finding of conversion from fast to slow oscillations by both increases and decreases of glucose concentration, do not fit well with the hypothesis of Liu et al. that the mixed pattern results from islets in which some cells are fast and others are slow. Our model is compatible, however, with the recent report that in the mixed oscillations [Ca2+]i and membrane potential are synchronized with each other, and that the [Ca2+]i oscillations are synchronized across the islet (63). The glycolytic hypothesis thus appears to offer the best explanation to date of our data.
Data that challenge the model
A challenge to our hypothesis is the observation that slow Ca2+ oscillations occur in response to leucine and the mitochondrial fuel KIC but not glucose (64). However, more recently, others (41,65), have reported that metabolic stimulators, such as KIC, methyl pyruvate, or glyceraldehyde, used in place of glucose, were not capable of generating slow oscillations in islet activity, whereas glucose alone could do so. Glyceraldehyde, which is a glycolytic intermediate, is capable of supporting slow oscillations in [Ca2+]i and insulin secretion, but only when some amount of glucose is also present (41). Further investigation is needed to sort out these conflicting reports.
Another challenge is the reported persistence of slow oscillations in SUR1 −/− islets, which lack KATP-channels (66,67). Without KATP-channels, the glycolytic oscillator would be uncoupled to the plasma membrane in our model. Full consideration of the mechanisms of insulin secretion and calcium oscillations in these knockout animals is beyond the scope of this study, but some questions for future work include whether their [Ca2+]i oscillations are metabolic or ionic and whether they express other electrical targets for metabolism that are unmasked or upregulated.
A recent study of glucose sensing in isolated mouse β-cells has suggested that [Ca2+]i oscillations are of limited predictive power for understanding the regulation of insulin secretion, reporting that [Ca2+]i levels saturate at a relatively low glucose level of 8 mM (42). It was suggested that a metabolic coupling signal related to mitochondrial membrane potential, which was found to increase linearly with glucose concentration up to at least 16 mM, plays a key role in enhancing insulin secretion. We have not addressed signals beyond [Ca2+]i in this study, but point out that the behavior of islets may differ from that of single cells. Another recent study (68) reported that mean [Ca2+]i rises with glucose concentrations up to at least 16 mM and, during the prolonged second phase of insulin secretion, is strongly related to plateau fraction of electrical activity.
In summary, we have shown that both fast and slow oscillations are regulated by glucose in similar ways despite some differences in detail. The slow oscillations seem more obviously related to in vivo insulin pulsatility, but it seems unlikely that the fast oscillations, which are highly structured and regulated, are unimportant. The way the two processes interact to define the full islet response to glucose is an important question for the future. This study has also provided further strong support for a model in which the fast oscillations are primarily ionic and the slow oscillations primarily metabolic in origin. The combinatory interaction of these two relatively simple mechanisms has been shown to be able to account for a wide array of oscillation patterns, including sequences of patterns observed in response to glucose elevation and decrement. This ability for a small set of assumptions to explain a large body of data speaks well for the model, as do the new questions it raises, such as the interaction of oscillations in both the triggering ([Ca2+]i) and amplifying (metabolic coupling) pathways. We respectfully suggest that critical study of the model, both its strengths and weaknesses, will open up new pathways toward understanding β-cell function and its role in diabetes.
Acknowledgments
This work was supported by National Science Foundation grant No. DMS-0311856 to R.B., the Intramural Research Program of the National Institutes of Health, National Institute of Diabetes and Digestive and Kidney Diseases (A.S., K.T.-A., and C.R.D.), and National Institutes of Health grants No. RO1-DK-46409 to L.S.S. and No. F32-DK-065462 to C.S.N.
APPENDIX
The mathematical model used in Figs. 9–12 was developed in a prior publication (46), where the model equations are described in detail. Here we provide the equations with a brief explanation.
The glycolytic component
 |
(2) |
 |
(3) |
Here, G6P is the glucose 6-phosphate concentration and FBP is the fructose 1,6-bisphosphate concentration (both in μM). The fructose 6-phosphate (F6P) concentration is then F6P = 0.3 G6P. The term JGK is the glucokinase (GK) reaction rate (μM s−1, as with other reaction rates), which is determined by the glucose concentration. We treat it as a parameter. JPFK is the phosphofructokinase (PFK) reaction rate,
 |
(4) |
where l, j, k, l take value 0 or 1, and
 |
(5) |
Finally, JGPDH is the glyceraldehyde 3-P dehydrogenase (GPDH) reaction rate,
 |
(6) |
The adenine nucleotide component
The total adenine nucleotide concentration is assumed to be conserved,
 |
(7) |
and the actions of adenylate kinase give
 |
(8) |
Finally, ADP changes in time according to
 |
(9) |
This represents conversion of ADP to ATP by the mitochondria. One source of input to the mitochondria, represented by r, is through C- or L-type PFK and is nonoscillatory. The other input, represented by γ, is through M-type PFK and can be oscillatory (51):
 |
(10) |
The values of parameters r, kγ, and νγ are adjusted in the different model figures.
The cytosol/plasma membrane component
Four ionic currents are included in the voltage equation: current through delayed rectifier K+ channels (IK), through L-type Ca2+ channels (ICa), through Ca2+-activated K+ channels (IK(Ca)), and through ATP-sensitive K+ channels (IK(ATP)). The membrane potential (V) and the delayed rectifier activation variable (n) change in time according to
 |
(11) |
 |
(12) |
There are two Ca2+ compartments in the model: a cytosolic compartment and an endoplasmic reticulum (ER) compartment. The concentration of free cytosolic Ca2+ changes according to
 |
(13) |
where Jmem is Ca2+ flux through the plasma membrane, and JER is flux from the ER,
 |
(14) |
 |
(15) |
 |
(16) |
 |
(17) |
The concentration of free Ca2+ in the ER ([Ca2+]ER) changes according to
 |
(18) |
where Vc and VER are the volumes of the cytosol and ER compartments, respectively.
All other mathematical expressions are given in Bertram et al. (46). Parameter values are the same as in that article, except those given in the figure captions.
References
- 1.Hellerstrom, C. 1967. Effects of carbohydrates on the oxygen consumption of isolated pancreatic islets of mice. Endocrinology. 81:105–112. [DOI] [PubMed] [Google Scholar]
- 2.Hutton, J. C., and W. J. Malaisse. 1980. Dynamics of O2 consumption in rat pancreatic islets. Diabetologia. 18:395–405. [DOI] [PubMed] [Google Scholar]
- 3.Duchen, M. R. 1999. Contributions of mitochondria to animal physiology: from homeostatic sensor to calcium signalling and cell death. J. Physiol. 516:1–17. [DOI] [PMC free article] [PubMed] [Google Scholar]
- 4.Ashcroft, F. M., and P. Rorsman. 1989. Electrophysiology of the pancreatic β-cell. Prog. Biophys. Mol. Biol. 54:87–143. [DOI] [PubMed] [Google Scholar]
- 5.Bratusch-Marrain, P. R., M. Komjati, and W. K. Waldhausl. 1986. Efficacy of pulsatile versus continuous insulin administration on hepatic glucose production and glucose utilization in type 1 diabetic humans. Diabetes. 35:922–926. [DOI] [PubMed] [Google Scholar]
- 6.Polonsky, K. S., J. Sturis, and E. Van Cauter. 1998. Temporal profiles and clinical significance of pulsatile insulin secretion. Horm. Res. 49:178–184. [DOI] [PubMed] [Google Scholar]
- 7.Matthews, D. R., B. A. Naylor, R. G. Jones, G. M. Ward, and R. C. Turner. 1983. Pulsatile insulin has greater hypoglycemic effect than continuous delivery. Diabetes. 32:617–621. [DOI] [PubMed] [Google Scholar]
- 8.Dean, P. M., and E. K. Matthews. 1968. Electrical activity in pancreatic islet cells. Nature. 219:389–390. [DOI] [PubMed] [Google Scholar]
- 9.Dean, P. M., and E. K. Matthews. 1970. Electrical activity in pancreatic islet cells: effect of ions. J. Physiol. 210:265–275. [DOI] [PMC free article] [PubMed] [Google Scholar]
- 10.Meissner, H. P., and H. Schmelz. 1974. Membrane potential of β-cells in pancreatic islets. Pflugers Arch. 351:195–206. [DOI] [PubMed] [Google Scholar]
- 11.Atwater, I., C. M. Dawson, B. Ribalet, and E. Rojas. 1979. Potassium permeability activated by intracellular calcium ion concentration in the pancreatic β-cell. J. Physiol. 288:575–588. [PMC free article] [PubMed] [Google Scholar]
- 12.Ribalet, B., and P. M. Beigelman. 1980. Calcium action potentials and potassium permeability activation in pancreatic β-cells. Am. J. Physiol. 239:C124–C133. [DOI] [PubMed] [Google Scholar]
- 13.Ribalet, B., and P. M. Beigelman. 1981. Effects of divalent cations on β-cell electrical activity. Am. J. Physiol. 241:C59–C67. [DOI] [PubMed] [Google Scholar]
- 14.Dean, P. M., and E. K. Matthews. 1970. Glucose-induced electrical activity in pancreatic islet cells. J. Physiol. 210:255–264. [DOI] [PMC free article] [PubMed] [Google Scholar]
- 15.Beigelman, P. M., and B. Ribalet. 1980. Beta-cell electrical activity in response to high glucose concentration. Diabetes. 29:263–265. [DOI] [PubMed] [Google Scholar]
- 16.Scott, A. M., I. Atwater, and E. Rojas. 1981. A method for the simultaneous measurement of insulin release and β-cell membrane potential in single mouse islets of Langerhans. Diabetologia. 21:470–475. [DOI] [PubMed] [Google Scholar]
- 17.Ammala, C., L. Eliasson, K. Bokvist, O. Larsson, F. M. Ashcroft, and P. Rorsman. 1993. Exocytosis elicited by action potentials and voltage-clamp calcium currents in individual mouse pancreatic β-cells. J. Physiol. 472:665–688. [DOI] [PMC free article] [PubMed] [Google Scholar]
- 18.Barbosa, R. M., A. M. Silva, A. R. Tome, J. A. Stamford, R. M. Santos, and L. M. Rosario. 1998. Control of pulsatile 5-HT/insulin secretion from single mouse pancreatic islets by intracellular calcium dynamics. J. Physiol. 510:135–143. [DOI] [PMC free article] [PubMed] [Google Scholar]
- 19.Santos, R. M., L. M. Rosario, A. Nadal, J. Garcia-Sancho, B. Soria, and M. Valdeolmillos. 1991. Widespread synchronous [Ca2+]i oscillations due to bursting electrical activity in single pancreatic islets. Pflugers Arch. 418:417–422. [DOI] [PubMed] [Google Scholar]
- 20.Zhang, M., P. Goforth, R. Bertram, A. Sherman, and L. Satin. 2003. The Ca2+ dynamics of isolated mouse β-cells and islets: implications for mathematical models. Biophys. J. 84:2852–2870. [DOI] [PMC free article] [PubMed] [Google Scholar]
- 21.Goodner, C. J., B. C. Walike, D. J. Koerker, J. W. Ensinck, A. C. Brown, E. W. Chideckel, J. Palmer, and L. Kalnasy. 1977. Insulin, glucagon, and glucose exhibit synchronous, sustained oscillations in fasting monkeys. Science. 195:177–179. [DOI] [PubMed] [Google Scholar]
- 22.Lang, D. A., D. R. Matthews, J. Peto, and R. C. Turner. 1979. Cyclic oscillations of basal plasma glucose and insulin concentrations in human beings. N. Engl. J. Med. 301:1023–1027. [DOI] [PubMed] [Google Scholar]
- 23.Stagner, J. I., E. Samols, and G. C. Weir. 1980. Sustained oscillations of insulin, glucagon, and somatostatin from the isolated canine pancreas during exposure to a constant glucose concentration. J. Clin. Invest. 65:939–942. [DOI] [PMC free article] [PubMed] [Google Scholar]
- 24.Song, S. H., S. S. McIntyre, H. Shah, J. D. Veldhuis, P. C. Hayes, and P. C. Butler. 2000. Direct measurement of pulsatile insulin secretion from the portal vein in human subjects. J. Clin. Endocrinol. Metab. 85:4491–4499. [DOI] [PubMed] [Google Scholar]
- 25.Porksen, N., M. Hollingdal, C. Juhl, P. Butler, J. D. Veldhuis, and O. Schmitz. 2002. Pulsatile insulin secretion: detection, regulation, and role in diabetes. Diabetes. 51:S245–S254. [DOI] [PubMed] [Google Scholar]
- 26.Nunemaker, C. S., D. H. Wasserman, O. P. McGuinness, I. R. Sweet, J. C. Teague, and L. S. Satin. 2006. Insulin secretion in the conscious mouse is biphasic and pulsatile. Am. J. Physiol. Endocrinol. Metab. 290:E523–E529. [DOI] [PubMed] [Google Scholar]
- 27.Henquin, J. C., H. P. Meissner, and W. Schmeer. 1982. Cyclic variations of glucose-induced electrical activity in pancreatic β-cells. Pflugers Arch. 393:322–327. [DOI] [PubMed] [Google Scholar]
- 28.Cook, D. L. 1983. Isolated islets of Langerhans have slow oscillations of electrical activity. Metabolism. 32:681–685. [DOI] [PubMed] [Google Scholar]
- 29.Gilon, P., and J. C. Henquin. 1995. Distinct effects of glucose on the synchronous oscillations of insulin release and cytoplasmic Ca2+ concentration measured simultaneously in single mouse islets. Endocrinology. 136:5725–5730. [DOI] [PubMed] [Google Scholar]
- 30.Longo, E. A., K. Tornheim, J. T. Deeney, B. A. Varnum, D. Tillotson, M. Prentki, and B. E. Corkey. 1991. Oscillations in cytosolic free Ca2+, oxygen consumption, and insulin secretion in glucose-stimulated rat pancreatic islets. J. Biol. Chem. 266:9314–9319. [PubMed] [Google Scholar]
- 31.Jung, S. K., C. A. Aspinwall, and R. T. Kennedy. 1999. Detection of multiple patterns of oscillatory oxygen consumption in single mouse islets of Langerhans. Biochem. Biophys. Res. Commun. 259:331–335. [DOI] [PubMed] [Google Scholar]
- 32.Jung, S. K., L. M. Kauri, W. J. Qian, and R. T. Kennedy. 2000. Correlated oscillations in glucose consumption, oxygen consumption, and intracellular free Ca2+ in single islets of Langerhans. J. Biol. Chem. 275:6642–6650. [DOI] [PubMed] [Google Scholar]
- 33.Krippeit-Drews, P., M. Dufer, and G. Drews. 2000. Parallel oscillations of intracellular calcium activity and mitochondrial membrane potential in mouse pancreatic β-cells. Biochem. Biophys. Res. Commun. 267:179–183. [DOI] [PubMed] [Google Scholar]
- 34.Kindmark, H., M. Kohler, G. Brown, R. Branstrom, O. Larsson, and P. O. Berggren. 2001. Glucose-induced oscillations in cytoplasmic free Ca2+ concentration precede oscillations in mitochondrial membrane potential in the pancreatic β-cell. J. Biol. Chem. 276:34530–34536. [DOI] [PubMed] [Google Scholar]
- 35.Nunemaker, C. S., and L. S. Satin. 2004. Comparison of metabolic oscillations from mouse pancreatic β-cells and islets. Endocrine. 25:61–67. [DOI] [PubMed] [Google Scholar]
- 36.Katzman, S. M., M. A. Messerli, D. T. Barry, A. Grossman, T. Harel, J. D. Wikstrom, B. E. Corkey, P. J. Smith, and O. S. Shirihai. 2004. Mitochondrial metabolism reveals a functional architecture in intact islets of Langerhans from normal and diabetic Psammomys obesus. Am. J. Physiol. Endocrinol. Metab. 287:E1090–E1099. [DOI] [PubMed] [Google Scholar]
- 37.Bergsten, P., E. Grapengiesser, E. Gylfe, A. Tengholm, and B. Hellman. 1994. Synchronous oscillations of cytoplasmic Ca2+ and insulin release in glucose-stimulated pancreatic islets. J. Biol. Chem. 269:8749–8753. [PubMed] [Google Scholar]
- 38.Bergsten, P., J. Westerlund, P. Liss, and P. O. Carlsson. 2002. Primary in vivo oscillations of metabolism in the pancreas. Diabetes. 51:699–703. [DOI] [PubMed] [Google Scholar]
- 39.Nunemaker, C. S., M. Zhang, D. H. Wasserman, O. P. McGuinness, A. C. Powers, R. Bertram, A. Sherman, and L. S. Satin. 2005. Individual mice can be distinguished by the period of their islet calcium oscillations: is there an intrinsic islet period that is imprinted in vivo? Diabetes. 54:3517–3522. [DOI] [PubMed] [Google Scholar]
- 40.Gilon, P., M. A. Ravier, J. C. Jonas, and J. C. Henquin. 2002. Control mechanisms of the oscillations of insulin secretion in vitro and in vivo. Diabetes. 51:S144–S151. [DOI] [PubMed] [Google Scholar]
- 41.Dahlgren, G. M., L. M. Kauri, and R. T. Kennedy. 2005. Substrate effects on oscillations in metabolism, calcium and secretion in single mouse islets of Langerhans. Biochim. Biophys. Acta. 1724:23–36. [DOI] [PubMed] [Google Scholar]
- 42.Heart, E., R. F. Corkey, J. D. Wikstrom, O. S. Shirihai, and B. E. Corkey. 2006. Glucose-dependent increase in mitochondrial membrane potential, but not cytoplasmic calcium, correlates with insulin secretion in single islet cells. Am. J. Physiol. Endocrinol. Metab. 290:E143–E148. [DOI] [PubMed] [Google Scholar]
- 43.Liu, Y. J., A. Tengholm, E. Grapengiesser, B. Hellman, and E. Gylfe. 1998. Origin of slow and fast oscillations of Ca2+ in mouse pancreatic islets. J. Physiol. 508:471–481. [DOI] [PMC free article] [PubMed] [Google Scholar]
- 44.Gylfe, E., E. Grapengiesser, Y. J. Liu, S. Dryselius, A. Tengholm, and M. Eberhardson. 1998. Generation of glucose-dependent slow oscillations of cytoplasmic Ca2+ in individual pancreatic β-cells. Diabetes Metab. 24:25–29. [PubMed] [Google Scholar]
- 45.Tornheim, K. 1997. Are metabolic oscillations responsible for normal oscillatory insulin secretion? Diabetes. 46:1375–1380. [DOI] [PubMed] [Google Scholar]
- 46.Bertram, R., L. Satin, M. Zhang, P. Smolen, and A. Sherman. 2004. Calcium and glycolysis mediate multiple bursting modes in pancreatic islets. Biophys. J. 87:3074–3087. [DOI] [PMC free article] [PubMed] [Google Scholar]
- 47.Gilon, P., and J. C. Henquin. 1992. Influence of membrane potential changes on cytoplasmic Ca2+ concentration in an electrically excitable cell, the insulin-secreting pancreatic B-cell. J. Biol. Chem. 267:20713–20720. [PubMed] [Google Scholar]
- 48.Bennett, B. D., T. L. Jetton, G. Ying, M. A. Magnuson, and D. W. Piston. 1996. Quantitative subcellular imaging of glucose metabolism within intact pancreatic islets. J. Biol. Chem. 271:3647–3651. [DOI] [PubMed] [Google Scholar]
- 49.Rocheleau, J. V., W. S. Head, and D. W. Piston. 2004. Quantitative NAD(P)H/flavoprotein autofluorescence imaging reveals metabolic mechanisms of pancreatic islet pyruvate response. J. Biol. Chem. 279:31780–31787. [DOI] [PubMed] [Google Scholar]
- 50.Luciani, D. S., S. Misler, and K. S. Polonsky. 2006. Ca2+ controls slow NAD(P)H oscillations in glucose-stimulated mouse pancreatic islets. J. Physiol. 572:379–392. [DOI] [PMC free article] [PubMed] [Google Scholar]
- 51.Yaney, G. C., V. Schultz, B. A. Cunningham, G. A. Dunaway, B. E. Corkey, and K. Tornheim. 1995. Phosphofructokinase isozymes in pancreatic islets and clonal β-cells (INS-1). Diabetes. 44:1285–1289. [DOI] [PubMed] [Google Scholar]
- 52.Keizer, J., and G. Magnus. 1989. ATP-sensitive potassium channel and bursting in the pancreatic β-cell. A theoretical study. Biophys. J. 56:229–242. [DOI] [PMC free article] [PubMed] [Google Scholar]
- 53.Gopel, S. O., T. Kanno, S. Barg, L. Eliasson, J. Galvanovskis, E. Renstrom, and P. Rorsman. 1999. Activation of Ca2+-dependent K+ channels contributes to rhythmic firing of action potentials in mouse pancreatic β-cells. J. Gen. Physiol. 114:759–770. [DOI] [PMC free article] [PubMed] [Google Scholar]
- 54.Goforth, P. B., R. Bertram, F. A. Khan, M. Zhang, A. Sherman, and L. S. Satin. 2002. Calcium-activated K+ channels of mouse β-cells are controlled by both store and cytoplasmic Ca2+: experimental and theoretical studies. J. Gen. Physiol. 120:307–322. [DOI] [PMC free article] [PubMed] [Google Scholar]
- 55.Detimary, P., P. Gilon, and J. C. Henquin. 1998. Interplay between cytoplasmic Ca2+ and the ATP/ADP ratio: a feedback control mechanism in mouse pancreatic islets. Biochem. J. 333:269–274. [DOI] [PMC free article] [PubMed] [Google Scholar]
- 56.Sherman, A., P. Carroll, R. M. Santos, and I. Atwater. 1990. Glucose dose response of pancreatic β-cells: experimental and theoretical results. In Transduction in Biological Systems. J. B. C. Hidalgo, E. Jaimovich, and J. Vergara, editors. Plenum Publishing, NY. 123–141.
- 57.Henquin, J. C. 1992. Adenosine triphosphate-sensitive K+ channels may not be the sole regulators of glucose-induced electrical activity in pancreatic β-cells. Endocrinology. 131:127–131. [DOI] [PubMed] [Google Scholar]
- 58.Sweet, I. R., G. Li, H. Najafi, D. Berner, and F. M. Matschinsky. 1996. Effect of a glucokinase inhibitor on energy production and insulin release in pancreatic islets. Am. J. Physiol. 271:E606–E625. [DOI] [PubMed] [Google Scholar]
- 59.Sanchez-Andres, J. V., A. Gomis, and M. Valdeolmillos. 1995. The electrical activity of mouse pancreatic β-cells recorded in vivo shows glucose-dependent oscillations. J. Physiol. 486:223–228. [DOI] [PMC free article] [PubMed] [Google Scholar]
- 60.Kang, H., J. Jo, H. J. Kim, M. Y. Choi, S. W. Rhee, and D. S. Koh. 2005. Glucose metabolism and oscillatory behavior of pancreatic islets. Phys. Rev. E. 72:051905–051916. [DOI] [PubMed] [Google Scholar]
- 61.Fridlyand, L. E., N. Tamarina, and L. H. Philipson. 2003. Modeling of Ca2+ flux in pancreatic β-cells: role of the plasma membrane and intracellular stores. Am. J. Physiol. Endocrinol. Metab. 285:E138–E154. [DOI] [PubMed] [Google Scholar]
- 62.Beauvois, M. C., A. Arredouani, J. C. Jonas, J. F. Rolland, F. Schuit, J. C. Henquin, and P. Gilon. 2004. Atypical Ca2+-induced Ca2+ release from a sarco-endoplasmic reticulum Ca2+-ATPase 3-dependent Ca2+ pool in mouse pancreatic β-cells. J. Physiol. 559:141–156. [DOI] [PMC free article] [PubMed] [Google Scholar]
- 63.Beauvois, M. C., C. Merezak, J. C. Jonas, M. A. Ravier, J. C. Henquin, and P. Gilon. 2005. Glucose-induced mixed [Ca2+]i oscillations in mouse {β-}-cells are controlled by the membrane potential and the SERCA3 Ca2+-ATPase of the endoplasmic reticulum. Am. J. Physiol. Cell Physiol. 290:C1503–C1511. [DOI] [PubMed] [Google Scholar]
- 64.Martin, F., J. V. Sanchez-Andres, and B. Soria. 1995. Slow [Ca2+]i oscillations induced by ketoisocaproate in single mouse pancreatic islets. Diabetes. 44:300–305. [DOI] [PubMed] [Google Scholar]
- 65.Lenzen, S., M. Lerch, T. Peckmann, and M. Tiedge. 2000. Differential regulation of [Ca2+]i oscillations in mouse pancreatic islets by glucose, α-ketoisocaproic acid, glyceraldehyde and glycolytic intermediates. Biochim. Biophys. Acta. 1523:65–72. [DOI] [PubMed] [Google Scholar]
- 66.Nenquin, M., A. Szollosi, L. Aguilar-Bryan, J. Bryan, and J. C. Henquin. 2004. Both triggering and amplifying pathways contribute to fuel-induced insulin secretion in the absence of sulfonylurea receptor-1 in pancreatic β-cells. J. Biol. Chem. 279:32316–32324. [DOI] [PubMed] [Google Scholar]
- 67.Dufer, M., D. Haspel, P. Krippeit-Drews, L. Aguilar-Bryan, J. Bryan, and G. Drews. 2004. Oscillations of membrane potential and cytosolic Ca2+ concentration in SUR1(−/−)β-cells. Diabetologia. 47:488–498. [DOI] [PubMed] [Google Scholar]
- 68.Henquin, J. C., M. Nenquin, P. Stiernet, and B. Ahren. 2006. In vivo and in vitro glucose-induced biphasic insulin secretion in the mouse: pattern and role of cytoplasmic Ca2+ and amplification signals in β-cells. Diabetes. 55:441–451. [DOI] [PubMed] [Google Scholar]


