

Abstract
Objective
Individuals continue to develop HIV-1-associated dementia (HAD) despite treatment with highly active antiretroviral therapy (HAART). Monocytes/macrophages (M/MΦ) can harbor proviral DNA that is not eradicated by HAART. To determine if HAD is associated with the level of HIV-1 infection within circulating leukocytes, we quantified HIV-1 DNA copy number in peripheral blood mononuclear cells (PBMC), and in PBMC subsets.
Design
Cross-sectional analysis within the Hawaii Aging with HIV Cohort comparing participants with HAD to those with normal cognition (NC).
Methods
Real-time PCR assays assessing HIV DNA copy number/1 × 106 cells were performed on PBMC and subsets.
Results
Individuals with HAD (n = 27) had a median (interquartile range) of 9.11 (37.20) HIV DNA per 1 × 10⁶ PBMC compared to 0.49 (0.89) HIV DNA per 1 × 10⁶ PBMC in individuals with NC (n = 22). Using a univariate analysis in the subset of individuals with undetectable viral load (HAD, n = 11; NC, n = 13), the odds of HAD attributable to HIV DNA copy number was 2.76 (1.28–5.94), P < 0.01. Preliminary analysis of a small subset of patients (n = 5) suggested that the primary source of HIV DNA may be the activated M/MΦ(CD14/CD16) subset.
Conclusions
These findings suggest a potentially important association between circulating provirus and HAD.
Keywords: HIV-1, DNA, dementia, provirus
Introduction
HIV-1-associated dementia (HAD) persists among HIV-1-infected individuals despite highly active antiretroviral therapy (HAART) [1–3]. In the pre-HAART era, approximately 15% of patients with low CD4 cell counts progressed to HAD [4]. While the incidence of HAD currently appears to be decreasing, the prevalence has risen from 6.6/100 person years in 1994 to 10.1/100 person years in 2000 [4–6]. A determination of the factors associated with prevalent HAD despite effective suppression of peripheral HIV-1-infection is needed. In the era of HAART, the utility of circulating plasma HIV-1 virus (viral load, VL) measurement as a marker of HAD has decreased [7–10]. We propose that detectable plasma VL is neither necessary nor sufficient for the presence of HAD, and that other factors are involved in the pathogenesis of HAD [5,9,11–14].
Monocytes/macrophages (M/MΦ) are important in the pathogenesis of HAD. Individuals with HAD have higher percentages of circulating activated M/MΦ [14]; these cells are probably important in the neuropathogenesis of HIV-1 possibly by increased virus trafficking into the central nervous system [1,14,15]. As important HIV-1 reservoirs, M/MΦ could harbor proviral DNA [16–18], suggesting a mechanism of increased risk among individuals with undetectable plasma VL [19,20]. In recent experiments, productive HIV-1 infection of macrophages in SCID mice suggest a role in neurological disease [16]. We were therefore interested in assessing the correlation of proviral DNA with HAD by quantitatively assessing HIV-1 DNA copy number (HIV DNA) in PBMC, and further, to determine the association with activated M/MΦ.
Materials and methods
Cohort and clinical data
The participants for this study were selected from the Hawaii Aging with HIV Cohort (HAHC) following informed consent [21]. This longitudinal cohort was established to examine HAD and other neurologic complications in older (≥50 years old) compared to younger (20–39 years old) HIV-1-seropositive individuals living in Hawaii. Less than 5% of the participants in the HAHC identify injecting drug use as a risk factor for HIV-1 infection [6,22–24]. Individuals were excluded for the following reasons: (i) a major psychiatric or neurologic disorder; (ii) a history of head injury with loss of consciousness greater than 1 h; (iii) current or past opportunistic infection with brain involvement; (iv) a diagnosed learning disability; or (v) delirium due to medications at the time of examination. Evaluations included the macro-neurological examination, a medical history questionnaire, a medication/adherence history, a DSM-IV-based substance abuse/dependence inventory, immunologic and virologic laboratory tests, and neuropsychological testing. Research-based neurocognitive diagnoses were established for each participant using the American Academy of Neurology 1991 criteria [25]. Full details of the diagnostic approach within HAHC are provided elsewhere [21,26,27].
Specimens and assessment of HIV DNA
Specimens were obtained and stored at the time of study entry. Plasma VL (Amplicor HIV-1 Monitor Ultra Sensitive Test, Roche Diagnostics, Switzerland) and CD4 cell counts were performed by a certified clinical laboratory. Genomic DNA was purified from peripheral blood mononuclear cells (PBMC) using standard phenol–chloroform extraction. Alternatively, in some cases, a direct lysis protocol was used. Both are comparable in adequately assessing HIV DNA [28,29]. The DNA samples were stored at −20 °C and assayed in batches. The quantity and quality of the DNA was assessed by ultraviolet spectrophotometry and PCR analysis using HLADQα and/or β-globin primers as described previously [30].
The assay for measuring HIV DNA was modified from a previously described real-time PCR method demonstrating reproducible intra-assay (replicates within the same real-time PCR run) and inter-assay (replicates between four different runs) results with mean coefficients of variation of 1.1% and 1.4%, respectively with an estimated detection limit in the range 1.0–5.0 (±1.0–3.4) HIV DNA copies [31,32]. Assays were set up with independent standard curves measuring relative viral DNA copy number and cellular equivalent genomic DNA compared to unknown specimens. DNA for control and standards was extracted from 8E5 cell line (ATCC 8993, NIH AIDS Research and Reference Reagent Program, Rockville, Maryland, USA), a T-lymphoblastoid cell line with a single copy of HIV-1 per cell [33,34]. The 8E5 DNA was used as a standard for both the c-jun and HIV-1 primers to compare the relative HIV-1 burden with the identical aliquot of standard DNA with each run of unknown specimens. Additional control DNA was prepared from non-HIV-1 infected PBMC as well as an HIV-1 control panel, provided by the NIH AIDS Research and Reagent Reference Program (RRR) [35]. Primers for viral genes included two HIV-1 primers that target the gag gene of HIV-1 [36]: sense, 5′-ATAATC-CACCTATCCCAGTAGGAGAAAT-3′; and antisense, 5′-TTTGGTCCTTGTCTTATGTCCAGAATGC-3′, which amplified a 115-bp fragment. For the human genomic gene, the c-jun primers amplified a 248-bp piece of DNA from the single copy human c-jun gene: sense, 5′-CATGGAGTCCCAGGAGVGGATCA-3′; and anti-sense, 5′-GCAACTGCTGCGTTAGCATGAGT-3′ (GenBank Accession number J04111). All sample preparations were performed in a flow hood to minimize any cross-contamination and in a separate area away from the thermalcycler. Assays were performed by real-time PCR using Quantitect Sybr Green PCR Kit (Qiagen, Valencia, California, USA).
TheHIV-1PCRcontrolpanelwasusedtotestthestandards in our assay and to test the detection limit of the assay as described previously [35]. HIV DNA standards from the RRR Program were provided as 1, 20, 50 and 100 copies, which were setupin our assay separatelyand in thepresence of 1 × 10⁶ and 1 × 10³ PBMC equivalents. A panel consisting of 5 and 20 copies per 1 × 10⁶ PBMC and negative controls (no template and HIV-1-seronegative PBMC DNA) was tested in triplicate. Means and standard deviations for the control standards were: 0, 5.3 (± 3.2), and 18.3 (± 4.3) HIV DNA copies per 1 × 10⁶ PBMC for the respective controls (0, 5, 20 copies).
Initially, each sample and standard, including positive and negative controls, was set up in triplicate containing: Sybr Green Master Mix, 5 μl glycerol, 15 pmol each primer, and 0.1 μg sample DNA. PCR cycling conditions were: 95 °C for 15 min, 40 cycles of 95 °C for 30 s, 55 °C for 1 min, and 72 °C for 30 s, followed by a 7-min final extension step at 72 °C. At the conclusion of the PCR, a melt curve analysis was programmed with the following conditions: beginning at 48 °C, the temperature increased half a degree every 10 s for 90 cycles. The initial specimen DNA was diluted in concentrations corresponding to 40 000 cell equivalents/10 μl with the number of cell equivalents calculated assuming that 6.6 ng of DNA was equivalent to 1 × 10³ cells [37]. If a specimen had a sample threshold temperature outside the standard threshold temperatures, the assay was repeated with increasing or decreasing amounts of template until the specimen threshold temperature was within the standard threshold temperatures. Initially, the same amount of template was used for both the virus and genomic primer sets. If the result for the virus primer set was below the lowest standard, then another reaction was set up using additional template, depending on how far outside the standard curve the result was. For lower copies (less than 1 copy number per million cells), the results were extrapolated from the standard curves generated by the real-time PCR program, iCycler IQ Software Program, version 3.0 (BioRad, Hercules, California, USA). Thus each specimen was evaluated and quantified individually with the genomic and virus equivalents independently. Stored supernatants recovered from extracted DNA were assayed for HIV DNA, which were undetectable for HIV DNA using appropriate positive and negative controls.
In the analyses, each unknown was analyzed against the standard curve generated by the iCycler IQ Software Program (BioRad) and calculated as HIV DNA copy number per 1 × 10⁶ cells. The reported value was related to the number of genomic equivalents as defined by simultaneous amplification of genomic c-jun sequences, as described previously [31].
CD14/CD16 isolation and HIV DNA analysis
A Monoctye Isolation Kit and CD16-positive selection was used on specific cases with the AutoMacs (Miltenyi Biotec Inc., Auburn, California, USA) cell separation machine harvesting both CD16-positive and CD16-negative cell populations. The initial isolation for CD14 utilized a negative selection, which isolated CD14-positive and CD14-negative pools. The CD14-positive cells were negatively selected and further separated via positive selection for CD16. To confirm the separation technique, an aliquot of each subset from representative cases was analyzed by three-color FACSCaliber flow cytometer (BD Biosciences, San Jose, California, USA) with monocyte, macrophage, and T-cell antibodies. The monocyte population was confirmed to be >95% CD14. DNA from CD14+/CD16+ and CD14− subsets were analyzed for HIV DNA to quantify proviral DNA in PBMC subsets.
Statistical analysis
Statistical analyses were performed combining older and younger groups into one dataset. All tests of hypotheses used only the participants classified as HAD or as cognitively normal. Participants classified as nonsyndromic neuropsychologically abnormal or as having HIV-associated minor cognitive motor disorder were excluded. We used logistic regression to examine the independent effect of HIV DNA on HAD compared to normal cognition (NC) in a univariate model and then in a multivariate model that controlled for the effects of VL, CD4 cell count, duration of infection, HAART, age, education, and ethnicity [38]. We then repeated these analyses in the subset of individuals without detectable VL. Analyses were conducted using SAS 8.2 (SAS, Cary, North Carolina, USA).
Results
The demographic constitution of the cohort used in this study is summarized in Table 1. The quality and quantity of DNA were adequate from all of the specimens. The distributions of HIV DNA were skewed, as reflected in the standard deviations and differences between mean and median HIV DNA values (Fig. 1, Table 2).
Table 1.
Demographic data of the study population (n = 49).
| Age (years) [mean (SD); range] | 45.22 (10.67); 43.07 |
| Years of education | 14.35 (2.57); 16.00 |
| Ethnicity (%) | |
| Caucasian | 51 |
| Asian/Pacific Islander | 37 |
| Other | 12 |
| Sex | |
| Male | 84 |
| Female | 16 |
Fig. 1. Box plots of HIV DNA.
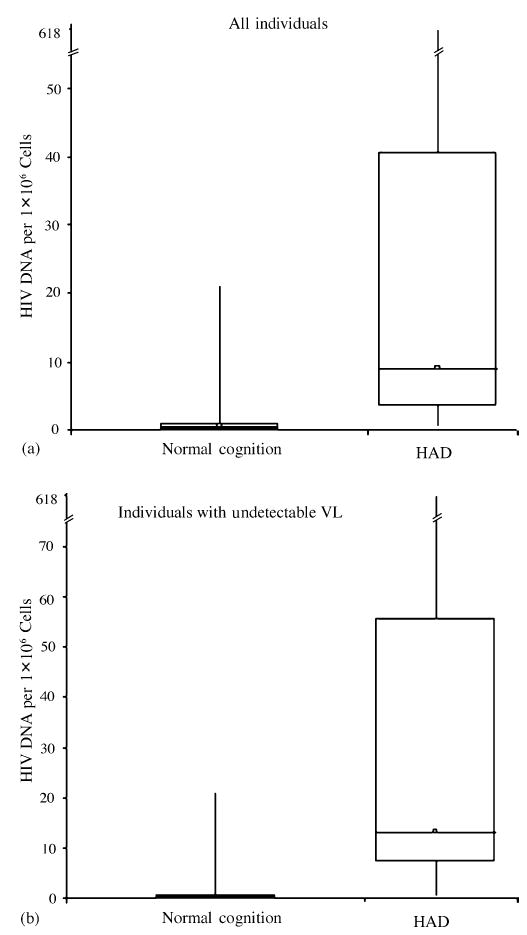
(a) HIV DNA of all individuals (n = 49) with NC and HAD. (b) Similar plot of HIV DNA of individuals with undetectable plasma viral levels (n = 24). Both plots demonstrate the skewed distribution of HIV DNA while showing the significant difference between the medians when comparing individuals with NC to those with HAD.
Table 2.
Parameters by diagnostic category.
| Diagnostic category
|
|||
|---|---|---|---|
| Normal cognition (n = 22) | HAD (n = 27) | Odds ratioa (P) | |
| All samples (n = 49) | |||
| HIV DNA (copies/1 × 106 PBMC) | |||
| Median (IQR) | 0.49 (0.89) | 9.11 (37.20) | 2.83 (<0.001) |
| Mean (SD) | 2.38 (5.63) | 42.9 (118) | |
| CD4 cell count (× 106/l) | |||
| Median (IQR) | 519 (335) | 287 (254) | |
| Mean (SD) | 482 (213) | 382 (340) | |
| Samples with undetectable viral load (n = 24) | (n = 13) | (n = 11) | 2.76 (<0.01) |
| HIV DNA (copies/1 × 106 PBMC) | |||
| Median (IQR) | 0.27 (0.84) | 13.20 (48.58) | |
| Mean (SD) | 1.98 (5.72) | 50.4 (181) | |
| CD4 cell count (× 106/l) | |||
| Median (IQR) | 541 (209) | 491 (884) | |
| Mean (SD) | 510 (216) | 613 (427) | |
| Samples with detectable viral load (n = 25) | (n = 9) | (n = 16) | |
| HIV DNA (copies/1 × 106 PBMC) | |||
| Median (IQR) | 0.64 (0.86) | 7.47 (23.46) | |
| Mean (SD) | 2.95 (0.86) | 17.1 (21.4) | |
| CD4 cell count (× 106/l) | |||
| Median (IQR) | 496 (331) | 210 (146) | |
| Mean (SD) | 442 (215) | 224 (116) | |
Odds ratio in a univariate logistic regression model with HIV-1-associated dementia (HAD) vs. normal cognition as the outcome. The significance remained after controlling for viral load, CD4 cell count, highly active antiretroviral therapy, duration of infection, education, age, and ethnicity. PBMC, Peripheral blood mononuclear cells; IQR, interquartile range.
Individuals with HAD had a median [interquartile range (IQR)] of 9.11 (37.20) HIV DNA per 1 × 10⁶ PBMC compared to 0.49 (0.89) HIV DNA per 1 × 10⁶ PBMC in individuals with NC (Table 2). In an unadjusted logistic regression model, the association of HIV DNA with HAD resulted in an odds ratio (OR) of 2.83 (IQR, 1.57–5.08; P < 0.001). The analyses were repeated after controlling for VL, CD4 cell count, HAART (71% of the participants were on HAART), duration of infection, education, age, and ethnicity which continued to show significance (P < 0.01). To evaluate the possibility that these findings were driven primarily by a few participants with very high HIV DNA values, we excluded the participants with the five highest values. This did not substantially change our results. We repeated the univariate analysis in the subset of individuals who had undetectable VL (HAD, 11; NC, 13) to determine whether the effect we observed was attributable to plasma VL. This also did not substantially change the results (OR, 2.76; IQR, 1.28–5.94; P < 0.01) (Table 2 and Fig. 1).
Of particular interest were two individuals with HAD who had relatively high HIV DNA and undetectable VL: 114 and 618 HIV DNA per 1 × 10⁶ PBMC. In an attempt to understand potential differences in these two individuals, analyses were performed on these two, and three other specimens, to ascertain HIV DNA in subsets of PBMC. PBMC from the five individuals (three with HAD, including the two with highest HIV DNA per 1 × 10⁶ PBMC, and two individuals with NC) were obtained and separated into CD14/CD16 and CD14-negative subsets. A representative flowcytometer plot is shown in Fig. 2 where 11–15% of the monocytes demonstrate CD14/CD16 phenotype. The CD14+/ CD16− subset was not recovered. HIV DNA was measured from each of the retained subsets (Table 3). From the two individuals with relatively high HIV DNA in PBMC, the HIV DNA per 1 × 10⁶ PBMC was the highest in the CD14/CD16 subset (activated M/MΦ) compared to the CD14-negative subset. By flow cytometry, the CD14-negative subset included CD4 T cells. The number of cells lysed from the isolated subsets used to obtain DNA varied depending on the total number of cells originally obtained, ranging from 30 000 to 500 000. Therefore, the HIV DNA per 1 × 10⁶ PBMC was extrapolated from the number of cells used to isolate DNA for each of the specimens. For low levels of HIV DNA (below 1 copy number per million cells), such as the CD14-negative subsets in Table 3, the values were extrapolated based on the standard curves generated by the iCycler IQ Software Program, version 3.0 (BioRad). Representative graphs of the β-globin and HIV-1 PCR standard curves and unknown samples are shown in Fig. 3, as described previously [32]. From the β-globin and HIV-1 PCR standard curves, the equivalent cell number and HIV-1 copy number, respectively, are calculated for each unknown specimen. The ratio of HIV DNA copy number per 1 × 10⁶ cells is then acquired. At the lower limits of the standard curves, if limited amount of a specimen is available, the IQ Software Program extrapolated the HIV DNA copy number per 1 × 10⁶ cells, which assumes a linear pattern.
Fig. 2. Representative immunofluorescence analysis of CD14/CD16 subset.
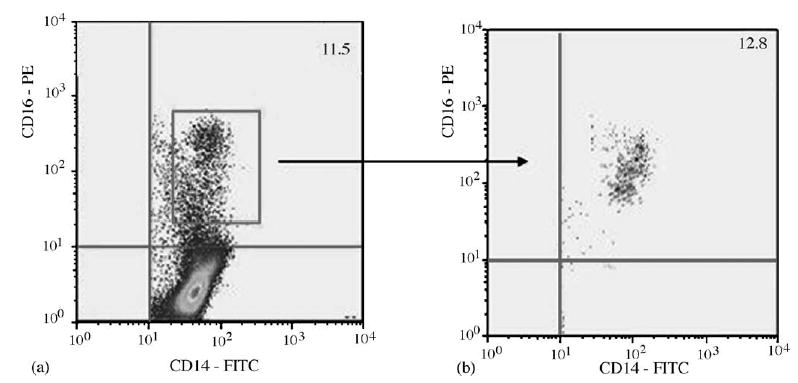
Dot plot of the purified monocytes (a), which were analyzed prior to CD16 isolation (b). PE, Phycoerythrin; FITC, fluorescein isothiocyanate.
Table 3.
HIV DNA in peripheral blood mononuclear cell (PBMC) subsets.
| HIV DNA of the sorted cells (copies/1 × 106 cells)
|
|||||||
|---|---|---|---|---|---|---|---|
| Patient | Neurocognitive status | White blood cell count (× 109/l) | Lymphocytes, monocytes (%) | CD4 cell count (× 106/l) | PBMC HIV DNA (copies/1 × 106 cells) | CD14+/CD16+ | CD14− |
| 1 | HAD | 6.6 | 43, 5 | 1249 | 114 | 110 | 0.5 |
| 2 | HAD | 6.7 | 38, 5 | 1171 | 618 | 503 | 0.01 |
| 3 | HAD | 4.2 | 37, 6 | 666 | 7 | 5 | 1 |
| 4 | Normal | 6.3 | 26, 5 | 278 | 2 | 0.3 | 1 |
| 5 | Normal | 4.8 | 30, 6 | 384 | 0.3 | 0.5 | 0.4 |
PBMC, Peripheral blood mononuclear cells; HAD, HIV-1-associated dementia.
Fig. 3. Representative real-time PCR standard curves with unknown examples.

Unknown samples were assayed using β-globin (a) and HIV-1 (b) primers. Samples falling within the standard curve (a) and samples less than the lower limits of the standard curve (b) were analyzed with the iCycler IQ Software Program (BioRad). Samples falling below the lower limits of the standard curve are extrapolated for HIV DNA copy number per million assuming a linear relationship.
Discussion
The value of proviral DNA levels to assess HIV-1 treatment status has been previously reported, but its utility as a prognostic marker for HAD has not been studied [35,39–42]. While HAART does decrease HIV DNA, the rate of decline is generally lower than its effect on plasma VL [43,44]. HIV DNA plays a role in M/MΦ viral persistence and the levels observed in M/MΦ are generally higher than those found in CD4 lymphocytes [40,45]. In the current study, data are presented that suggest circulating HIV DNA may be an important link in the pathogenesis of HAD. Furthermore, an exploratory evaluation suggests that the greatest burden may be among the CD14/CD16 subsets. It is particularly interesting that the correlation of HAD with circulating HIV DNA remained significant among individuals with undetectable VL, further underscoring that circulating HIV DNA may be involved in pathways leading to HAD.
Neither being treated with HAART, nor achieving undetectable VL, excludes the diagnosis of HAD, as shown by us and others [5,12,24]. While previous studies have shown a variable relationship between HIV DNA level and progression of HIV disease status, we believe the current study is the first to report a link between circulating proviral DNA and HAD [41,46–49]. Our findings are consistent with a model in which M/MΦ harboring HIV DNA are involved in the pathogenesis of HAD. Several mechanisms have been proposed by which M/MΦ might synergistically impact HAD including monocyte trafficking, involvement of perivascular macrophages, and secretion of neurotoxic substances by M/MΦ [2,5,50–56]. This may be partially explained by presence of HIV DNA in M/MΦ. We acknowledge several limitations to the current study, including the inability to confirm that these results are specific to M/MΦ in all individuals with HAD. While an intriguing association was observed suggesting an association between HIV DNA and activated M/MΦ, we were not able to definitively confirm this relationship due to limited specimens. Additionally, the data were obtained by extrapolating and normalizing HIV DNA copy number per 1 × 10⁶ million cells. Therefore, future analyses could benefit by using a more sensitive assay. In the limited subset of patients analyzed, the highest HIV DNA copy number was found within the CD14/CD16 cells and not within the T-cell compartment.
We recognize that while these patients have higher HIV DNA copy numbers in M/MΦ compared to CD4 T cells, the total CD4 counts are also high, therefore the total HIV DNA burden may be significant in these cells. While we have not conclusively shown that the high HIV DNA copy numbers are primarily due to CD14/CD16 monocytes, we feel that our results are highly suggestive and deserve further evaluation. In-depth quantitative studies on suspected target cells would provide insight on the role that proviral DNA plays in the pathogenesis of HAD.
In summary, these data indicate that circulating proviral DNA may be significantly elevated in HAD when compared to HIV-1-seropositive patients with normal cognition, even after controlling for plasma HIV-1 RNA loads. Our future work will determine if proviral DNA represents a sensitive marker to identifying HIV-1-infected individuals at risk for developing HAD or HAD progression; these findings could have therapeutic or prognostic implications.
Acknowledgments
The authors would like to thank M. Cho, E. Eisenhardt, D. Sapalo, D. Troelstrup, and B. Yamashiro for their technical assistance as well as Y. Liu from Johns Hopkins University for technical advice. The authors would also like to thank and acknowledge the participants within the Hawaii Aging with HIV Cohort for their unrelenting support and commitment.
Footnotes
Sponsorship: The work was supported in part by: Neuro AIDS Specialized Neurosciences Research Program U54NS43049, NINDS; R21MH69173, NIMH, NINDS; Research Centers in Minority Institutions G12RR03061, NCRR; and U01A134853.
References
- 1.Gartner S. HIV infection and dementia. Science. 2000;287:602–604. doi: 10.1126/science.287.5453.602. [DOI] [PubMed] [Google Scholar]
- 2.Major Eo, Rausch D, Marra C, Clifford D. HIV-associated dementia. Science. 2000;288:440–442. doi: 10.1126/science.288.5465.439d. [DOI] [PubMed] [Google Scholar]
- 3.Ryan LA, Cotter RL, Zink WE, 2nd, Gendelman HE, Zheng J. Macrophages, chemokines and neuronal injury in HIV-1-associated dementia. Cell Mol Biol (Noisy-le-Grand) 2002;48 :137–150. [PubMed] [Google Scholar]
- 4.Sacktor N, McDermott MP, Marder K, Schifitto G, Selnes OA, McArthur JC, et al. HIV-associated cognitive impairment before and after the advent of combination therapy. J Neurovirol. 2002;8:136–142. doi: 10.1080/13550280290049615. [DOI] [PubMed] [Google Scholar]
- 5.McArthur JC, Haughey N, Gartner S, Conant K, Pardo C, Nath A, et al. Human immunodeficiency virus-associated dementia: an evolving disease. J Neurovirol. 2003;9:205–221. doi: 10.1080/13550280390194109. [DOI] [PubMed] [Google Scholar]
- 6.Grassi MP, Perin C, Clerici F, Zocchetti C, Cargnel A, Mangoni A. Neuropsychological performance in HIV-1-infected drug abusers. Acta Neurol Scand. 1993;88:119–122. doi: 10.1111/j.1600-0404.1993.tb04202.x. [DOI] [PubMed] [Google Scholar]
- 7.Hengge UR, Brockmeyer NH, Esser S, Maschke M, Goos M. HIV-1 RNA levels in cerebrospinal fluid and plasma correlate with AIDS dementia. AIDS. 1998;12:818–820. [PubMed] [Google Scholar]
- 8.Childs EA, Lyles RH, Selnes OA, Chen B, Miller EN, Cohen BA, et al. Plasma viral load and CD4 lymphocytes predict HIV-associated dementia and sensory neuropathy. Neurology. 1999;52:607–613. doi: 10.1212/wnl.52.3.607. [DOI] [PubMed] [Google Scholar]
- 9.Robertson K, Fiscus S, Kapoor C, Robertson W, Schneider G, Shepard R, et al. CSF, plasma viral load and HIV associated dementia. J Neurovirol. 1998;4:90–94. doi: 10.3109/13550289809113485. [DOI] [PubMed] [Google Scholar]
- 10.Stankoff B, Calvez V, Suarez S, Bossi P, Rosenblum O, Conquy L, et al. Plasma and cerebrospinal fluid human immunodefi-ciency virus type-1 (HIV-1) RNA levels in HIV-related cognitive impairment. Eur J Neurol. 1999;6:669–675. doi: 10.1046/j.1468-1331.1999.660669.x. [DOI] [PubMed] [Google Scholar]
- 11.Langford TD, Letendre SL, Larrea GJ, Masliah E. Changing patterns in the neuropathogenesis of HIV during the HAART era. Brain Pathol. 2003;13:195–210. doi: 10.1111/j.1750-3639.2003.tb00019.x. [DOI] [PMC free article] [PubMed] [Google Scholar]
- 12.Albright AV, soldan SS, Gonzalez-Scarano F. Pathogenesis of human immunodeficiency virus-induced neurological disease. J Neurovirol. 2003;9:222–227. doi: 10.1080/13550280390194073. [DOI] [PubMed] [Google Scholar]
- 13.Lawrence DM, Major EO. HIV-1 and the brain: connections between HIV-1-associated dementia, neuropathology and neuroimmunology. Microbes Infect. 2002;4:301–308. doi: 10.1016/s1286-4579(02)01542-3. [DOI] [PubMed] [Google Scholar]
- 14.Pulliam L, Gascon R, Stubblebine M, Mcguire D, McGrath MS. Unique monocyte subset in patients with AIDS dementia. Lancet. 1997;349:692–695. doi: 10.1016/S0140-6736(96)10178-1. [DOI] [PubMed] [Google Scholar]
- 15.Fischer-Smith T, Croul S, Sverstiuk AE, Capini C, L’Heureux D, Regulier EG, et al. CNS invasion by CD14+/CD16+peripheral blood-derived monocytes in HIV dementia: perivascular accumulation and reservoir of HIV infection. J Neurovirol. 2001;7:528–541. doi: 10.1080/135502801753248114. [DOI] [PubMed] [Google Scholar]
- 16.Nukuna A, Gendelman HE, Limoges J, Rasmussen J, Poluek-tova L, Ghorpade A, et al. Levels of human immunodeficiency virus type 1 (HIV-1) replication in macrophages determines the severity of murine HIV-1 encephalitis. J Neurovirol. 2004;10 (Suppl 1):82–90. doi: 10.1080/753312757. [DOI] [PubMed] [Google Scholar]
- 17.Bagasra O, Lavi E, Bobroski L, Khalili K, Pestaner JP, Tawadros R, et al. Cellular reservoirs of HIV-1 in the central nervous system of infected individuals: identification by the combination of in situ polymerase chain reaction and immunohisto-chemistry. Aids. 1996;10:573–585. doi: 10.1097/00002030-199606000-00002. [DOI] [PubMed] [Google Scholar]
- 18.Collman RG, Perno CF, Crowe SM, Stevenson M, Montaner LJ. HIV and cells of macrophage/dendritic lineage and other non-T cell reservoirs: new answers yield new questions. J Leukoc Biol. 2003;74:631–634. doi: 10.1189/jlb.0703357. [DOI] [PubMed] [Google Scholar]
- 19.Sonza S, Mutimer HP, Oelrichs R, Jardine D, Harvey K, Dunne A, Purcell DF, et al. Monocytes harbour replication-competent, non-latent hiv-1 in patients on highly active antiretro-viral therapy. AIDS. 2001;15:17–22. doi: 10.1097/00002030-200101050-00005. [DOI] [PubMed] [Google Scholar]
- 20.Lewin SR, Kirihara J, Sonza S, Irving L, Mills J, Crowe SM. HIV-1 DNA and mRNA concentrations are similar in peripheral blood monocytes and alveolar macrophages in HIV-1-infected individuals. AIDS. 1998;12:719–727. doi: 10.1097/00002030-199807000-00008. [DOI] [PubMed] [Google Scholar]
- 21.Valcour V, Shikuma C, Shiramizu B, Watters M, Poff P, Selnes O, et al. Higher frequency of dementia in older HIV+ individuals. the Hawaii Aging with HIV Cohort Neurology. 2004;63:822–827. doi: 10.1212/01.wnl.0000134665.58343.8d. [DOI] [PMC free article] [PubMed] [Google Scholar]
- 22.Portegies P, Enting RH, De Gans J, Algra PR, Derix MM, Lange JM, et al. Presentation and course of AIDS dementia complex: 10 years of follow-up in Amsterdam, the Netherlands. AIDS. 1993;7:669–675. [PubMed] [Google Scholar]
- 23.Chiesi A, Vella S, Dally LG, Pedersen C, Danner S, Johnson AM, et al. Epidemiology of AIDS dementia complex in Europe. AIDS in Europe Study Group. J Acquir Immune Defic Syndr Hum Retrovirol. 1996;11:39–44. doi: 10.1097/00042560-199601010-00005. [DOI] [PubMed] [Google Scholar]
- 24.Dougherty RH, skolasky RL, Jr, mcarthur JC. Progression of HIV-associated dementia treated with HAART. AIDS Read. 2002;12:69–74. [PubMed] [Google Scholar]
- 25.Nomenclature and Research Case Definitions for Neurologic Manifestations of Human Immunodeficiency Virus-Type 1 (HIV-1) infection. Report of a Working Grup of the American Academy of Neurology AIDS task force. Neurology. 1991785:41–778. doi: 10.1212/wnl.41.6.778. [DOI] [PubMed] [Google Scholar]
- 26.Valcour VG, Shikuma CM, Watters MR, Sacktor NC. Cognitive impairment in older HIV-1-seropositive individuals: prevalence and potential mechanisms. AIDS. 2004;18:s79–s86. doi: 10.1097/00002030-200401001-00012. [DOI] [PMC free article] [PubMed] [Google Scholar]
- 27.Watters M, Poff P, Shiramizu B, Holck P, Fast K, Shikuma CM, et al. Symptomatic distal sensory polyneuropathy in HIV after age 50. Neurology. 2004;62:1378–1383. doi: 10.1212/01.wnl.0000120622.91018.ea. [DOI] [PubMed] [Google Scholar]
- 28.Maniatis T, Fritsch EF, Sambrook J. Molecular Cloning. A Laboratory Manual. Cold Spring Harbor: Cold Spring Harbor Laboratory; 1982.
- 29.Liu Y, Tang XP, Mcarthur JC, Scott J, Gartner S. Analysis of human immunodeficiency virus type 1 gp160 sequences from a patient with HIV dementia: evidence for monocyte traffick-ing into brain. J Neurovirol. 2000;6 (Suppl 1):S70–S81. [PubMed] [Google Scholar]
- 30.Saiki RK, Bugawan TL, Horn GT, Mullis KB, Erlich HA. Analysis of enzymatically amplified beta-globin and HLA-DQ alpha DNA with allele-specific oligonucleotide probes. Nature. 1986;324:163–166. doi: 10.1038/324163a0. [DOI] [PubMed] [Google Scholar]
- 31.Mack KD, Jin X, Yu S, Wei R, Kapp L, Green C, et al. HIV insertions within and proximal to host cell genes are a common finding in tissues containing high levels of HIV DNA and macrophage-associated p24 antigen expression. JAIDS. 2003;33:308–320. doi: 10.1097/00126334-200307010-00004. [DOI] [PubMed] [Google Scholar]
- 32.Shiramizu B, Gartner S, Cho M, Liu Y, Pyron N, Valcour V, et al. Assessment of HIV-1 DNA copies per cell by real-time polymerase chain reaction. Front Biosci. 2004;9:255–261. doi: 10.2741/1212. [DOI] [PubMed] [Google Scholar]
- 33.Ghosh MK, Kuhn L, West J, Semrau K, Decker D, Thea DM, et al. Quantitation of human immunodeficiency virus type 1 in breast milk. J Clin Microbiol. 2003;41:2465–2470. doi: 10.1128/JCM.41.6.2465-2470.2003. [DOI] [PMC free article] [PubMed] [Google Scholar]
- 34.Desire N, Dehee A, Schneider V, Jacomet C, Goujon C, Girard PM, et al. Quantification of human immunodeficiency virus type 1 proviral load by a taqman real-time PCR assay. J Clin Microbiol. 2001;39:1303–1310. doi: 10.1128/JCM.39.4.1303-1310.2001. [DOI] [PMC free article] [PubMed] [Google Scholar]
- 35.Zhao Y, Yu M, Miller JW, Chen M, Bremer EG, Kabat W, et al. Quantification of human immunodeficiency virus type 1 proviral DNA by using taqman technology. J Clin Microbiol. 2002;40:675–678. doi: 10.1128/JCM.40.2.675-678.2002. [DOI] [PMC free article] [PubMed] [Google Scholar]
- 36.Cann AJ, karn J. Molecular biology of HIV: new insights into the virus life-cycle. AIDS. 1989;3 (Suppl 1):S19–S34. [PubMed] [Google Scholar]
- 37.Simmonds P, Balfe P, Peutherer JF, Ludlam CA, Bishop JO, et al. Human immunodeficiency virus-infected individuals contain provirus in small numbers of peripheral mononuclear cells and at low copy numbers. J Virol. 1990;64:864–872. doi: 10.1128/jvi.64.2.864-872.1990. [DOI] [PMC free article] [PubMed] [Google Scholar]
- 38.Lachin J. Biostatistical Methods: The Assessment of Relative Risks New York: Wiley; 2002.
- 39.Katzenstein TL. Molecular biological assessment methods and understanding the course of the HIV infection. Apmis Suppl. 2003:1–37. [PubMed] [Google Scholar]
- 40.Garbuglia AR, Zaccarelli M, Calcaterra S, Cappiello G, Marini R, Benedetto A. Dynamics of viral load in plasma and HIV DNA in lymphocytes during highly active antiretroviral therapy (HAART): high viral burden in macrophages after 1 year of treatment. J Chemother. 2001;13:188–194. doi: 10.1179/joc.2001.13.2.188. [DOI] [PubMed] [Google Scholar]
- 41.Russell RR, Bowmer MI, Nguyen C, Grant MD. HIV-1 DNA burden in peripheral blood CD4+ cells influences disease progression, antiretroviral efficacy, and CD4+ T-cell restoration. Viral Immunol. 2001;14:379–389. doi: 10.1089/08828240152716628. [DOI] [PubMed] [Google Scholar]
- 42.Wood R, Dong H, Katzenstein DA, Merigan TC. Quantification and comparison of HIV-1 proviral load in peripheral blood mononuclear cells and isolated CD4−T cells. J Acquir Immune Defic Syndr. 1993;6:237–240. [PubMed] [Google Scholar]
- 43.Bruisten SM, Reiss P, Loeliger AE, van Swieten P, Schuurman R, Boucher CA, et al. Cellular proviral HIV type 1 DNA load persists after long-term RT-inhibitor therapy in HIV type 1 infected persons. AIDS Res Hum Retroviruses. 1998;14:1053–1058. doi: 10.1089/aid.1998.14.1053. [DOI] [PubMed] [Google Scholar]
- 44.Dickover RE, Donovan RM, Goldstein E, Cohen SH, Bolton V, Huth RG, et al. Decreases in unintegrated HIV DNA are associated with antiretroviral therapy in AIDS patients. J Acquir Immune Defic Syndr. 1992;5:31–36. [PubMed] [Google Scholar]
- 45.Calcaterra S, Cappiello G, di Caro A, Garbuglia AR, Benedetto A. Comparative analysis of total and integrated HIV-1 DNA in peripheral CD4 lymphocytes and monocytes after long treatment with HAART. J Infect. 2001;43:239–245. doi: 10.1053/jinf.2001.0875. [DOI] [PubMed] [Google Scholar]
- 46.Bieniasz PD, Ariyoshi K, Bourelly MA, Bloor S, Foxall RB, Harwood EC, et al. Variable relationship between proviral dna load and infectious virus titre in the peripheral blood mono-nuclear cells of HIV-1-infected individuals. AIDS. 1993;7 :803–806. doi: 10.1097/00002030-199306000-00007. [DOI] [PubMed] [Google Scholar]
- 47.Chevret S, Kirstetter M, Mariotti M, Lefrere F, Frottier J, Lefrere JJ. Provirus copy number to predict disease progression in asymptomatic human immunodeficiency virus type 1 infection. J Infect Dis. 1994;169:882–885. doi: 10.1093/infdis/169.4.882. [DOI] [PubMed] [Google Scholar]
- 48.Kumar R, Vandegraaff N, Mundy L, Burrell C, Li P. Evaluation of PCR-based methods for the quantitation of integrated HIV-1 DNA. J Virol Methods. 2002;105:233. doi: 10.1016/s0166-0934(02)00105-2. [DOI] [PubMed] [Google Scholar]
- 49.Ngo-Giang-Huong N, Deveau C, Da Silva I, Pellegrin I, Venet A, Harzic M, et al. Proviral HIV-1 DNA in subjects followed since primary HIV-1 infection who suppress plasma viral load after one year of highly active antiretroviral therapy. AIDS. 2001;15:665–673. doi: 10.1097/00002030-200104130-00001. [DOI] [PubMed] [Google Scholar]
- 50.Gendelman HE, Lipton SA, Tardieu M, Bukrinsky MI, Nottet HS. The neuropathogenesis of HIV-1 infection. J Leukoc Biol. 1994;56:389–398. doi: 10.1002/jlb.56.3.389. [DOI] [PubMed] [Google Scholar]
- 51.Gartner S, Liu Y. Insights into the role of immune activation in HIV neuropathogenesis. J Neurovirol. 2002;8:69–75. doi: 10.1080/13550280290049525. [DOI] [PubMed] [Google Scholar]
- 52.Price RW, Brew B, Sidtis J, Rosenblum M, Scheck AC, Cleary P. The brain in AIDS: central nervous system HIV-1 infection and AIDS dementia complex. Science. 1988;239:586–592. doi: 10.1126/science.3277272. [DOI] [PubMed] [Google Scholar]
- 53.Williams K, Schwartz A, Corey S, Orandle M, Kennedy W, Thompson B, et al. Proliferating cellular nuclear antigen expression as a marker of perivascular macrophages in simian immunodeficiency virus encephalitis. Am J Pathol. 2002;161:575–585. doi: 10.1016/S0002-9440(10)64213-7. [DOI] [PMC free article] [PubMed] [Google Scholar]
- 54.Sacktor N, Lyles RH, Skolasky R, Kleeberger C, Selnes OA, Miller EN, et al. HIV-associated neurologic disease incidence changes: Multicenter AIDS Cohort Study, 1990–1998. Neurology. 2001;56:257–260. doi: 10.1212/wnl.56.2.257. [DOI] [PubMed] [Google Scholar]
- 55.Anderson E, Zink W, Xiong H, Gendelman HE. HIV-1-associated dementia: a metabolic encephalopathy perpetrated by virus-infected and immune-competent mononuc-lear phagocytes. J Acquir Immune Defic Syndr. 2002;31 (Suppl 2):S43–S54. doi: 10.1097/00126334-200210012-00004. [DOI] [PubMed] [Google Scholar]
- 56.Conant K, Garzino-Demo A, Nath A, Mcarthur Jc, Halliday W, Power C, et al. Induction of monocyte chemoattractant protein-1 in HIV-1 Tat-stimulated astrocytes and elevation in AIDS dementia. Proc Natl Acad Sci USA. 1998;95:3117–3121. doi: 10.1073/pnas.95.6.3117. [DOI] [PMC free article] [PubMed] [Google Scholar]