

Abstract
Although the prognosis for patients with glioblastoma is poor, survival is variable, with some patients surviving longer than others. For this reason, there has been longstanding interest in the identi-fication of prognostic markers for glioblastoma. We hypothesized that specific histologic features known to correlate with malignancy most likely express molecules that are directly related to the aggressive behavior of these tumors. We further hypothesized that such molecules could be used as biomarkers to predict behavior in a manner that might add prognostic power to sole histologic observation of the feature. We reasoned that perinecrotic tumor cell palisading, which denotes the most aggressive forms of malignant gliomas, would be a striking histologic feature on which to test this hypothesis. We therefore used laser capture microdissection and oligonucleotide arrays to detect molecules differentially expressed in perinecrotic palisades. A set of RNAs (including POFUT2, PTDSR, PLOD2, ATF5, and HK2) that were differentially expressed in 3 initially studied, micro-dissected glioblastomas also provided prognostic information in an independent set of 28 glioblastomas that did not all have perinecrotic palisades. On validation in a second, larger independent series, this approach could be applied to other human glioma types to derive tissue biomarkers that could offer ancillary prognostic and predictive information alongside standard histopathologic examination.
Keywords: Glioma, Glioblastoma, Hypoxia, Necrosis, Prognosis
INTRODUCTION
In modern clinical oncology, histopathologic classification affects therapeutic decisions and predicts patient prognosis. Tumor diagnosis is based primarily on the observation and interpretation of particular microscopic features that enable classification and grading. In this manner, histologic appearances represent biologic processes; for example, the microscopic presence of mitotic figures shows cell division and implies more rapid growth. Over the past 2 decades, molecular biologic studies have improved our understanding of tumor formation and progression to the point that molecular approaches to tumor analysis have become both possible and practical. Witness, for example, the current diagnostic criteria for some hematologic and soft tissue malignancies requiring specific chromosomal translocations (1, 2). More recently, the advent of gene expression profiling has further contributed to tumor classification by expanding the number of molecules capable of being assayed and by shifting the emphasis to expressed molecules (3). Using microarray technologies, our group has demonstrated that gene expression-based classification of histologically challenging malignant gliomas correlates better with survival than histologic classification (4).
Nonetheless, histologic and molecular features are clearly interrelated, including in malignant gliomas (5, 6). Furthermore, given that histologic features are the result of distinct biologic events, it is highly likely that specific molecules expressed, in particular histologic regions, are directly related to underlying molecular changes in those areas. The identification of such molecules could be accomplished by expression profiling of the cells constituting those regions, by coupling expression analyses with laser-capture microdissection (LCM), and thereby linking gene expression data with histologic architecture (7). In other words, one could potentially derive information from subpopulations of tumor cells that would be missed in the analysis of bulk tumor samples. Finally, because gliomas are often regionally heterogeneous, interrogating subpopulations of cells should have a high likelihood of yielding distinct information from whole tumor lysate analyses. For these reasons, we hypothesized that expression profiling of specific histologic features could yield molecular biomarkers that could themselves provide prognostic information to complement straight histologic examination.
The prognosis for patients with glioblastoma is poor. Nonetheless, there is variability in prognosis, and there have been many attempts over the years to identify prognostic variables (8). For example, as is well known, the clinical parameter of patient age is an important prognostic factor (9). In addition, recent studies have used molecular approaches to distinguish tumors more likely related to short versus long survival (10).
The microscopic appearance of glioblastoma is variable, but one key diagnostic feature is necrosis. In many, but not all, cases, the necrosis elicits a unique pattern of tumor cell response known as palisading or “pseudopalisading” (11). Palisading consists of small, irregular regions of necrosis surrounded by dense accumulations of tumor cells; the tumor cells are more densely packed at the edge of the necrosis than in other regions of the tumor and thus appear to “palisade” around the necrotic zone. Extensive, careful recent work has investigated this histologic phenomenon and has demonstrated that these palisades represent a dynamic response to local hypoxic stresses (12, 13), the types of stresses that have been associated with clonal selection pressures in human tumors (14). In line with these data and the hypothesis described here, we postulated that this unique histologic feature may represent emerging, more aggressive cell populations and that markers generated from these cells could be used to predict which glioblastomas would follow a more rapid clinical course. To address this possibility, we used LCM to microdissect palisading cells surrounding necrosis, and compared their expression profile with that of nonpalisading tumor cells from nearby regions unassociated with necrosis. These differentially expressed RNAs in this particular histologic feature were then used to derive prognostic markers that could complement the standard histologic assessment of glioblastoma.
MATERIALS AND METHODS
Tumor Samples
All tumor samples were collected from Massachusetts General Hospital under an approved protocol from the Massachusetts General Hospital Institutional Review Board. Eighteen glioblastoma tumor samples with palisading around necrosis were collected. Three tumor samples were frozen tissues and stored at −80°C immediately after surgery. These 3 cases were selected by the 2 neuropathologists (SD and DNL) based on typical pseudopalisading changes, with some tumors having multiple regions of pseudopalisading necrosis within the same tumor. These tumors were densely cellular without extensive infiltration of normal brain. Fifteen cases were formalin-fixed, paraffin-embedded tumors. An independent set of 28 randomly selected glioblastomas with mRNA expression data and clinical data (4) was used for the survival analysis; 26 of these 28 samples had necrosis (2 had been diagnosed as glioblastoma based on the presence of micro-vascular proliferation without necrosis in accordance with the 2000 WHO criteria [11]). Of the 26 that had necrosis, 15 had classic palisades.
Laser-Capture Microdissection and RNA Isolation and Amplification
Frozen tissues were cut at 8 to 10 μm in a cryostat and the slides were stored at −80°C. Each case was laser-captured in triplicate for both palisading cells and nonpalisading tumor cells from different regions using the PixCell II LCM system (Arcturus Engineering, Mountain View, CA). Total RNA was isolated with the Picopure RNA Isolation kit (Arcturus Engineering) and 2-round amplification was performed using the RiboAmp RNA Amplification kit (Arcturus Engineering).
cDNA Microarray and Data Analysis
Three micrograms of amplified RNA that was demonstrated to be of high quality on an Agilent 2100 Bioanalyzer (Agilent Technologies, Palo Alto, CA) analysis was used for cDNA synthesis and subsequent biotin-labeling with the BioArray HighYield RNA Transcript Labeling kit (Life Sciences, Inc., Farmingdale, NY). Twenty micrograms of biotin-labeled RNA was fragmented and hybridized to Affymetrix HG-U133A Chips (Affymetrix Inc., Santa Clara, CA). Vector Xpression software (InforMax Inc., Frederick, MD) was used to identify differentially expressed transcripts. Raw expression values were normalized by linear scaling so that the mean array intensity was identical for all scans. To exclude background hybridization expression, a lower expression threshold was set at 20, resulting in 11,196 probe sets for subsequent analysis. These remaining 11,196 probe sets were then subjected to the standard 2-sample t-test using Vector Xpression for the identification of differentially expressed transcripts. Differentially expressed genes (unadjusted p < 0.01) were then subjected to functional analysis using Onto-Express (http://vortex.cs.wayne.edu/projects.html; in which p values were corrected automatically) and PathwayAssist Version 2.53 (Ariadne Genomics Inc., Rockville, MD). The complete list of 314 up- and 385 downregulated genes is available in Supplementary Information, Table 1 (http://research.neurosurgery.mgh.harvard.edu/louis). Expression values for a subset of these genes were reanalyzed using a mixed-effects model to adjust for within-tumor dependence. The within-tumor correlation was not significantly different from zero in all cases. All raw expression data has been deposited in the NCBI/GEO database (accession no. GSE2485).
Confirmation of Microarray Gene Expression Data
To validate our results at the cellular level, immunohistochemistry was performed on the 15 formalin-fixed, paraffin-embedded glioblastoma samples with palisading foci (see “Tumor Samples,” “Materials and Methods”). HSP70 (sc-24), ALDOA (sc-12061), and GRB10 (sc-13955) antibodies were purchased from Santa Cruz Biotechnology (Santa Cruz, CA) whereas HIG2 was provided by one of the authors (ND) and OLIG2 by Dr. Charles Stiles (Dana-Farber Cancer Institute). Sections were cut at 4 μm, deparaffinized, rehydrated, and incubated with fresh 0.5% H2O2 in methanol for 10 minutes at room temperature. Antigen retrieval for OLIG2 was performed by incubating slides in sodium citrate buffer at 99°C without boiling for 30 minutes. For all other antibodies, slides were boiled in sodium citrate buffer 3 times at 5 minutes in a microwave. Normal sera were applied for 30 minutes at room temperature and primary antibodies were incubated overnight at 4°C (HSP70 at 1:50; ALDOA, GRB10 and HIG2 at 1:100; and OLIG2 at 1:40000). After incubation with secondary antibodies at room temperature for 30 minutes, the Vectastatin Elite ABC kit (Vector Laboratories, Burlingame, CA) was used for detection. Positive and negative controls were used in each experiment for each antibody. The slides were initially read by one of the pathologists (SD) and then in a blinded fashion by the other pathologist (DNL).
Because commercial antibodies were not available for all genes of interest, we used semiquantitative polymerase chain reaction (PCR) to confirm microarray gene expression results for an additional gene, POFUT2. cDNA was synthesized from amplified RNA following the protocol outlined here. cDNAs were quantified before PCR analysis. β-actin was used as the reference gene and was amplified using primers 5′-GTCGA-CAGGCTCCGGCATG-3′ and 5′-CTCTTGCTCTGGGCCT CGTCGC-3′. POFUT2 was amplified using primers 5′-CT GGGAGTCCACCTGAGAAG-3′ and 5′- GTGGGTTCAAA CCTCACCAT-3′. The expected size of amplified fragments was 200 bp.
Analysis of Patient Survival
A subset of the differentially expressed genes (selected on the basis of unadjusted p < 0.001) identified as described here was used to probe expression data of 28 glioblastomas analyzed previously on Affymetrix U95Av2 chips (4); a total of 182 genes (69 up- and 113 downregulated; unadjusted p < 0.001) from the U133A chip corresponded to 171 probe sets (135 individual genes) on the U95Av2 chips. The complete list of corresponding probe sets is available in Supplementary Information, Table 2A (http://research.neurosurgery.mgh.harvard.edu/louis). Because investigation of the association of gene expression with survival was the primary goal of this study, a strict multiple testing adjustment was not applied at this first stage of screening. Furthermore, the microarray results from the first sample of 3 tumors were validated using immunohistochemistry and PCR in an independent set of 15 tumors. Clinical data for the 28 glioblastomas is correlated with raw expression data for the 171 probe sets in Supplementary Information, Table 2B (http://research.neurosurgery.mgh.harvard.edu/louis). A Cox regression model was used to identify which of these 171 probe sets yielded significant prognostic value (Supplementary Information, Table 3; http://research.neurosurgery.mgh.harvard.edu/louis).Apermu-tation test (10,000 permutations) was used in conjunction with the expression data from the entire chip to assess whether more probe sets were identified as being significantly associated with survival than would be expected if the 171 probe sets were chosen at random from the entire chip. Specifically, the labels of the 171 preselected probe sets were randomly permuted among all of the probe sets on the chip, and the proportions of genes associated with survival in each sample were compared. In addition, bivariate models were fit to adjust for age (as either a continuous or binary covariate dichotomized at its median value) or presence of pseudopalisades. Kaplan-Meier plots were generated with GraphPad Prism (version 3.02; GraphPad Software, San Diego, CA). In this analysis, 2 different error rates were examined and adjustments for multiple testing were applied. The family-wise error rate (FWER) was controlled using the maxT procedure (15) and the false discovery rate (FDR) was controlled using the q-value approach (16, 17). These procedures measure different errors and differ in their conservatism. Because they each provide evidence of the strength of the results, and thus each contributes to directing future study, we examined both. Although there were only 28 subjects in this study, time of death was available for 23, and the censored subjects had among the longest observation times, which made them informative as well. In addition, there was a high degree of variability in the gene expression values (75% of the standard deviations of the expression levels of the 171 genes were greater than 8.8). Thus, for a gene with standard deviation of 5, we anticipate having 80% power to detect a log hazard ratio of 0.12 (vs the null value of zero) using a 2-sided, 0.05 level Wald test based on a Cox regression model. For a gene with standard deviation of 10, we anticipate 80% power to detect a log hazard ratio of 0.06. Based on a 0.001 level test, we have 80% power to detect a log hazard ratio of 0.10 for a gene with standard deviation of 10 (18).
RESULTS
Laser-Capture Microdissection-Based Approach to Gene Expression Profiling
To address whether the expression pattern of RNA obtained from LCM and linear amplification accurately re-flects the starting RNA expression pattern, LCM was performed on a frozen tumor sample with tumor cells picked up randomly for analysis. Total RNA was isolated from the LCM material as well as from bulk frozen tissue. Evaluation with the Agilent 2100 Bioanalyzer showed that the total RNA from the bulk tissue as well as from LCM material was of high quality. We next captured 3 groups of 2,000 to 3,000 cells for RNA isolation. RNA both from LCM and bulk tissue were linearly amplified using T7-based linear RNA amplification. Using this approach, we generated more than 50 μg of aRNA, and these aRNA samples were hybridized to the Affymetrix Test 3 chips containing 312 probe sets. Comparing 3 samples from LCM materials, greater than 90% of positive transcripts were within a 2-fold variation range. Comparatively, approximately 90% of positive transcripts were within a 2-fold variation range between the samples from LCM materials and bulk tissue RNA. These results indicate our LCM-based approach accurately reflects the gene expression pattern of bulk tissue RNA and represents a reliable approach to gene expression profiling at the cellular level.
Gene Expression Profiling of Palisading Cells
To determine the most consistently up- or down-regulated genes in palisading cells, we used 3 frozen glioblastomas that had palisading changes. We used LCM to microdissect palisading cells surrounding necrosis separately from nonpalisading tumor cells distant from necrosis (termed “common” cells), with each tumor microdissected from the same palisading area in triplicate to result in 18 samples, 3 triplicates each of palisading and common cells (Fig. 1). To determine those genes that are consistently and differentially expressed between palisading cells and common tumor cells, we compared the gene expression profiles between these 2 populations. Transcripts that were differentially expressed between palisading cells and common tumor cells (unadjusted p < 0.01) were selected, yielding 314 up- and 385 down-regulated genes. (See Supplementary Information, Table 1, [http://research.neurosurgery.mgh.harvard.edu/louis] for complete gene list.)
FIGURE 1.
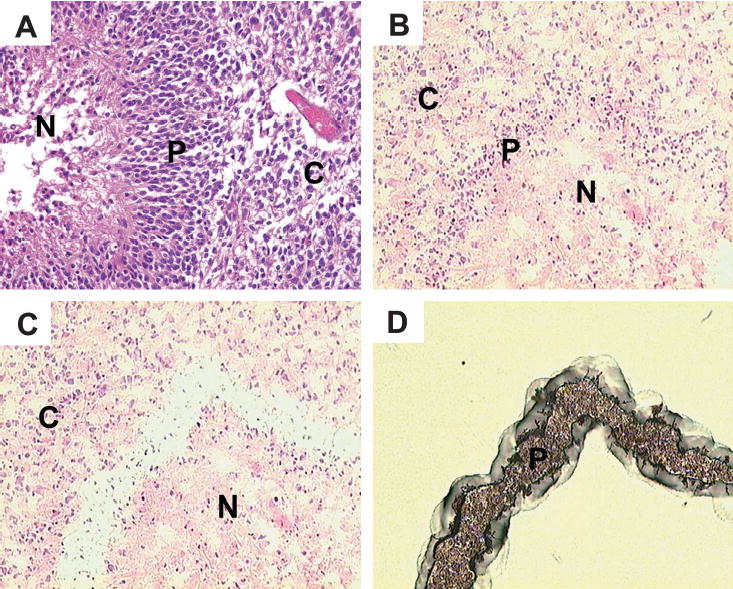
Laser-capture microdis-section (LCM) process. (A) Typical features of palisades in glioblasto-mas. (B) Frozen section of glioblas-toma with palisading necrosis before LCM. (C) Same section after capture of palisading cells. (D) Laser-captured palisading cells from the same section on the LCM cap. N, necrosis; P, palisading cells; C, “common” tumor cells (see text).
Five genes for which commercial antibodies were available were confirmed to be differentially expressed using immunohistochemistry. Four upregulated genes were markedly more positive in the palisading cells relative to the surrounding tumor cells; and a single downregulated gene was far more positive in the surrounding, common tumor cells than in the palisading cells. As shown in Figure 2, there were marked differences for HIG2 and OLIG2, with immunohistochemically detectable expression essentially restricted to palisading cells or common cells, respectively, in over 90% (14 of 15) of cases examined. For other proteins, HSP70, ALDOA, and GRB10, there was strong expression in palisades but expression in scattered common cells as well. For these proteins, differential expression could be seen in at least 50% of cases examined. A fifth upregulated gene was confirmed to be differentially expressed using semiquantitative RT-PCR, with a clear difference in POFUT2 expression between 3 sets of control cells and palisading cells (Fig. 2A).
FIGURE 2.
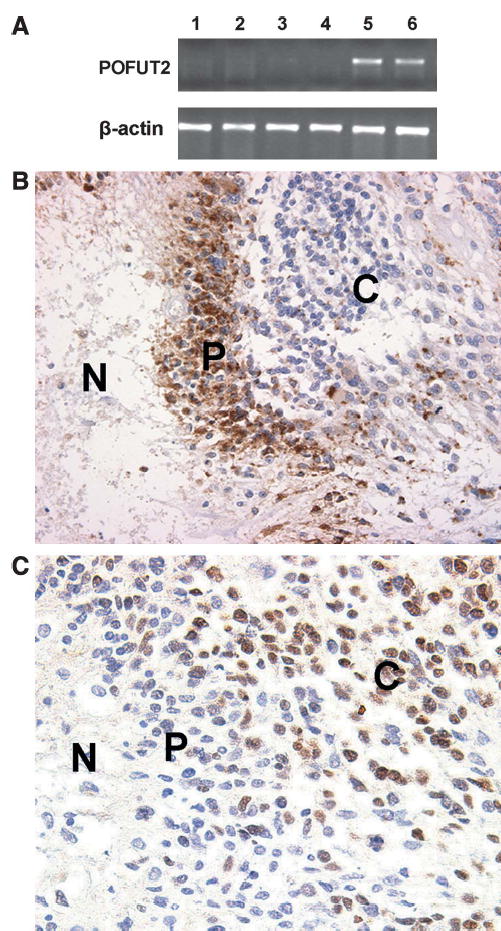
(A) Representative results of semiquantitative polymerase chain reaction. The top panel shows gene expression of POFUT2 and the bottom panel shows the β-actin control; the first 3 lanes are control cells and the remaining 3 lanes are pseudopalisading cells from the same case. Note upregulation in 2 of the 3 samples of palisading cells. (B) Immunohistochemistry for HIG2 expression. Most palisading cells show strong cytoplasmic staining compared with the “common” tumor cells. (C) Immunohistochemistry for OLIG2. Approximately half of the “common” tumor cells show nuclear staining but palisading cells are predominantly negative. N, necrosis; P, palisading cells; C, “common” tumor cells.
Differentially Expressed Transcripts and Upregulated Gene List Suggest Cellular Response to Hypoxic Environmental Conditions
We used 2 different software packages to determine the most likely pathways upregulated in the palisading cells. When both up- and downregulated transcripts were analyzed as a single, combined dataset, PathwayAssist 2.53 (Ariadne Genomics, Inc.) predicted a response to hypoxic environmental conditions. Within the upregulated transcripts, the Onto-Express analysis package (http://vortex.cs.wayne.edu/projects.html) identified “glycolysis” (GO: 0006096, adjusted p < 0.0001, gene number = 10) and “regulation of cell cycle” (GO: 0000074, adjusted p = 0.027, gene number = 12) as the 2 most prominent biologic processes, both of which could be cellular responses to hypoxia as an attempt to conserve energy and enhance survival (19–21). Moreover, VEGF was a key molecule from our data within the “regulation of cell cycle” category. VEGF has been widely investigated in various kinds of malignancies including glioblastoma (19, 20, 22, 23), and its expression has been shown by in situ hybridization to be highest in palisading cells (22); this result provides independent validation of our LCM-based gene expression data.
The “glycolysis”subgroup of biologic processes suggests increased metabolism in palisading cells. GAPDH (glyceral-dehyde-3-phosphate dehydrogenase), ALDOA (aldolase A), PKM2 (pyruvate kinase), and PGK1 (phosphoglycerate kinase 1) are glycolytic enzymes (19, 20, 24–26), whereas HK2 (hexokinase 2) phosphorylates glucose to produce glucose-6-phosphate, thus committing glucose to the glycolytic pathway (27). GLUT1 (SLC2A1, solute carrier family 2, member 1) is the most primitive type of glucose transporter across the blood–brain barrier, and GLUT3 (SLC2A3, solute carrier family 2, member 3) is responsible for the transport of glucose into neurons and glia (27–29). All of these genes are highly expressed in tumor cells in response to hypoxia, and their upregulation may represent metabolic adaptation of the palisading cells to the glucose deprivation that parallels hypoxia (20, 24–27).
Among upregulated transcripts, the Onto-Express analysis package identified the following categories as the most prominent molecular functions: vascular endothelial growth factor receptor binding (GO:0005172, adjusted p < 0.0001, gene number = 4); glyceraldehyde-3-phosphate dehydrogenase activity (GO:0004365, adjusted p < 0.0001, gene number = 3); oxidoreductase activity, acting on single donor with incorporation of molecular oxygen, incorporation of 2 atoms of oxygen (GO: 0016702, adjusted p = 0.0276, gene number = 3); and structural constituent of ribosome (GO:0003735, adjusted p = 0.0083, gene number = 10). In addition to VEGF and GAPDH, PLOD2 (procollagen hydroxylase 2), a member of the “oxidoreductase activity” category, is also known to be induced by hypoxia (19, 20, 30).
Prediction of Survival in Patients With Glioblastomas
These data suggest that palisading cells, in response to local microenvironmental stress, might be a source for the selection of clones that could underlie more aggressive behavior in malignant gliomas (31). Indeed, PathwayAssist showed proliferation, local contact, and motility as the top 3 cell processes, suggesting that palisading cells are associated with tumor progression and tumor invasion. Based on these results, we hypothesized that these differentially expressed genes could be of clinical relevance. We therefore used the top 182 differentially expressed genes (those genes significant at an unadjusted p < 0.001) identified in this study (analyzed on Affymetrix U133A chips) to investigate clinical significance in an independent series of 28 glioblastomas that had been analyzed previously on Affymetrix U95Av2 chips, a dataset for which clinical outcome data was available (4). Of our 182 differentially expressed genes, 171 corresponding probe sets (135 individual genes) were present on the U95Av2 chips (Supplementary Information, Table 2A; http://research.neuro-surgery.mgh.harvard.edu/louis). Cox regression models, with the expression level as the covariate, showed one of these genes to be marginally significantly associated with patient survival at the 0.05 level and 26 of these genes significantly associated with patient survival at a false discovery rate of 0.03 (17) (Supplementary Information, Table 3; http://research.neurosurgery.mgh.harvard.edu/louis). Five of them (POFUT2, PTDSR, PLOD2, ATF5, and HK2) could significantly dichotomize patient survival by median expression values. Survival curves for the 2 most significant genes (POFUT2 and PTDSR) are shown in Figure 3. The association of POFUT2 (protein-o-fucosyltransferase 2) with survival is marginally significant even after conservative adjustment for multiple testing using the maxT procedure (p = 0.0597). Based on a permutation test, there is only a 3% chance that the observed results could have arisen through random sampling. This association holds also when expression values are dichotomized according to their respective medians (p = 0.083). In contrast, the presence of perinecrotic palisades, the histologic feature itself, was not significantly associated with survival within these same patients (p = 0.94). The estimates of the hazard ratios associated with each gene remain essentially unchanged when multivariate models are fit with adjustment for the possible confounding by age and palisades.
FIGURE 3.
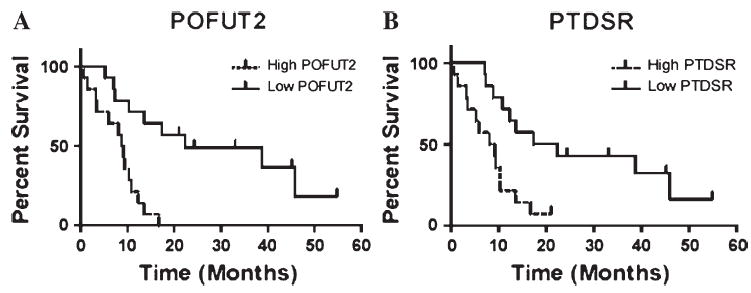
Glioblastoma patient survival based on prognostic markers. Survival curves are drawn with patient survival dichotomized by median expression values for illustration. Cox regression p values are given. (A)POFUT2 (protein-o-fuco-syltransferase 2; p = 0.0005; multiple testing maxT p value = 0.0597); (B)PTDSR (phosphatidylserine factor; p = 0.0021; multiple testing maxT p value = 0.2003).
DISCUSSION
The development of prognostic markers for glioblastoma patients has been a challenge to the neurooncology community, despite evidence that there are both longer and shorter surviving patients with this disease (8). Standard microscopic approaches have not yielded reproducible prognostic markers, and most directed immunohistochemical approaches have also not generated clinically useful markers (11). For example, although early studies noted an inverse relationship between patient survival and cell proliferation, larger, recent studies have not been able to demonstrate clear associations (32). At the genetic level as well, clear prognostic markers have not emerged for glioblastoma. For instance, a recent large study of epidermal growth factor receptor (EGFR) gene amplification, a common genetic event in glioblastoma, showed no association with glioblastoma patient survival (33). More global profiling approaches have suggested that combinations of genomic changes may correlate with survival, but these rely on methodologies such as comparative genomic hybridization that are not widely available (10). In addition, these global profiling approaches have not adequately represented intra-tumor heterogeneity, which could be a critical issue if sub-populations of tumor cells had differential growth or migratory properties (34). Given the need for prognostic markers in this disease (8), we sought to use a representative histologic feature to generate multiple candidate molecular biomarkers. This approach directs the biomarker search from a global, undirected screen to a profile based on a distinct biologic process. We hypothesized that expression profiling of a specific histologic feature could yield molecular biomarkers that would be more sensitive and powerful than the original histologic findings.
The approach that we propose amounts to a well-established tool of nonrandom sampling for increased efficiency. Preselection of genes from our first study on the basis of differential expression between palisading and nonpalisading samples, with subsequent use of those genes for analysis in our second study, is analogous to the use of case–control sampling for epidemiologic studies of rare diseases. This principle clearly holds as long as the histologic feature that guides the preselection of genes is somehow associated with survival. Palisading around necrosis (as opposed to necrosis without palisades, which is found in nearly all glioblastomas) was important to this study because this histologic feature is amenable to microdissection and represents an active cellular response. In addition, in series of gliomas of varying grades, the presence of palisading necrosis is an indicator of poor prognosis. However, this histologic feature is focal and can be missed in cerebral biopsies. This raised the possibility that molecules expressed in palisades could be found in aggressive tumors lacking classic histologic palisades. This possibility in turn raised the hypothesis that expression of such molecules would be a more accurate predictor of prognosis than the histologic feature, including within the single diagnostic category of glioblastoma. Importantly, as demonstrated in this study, not all palisading regions express these molecules and scattered “common” cells also express them; this finding emphasizes the need to sample multiple representative histologic regions within individual tumors as well as from independent samples to increase the likelihood of obtaining more universal, informative markers. Thus, our data demonstrates that, in the setting of a biologic rationale and a well-defined histologic feature, this approach may be well justified.
Laser-capture microdissection coupled with oligonucleotide arrays detected molecules differentially expressed in perinecrotic palisades. Palisading cells—and potentially other perinecrotic cells—have a distinct expression repertoire that includes genes relating to hypoxia, cell cycle regulation, and motility/invasion. The differentially expressed genes suggest that palisades represent a response to microenvironmental hypoxia, supporting the notion that palisades are in part caused by vessel regression and that the resultant hypoxia may induce new blood vessel formation (13, 35, 36). This hypothesis is further supported by the frequent observation of garlands of new blood vessels surrounding zones of necrosis (31). Given the unique histologic nature of palisades in glioblastomas, elucidating their molecular basis is likely to be significant in understanding the biology of glioblastoma. It is our hope that the publication of genes differentially expressed in palisades (some of which are briefly discussed in the “Results” section) will provide information for furthering this goal.
Several clinical studies have shown that the presence of hypoxic regions within tumors correlates with poor prognosis and increased risk of metastasis, suggesting that hypoxia, perhaps in association with tumor angiogenesis and cell migration, may also play a role in accelerating tumor progression in response to cellular stress (13, 20, 35, 37–39). The groups of hypoxia-inducible genes that we have identified in palisading cells could represent such a phenomenon. Consequently, markers generated from these cells could be of clinical significance in predicting patient survival. We therefore evaluated whether genes differentially expressed in palisades could offer prognostic information in a series of glioblastomas that did not necessarily demonstrate palisades. Indeed, our data demonstrated that 26 such genes were significantly associated with patient survival using the false discovery rate (FDR). The most significant one, POFUT2, was associated with survival using the more conservative family-wise error rate (FWER) and thus could be a useful marker to evaluate survival in glioblastoma patients. Validation of the association of this gene with survival in a second, larger independent dataset is necessary before it could be considered for clinical use.
Despite the significance of these genes in predicting the survival of patients with glioblastoma, their functions in tumor progression are not well defined. For example, POFUT2 is a potential protein fucosyltransferase and shares the same peptide motif with POFUT1, which is an essential component of Notch signaling pathways (40, 41). PTDSR may facilitate clearance of apoptotic cells (42). PLOD2 has been demonstrated to be involved in fibrotic processes and tissue remodeling (43). Recently, Chang et al proposed PLOD2 as one of the fibroblast core serum response genes associated with cancer progression (44). ATF5 blocks the differentiation of neural progenitor cells into neurons (45) and, as mentioned here, HK2 participates in the glycolytic pathway. Although it is too early to discuss the significance of these genes in glioblastomas, our results raise novel directions for further biologic investigation of glioblastoma.
Light microscopy has been and continues to be the mainstay of oncologic classification and grading. The present approach builds on histopathology by adding molecular parameters. Indeed, markers generated from analysis of specific cells predicted patient survival in a series of glioblastomas in a manner that added prognostic information to that gathered from sole histologic assessment. The combination of LCM and expression profiling in clinically annotated series should allow such advances in a wide variety of malignant gliomas, yielding prognostic or predictive markers that could be assessed through practical diagnostic approaches such as RT-PCR or immunohistochemistry. To reach this goal, these markers should be evaluated in a larger, prospective series of glioblastoma samples, especially in formalin-fixed, paraffin-embedded samples.
Supplementary Material
Acknowledgments
The authors thank Drs. Dennis C. Sgroi and Toshi Shioda for technical assistance and Charles Stiles for providing the Olig2 antibody. The authors also thank Purvesh Khatri for facilitating use of Onto-Express for data analysis.
Footnotes
Supported by NIH CA57683 and CA95616 and by a grant from the American Brain Tumor Association (in memory of George Kamberos).
References
- 1.Jaffe ES, Harris NL, Stein H, et al. World Health Organization Classification of Tumours of Haematopoietic and Lymphoid Tissues Lyon: WHO/IARC, 2001
- 2.Fletcher CDM, Unni KK, Mertens F. World Health Organization Classification of Tumours of Soft Tissue and Bone Lyon: WHO/IARC, 2002
- 3.Louis DN, Holland EC, Cairncross JG. Glioma classification: S molecular reappraisal. Am J Pathol. 2001;159:779–86. doi: 10.1016/S0002-9440(10)61750-6. [DOI] [PMC free article] [PubMed] [Google Scholar]
- 4.Nutt CL, Mani DR, Betensky RA, et al. Gene expression-based classification of malignant gliomas correlates better with survival than histological classification. Cancer Res. 2003;63:1602–7. [PubMed] [Google Scholar]
- 5.Sasaki H, Zlatescu MC, Betensky RA, et al. Histopathological–molecular genetic correlations in referral pathologist-diagnosed low-grade ‘oligo-dendroglioma. ’ J Neuropathol Exp Neurol. 2002;61:58–63. doi: 10.1093/jnen/61.1.58. [DOI] [PubMed] [Google Scholar]
- 6.McDonald JM, See S, Tremont I, et al. Prognostic impact of histology and 1p status in anaplastic oligodendroglioma. Cancer. 2005;104:1468–77. doi: 10.1002/cncr.21338. [DOI] [PubMed] [Google Scholar]
- 7.Ma XJ, Salunga R, Tuggle JT, et al. Gene expression profiles of human breast cancer progression. Proc Natl Acad Sci U S A. 2003;100:5974–79. doi: 10.1073/pnas.0931261100. [DOI] [PMC free article] [PubMed] [Google Scholar]
- 8.Louis DN, Posner JB, Jacobs T, et al. Report of the Brain Tumor Progress Review Group Bethesda, MD: National Institutes of Health, 2000
- 9.Burger PC, Green SB. Patient age, histologic features, and length of survival in patients with glioblastoma multiforme. Cancer. 1987;59:1617–25. doi: 10.1002/1097-0142(19870501)59:9<1617::aid-cncr2820590916>3.0.co;2-x. [DOI] [PubMed] [Google Scholar]
- 10.Burton EC, Lamborn KR, Feuerstein BG, et al. Genetic aberrations defined by comparative genomic hybridization distinguish long-term from typical survivors of glioblastoma. Cancer Res. 2002;62:6205–10. [PubMed] [Google Scholar]
- 11.Kleihues P, Burger PC, Collins VP, et al. Pathology and Genetics of Tumors of the Nervous System Lyon: WHO/IARC, 2000
- 12.Brat DJ, Van Meir EG. Vaso-occlusive and prothrombotic mechanisms associated with tumor hypoxia, necrosis, and accelerated growth in glioblastoma. Lab Invest. 2004;84:397–405. doi: 10.1038/labinvest.3700070. [DOI] [PubMed] [Google Scholar]
- 13.Brat DJ, Castellano-Sanchez AA, Hunter SB, et al. Pseudopalisades in glioblastoma are hypoxic, express extracellular matrix proteases, and are formed by an actively migrating cell population. Cancer Res. 2004;64:920–27. doi: 10.1158/0008-5472.can-03-2073. [DOI] [PubMed] [Google Scholar]
- 14.Graeber TG, Osmanian C, Jacks T, et al. Hypoxia-mediated selection of cells with diminished apoptotic potential in solid tumours. Nature. 1996;379:88–91. doi: 10.1038/379088a0. [DOI] [PubMed] [Google Scholar]
- 15.Westfall PH, Young SS. Resampling-Based Multiple Testing: Examples and Methods for P-value Adjustment New York: John Wiley & Sons, 1993
- 16.Benjamini Y, Hochberg Y. Controlling the false discovery rate: A practical and powerful approach to multiple testing. J Royal Stat Soc Series B (Methodological) 1995;57:289–300. [Google Scholar]
- 17.Storey JD, Tibshirani R. Statistical significance for genomewide studies. Proc Natl Acad Sci U S A. 2003;100:9440–45. doi: 10.1073/pnas.1530509100. [DOI] [PMC free article] [PubMed] [Google Scholar]
- 18.Hsieh FY, Lavori PW. Sample-size calculations for the Cox proportional hazards regression model with nonbinary covariates. Control Clin Trials. 2000;21:552–60. doi: 10.1016/s0197-2456(00)00104-5. [DOI] [PubMed] [Google Scholar]
- 19.Lal A, Peters H, St Croix B, et al. Transcriptional response to hypoxia in human tumors. J Natl Cancer Inst. 2001;93:1337–43. doi: 10.1093/jnci/93.17.1337. [DOI] [PubMed] [Google Scholar]
- 20.Denko NC, Fontana LA, Hudson KM, et al. Investigating hypoxic tumor physiology through gene expression patterns. Oncogene. 2003;22:5907–14. doi: 10.1038/sj.onc.1206703. [DOI] [PubMed] [Google Scholar]
- 21.Schmaltz C, Hardenbergh PH, Wells A, et al. Regulation of proliferation-survival decisions during tumor cell hypoxia. Mol Cell Biol. 1998;18:2845–54. doi: 10.1128/mcb.18.5.2845. [DOI] [PMC free article] [PubMed] [Google Scholar]
- 22.Shweiki D, Itin A, Soffer D, et al. Vascular endothelial growth factor induced by hypoxia may mediate hypoxia-initiated angiogenesis. Nature. 1992;359:843–45. doi: 10.1038/359843a0. [DOI] [PubMed] [Google Scholar]
- 23.Kunz MI, Ibrahim SM. Molecular responses to hypoxia in tumor cells. Mol Cancer. 2003;2:23. doi: 10.1186/1476-4598-2-23. [DOI] [PMC free article] [PubMed] [Google Scholar]
- 24.Salnikow K, Costa M, Figg WD, et al. Hyperinducibility of hypoxia-responsive genes without p53/p21-dependent checkpoint in aggressive prostate cancer. Cancer Res. 2000;60:5630–34. [PubMed] [Google Scholar]
- 25.Kress S, Stein A, Maurer P, et al. Expression of hypoxia-inducible genes in tumor cells. J Cancer Res Clin Oncol. 1998;124:315–20. doi: 10.1007/s004320050175. [DOI] [PubMed] [Google Scholar]
- 26.Zhong H, Simons JW. Direct comparison of GAPDH, beta-actin, cyclophilin, and 28S rRNA as internal standards for quantifying RNA levels under hypoxia. Biochem Biophys Res Commun. 1999;259:523–26. doi: 10.1006/bbrc.1999.0815. [DOI] [PubMed] [Google Scholar]
- 27.Shinohara Y, Hino M, Ishida T, et al. Growth condition-dependent synchronized changes in transcript levels of type II hexokinase and type 1 glucose transporter in tumor cells. Biochim Biophys Acta. 2001;1499:242–48. doi: 10.1016/s0167-4889(00)00125-7. [DOI] [PubMed] [Google Scholar]
- 28.Vannucci SJ, Seaman LB, Vannucci RC. Effects of hypoxia–ischemia on GLUT1 and GLUT3 glucose transporters in immature rat brain. J Cereb Blood Flow Metab. 1996;16:77–81. doi: 10.1097/00004647-199601000-00009. [DOI] [PubMed] [Google Scholar]
- 29.Akakura N, Kobayashi M, Horiuchi I, et al. Constitutive expression of hypoxia-inducible factor-1alpha renders pancreatic cancer cells resistant to apoptosis induced by hypoxia and nutrient deprivation. Cancer Res. 2001;61:6548–54. [PubMed] [Google Scholar]
- 30.Hofbauer KH, Gess B, Lohaus C, et al. Oxygen tension regulates the expression of a group of procollagen hydroxylases. Eur J Biochem. 2003;270:4515–22. doi: 10.1046/j.1432-1033.2003.03846.x. [DOI] [PubMed] [Google Scholar]
- 31.Louis DN. A molecular genetic model of astrocytoma histopathology. Brain Pathol. 1997;7:755–64. doi: 10.1111/j.1750-3639.1997.tb01062.x. [DOI] [PMC free article] [PubMed] [Google Scholar]
- 32.Chiesa-Vottero AG, Rybicki LA, Prayson RA. Comparison of proliferation indices in glioblastoma multiforme by whole tissue section vs tissue microarray. Am J Clin Pathol. 2003;120:902–8. doi: 10.1309/8UAU-KFK3-NBDM-VTNU. [DOI] [PubMed] [Google Scholar]
- 33.Ohgaki HD, Jourde P, Horstmann B, et al. Genetic pathways to glioblastoma: A population-based study. Cancer Res. 2004;64:6892–99. doi: 10.1158/0008-5472.CAN-04-1337. [DOI] [PubMed] [Google Scholar]
- 34.Okada Y, Hurwitz EE, Esposito JM, et al. Selection pressures of TP53 mutation and microenvironmental location influence epidermal growth factor receptor gene amplification in human glioblastomas. Cancer Res. 2003;63:413–16. [PubMed] [Google Scholar]
- 35.Blouw B, Song H, Tihan T, et al. The hypoxic response of tumors is dependent on their microenvironment. Cancer Cell. 2003;4:133–46. doi: 10.1016/s1535-6108(03)00194-6. [DOI] [PubMed] [Google Scholar]
- 36.Brat DJ, Kaur B, Van Meir EG. Genetic modulation of hypoxia induced gene expression and angiogenesis: Relevance to brain tumors. Front Biosci. 2003;8:100–16. doi: 10.2741/942. [DOI] [PubMed] [Google Scholar]
- 37.Bottaro DP, Liotta LA. Cancer: Out of air is not out of action. Nature. 2003;423:593–95. doi: 10.1038/423593a. [DOI] [PubMed] [Google Scholar]
- 38.Raza SM, Lang FF, Aggarwal BB, et al. Necrosis and glioblastoma: A friend or a foe? A review and a hypothesis. Neurosurgery. 2002;51:2–12. doi: 10.1097/00006123-200207000-00002. discussion 12–13. [DOI] [PubMed] [Google Scholar]
- 39.Raza SM, Fuller GN, Rhee CH, et al. Identification of necrosis-associated genes in glioblastoma by cDNA microarray analysis. Clin Cancer Res. 2004;10:212–21. doi: 10.1158/1078-0432.ccr-0155-3. [DOI] [PubMed] [Google Scholar]
- 40.Martinez-Duncker I, Mollicone R, Candelier JJ, et al. A new superfamily of protein-O-fucosyltransferases, alpha2-fucosyltransferases, and alpha6-fucosyltransferases: Phylogeny and identification of conserved peptide motifs. Glycobiology. 2003;13:1C–5C. doi: 10.1093/glycob/cwg113. [DOI] [PubMed] [Google Scholar]
- 41.Shi S, Stanley P. Protein O-fucosyltransferase 1 is an essential component of Notch signaling pathways. Proc Natl Acad Sci U S A. 2003;100:5234–39. doi: 10.1073/pnas.0831126100. [DOI] [PMC free article] [PubMed] [Google Scholar]
- 42.Fadok VA, Bratton DL, Rose DM, et al. A receptor for phosphatidylserine-specific clearance of apoptotic cells. Nature. 2000;405:85–90. doi: 10.1038/35011084. [DOI] [PubMed] [Google Scholar]
- 43.van der Slot AJ, Zuurmond AM, Bardoel AF, et al. Identification of PLOD2 as telopeptide lysyl hydroxylase, an important enzyme in fibrosis. J Biol Chem. 2003;278:40967–72. doi: 10.1074/jbc.M307380200. [DOI] [PubMed] [Google Scholar]
- 44.Chang HYS, Alizadeh JB, Sood AA, et al. Gene expression signature of fibroblast serum response predicts human cancer progression: Similarities between tumors and wounds. PLoS Biol. 2004;2:206–14. doi: 10.1371/journal.pbio.0020007. [DOI] [PMC free article] [PubMed] [Google Scholar]
- 45.Angelastro JM, Ignatova TN, Kukekov VG, et al. Regulated expression of ATF5 is required for the progression of neural progenitor cells to neurons. J Neurosci. 2003;23:4590–60. doi: 10.1523/JNEUROSCI.23-11-04590.2003. [DOI] [PMC free article] [PubMed] [Google Scholar]
Associated Data
This section collects any data citations, data availability statements, or supplementary materials included in this article.