

Abstract
During ATP synthesis, ATP synthase has to bind MgADP in the presence of an excess of MgATP. Thus, for efficient ATP synthesis it would be desirable if incoming substrate could be bound to a catalytic site with a preference for MgADP over MgATP. We tested three hypotheses predicting the existence of such a site. However, our results showed that, at least in absence of an electrochemical proton gradient, none of the three catalytic sites has a higher affinity for MgADP than for MgATP.
Keywords: ATP synthase, F1-ATPase, catalytic sites, high-affinity site, binding change, enzyme mechanism
1. INTRODUCTION
F1Fo-ATP synthase couples proton translocation through a membrane to ATP synthesis and hydrolysis. Coupling is achieved by a unique mechanism, subunit rotation. In Escherichia coli, the Fo subcomplex, which contains the proton channel, has a subunit stoichiometry of ab2c10; the F1 subcomplex, which contains the nucleotide binding sites, has a stoichiometry of α3β3γδε. The three catalytic nucleotide binding sites, where ATP synthesis and hydrolysis occur, are located on the three β subunits, at the interfaces with the adjacent α subunit. Virtually all current models for the mechanism of ATP synthesis and hydrolysis are variations of the “binding change” hypothesis ([1]; for recent reviews, see [2-6]).
One of the basic tenets of the binding change model is that the three catalytic sites have, at any given point of time, differences in their affinity for Mg2+-nucleotides. Upon rotation of the γ subunit by 120°, the three sites switch their affinities in a synchronized manner. Using a tryptophan genetically-engineered into the catalytic site as probe, the affinities could be measured [7-9]. In E. coli F1 as well as in the holoenzyme, F1Fo, MgATP binds to the high-affinity site 1 with a Kd1 in the nanomolar range, to the medium-affinity site 2 with a Kd2 of ∼ 1 μM, and to the low-affinity site 3 with Kd3 ≈ 30 μM. The overall MgADP binding affinities are similar or slightly lower [7,10] (see also Fig. 1 A).
Figure 1.
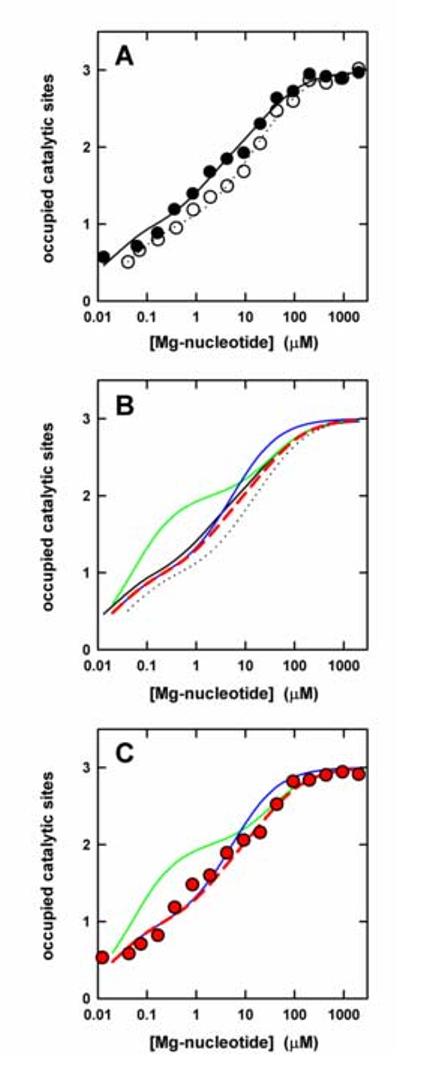
Binding of MgATP and MgADP to the catalytic sites of F1-ATPase. (A) Binding of MgATP (filled circles) and MgADP (open circles). Buffer was 50 mM Tris/H2SO4, 2.5 mM MgSO4, pH 8.0. Each data point represents the average of three independent measurements. The lines represent the theoretical binding curves giving the best fit to the data points; MgATP, solid line; MgADP, dotted line. Kd values are given in the text. (B) Theoretical binding curves (colored) for a 1:1 MgATP:MgADP mix under different binding scenarions as outlined in the text. For comparison, the binding curves for MgATP and MgADP from (A) are shown in black. (C) Experimental binding curve for a 1:1 MgATP:MgADP mix (red symbols). The theoretical binding curves for the mix from (B) are shown as colored lines.
This latter finding presents a potential problem for ATP synthesis. Under physiological conditions, there is a high (about 10-fold) excess of ATP over ADP [11,12]. If catalytic site affinities are similar or even lower for MgADP than for MgATP, empty sites will be filled preferentially by MgATP, thereby not allowing ATP synthesis to proceed. However, there are indications that in presence of an electrochemical proton gradient the site where incoming substrate is bound has indeed a higher affinity for MgADP than for MgATP. Although so far technical difficulties have not allowed direct nucleotide binding affinity measurements in ATP synthase under these conditions, the Ki for MgATP in ATP synthesis was found to be 5 mM [13], more than 100-fold higher than the Km for MgADP of 20 – 40 μM [13-15] (discussed in [16]).
On the other hand, some models suggest that a catalytic site with a higher affinity for MgADP than for MgATP might exist even in absence of an electrochemical proton gradient. This would present a significant experimental advantage, as it would allow to study this site without the complications associated with generating and maintaining a proton gradient. Furthermore, it would mean that a high-resolution structure of this site is probably already available, as all X-ray structures of the enzyme on hand (summarized in [6]) were obtained in absence of an electrochemical proton gradient. Given the overall similarity of the measured Kd values for MgADP and MgATP, a site with a higher affinity for MgADP would require that two sites had “reversed” affinities for the two nucleotide species, one a higher affinity for MgATP, the other a higher affinity for MgADP. And indeed, such scenarios have been postulated [17-20]. According to Boyer's suggestion [17,18], the site where catalysis occurs has high affinity for both nucleotide species, MgATP and MgADP, which implies that the medium-affinity site for MgADP has to be the low-affinity site for MgATP and vice versa. According to a different hypothesis, based on free energy simulations, the βDP site in the crystal structure [21] is the high-affinity site for MgADP (and has medium affinity for MgATP), while the βTP site is the high-affinity site for MgATP (and has medium affinity for MgADP) [19,20]. Thus, in the first scenario sites 2 and 3 would have “reversed” their affinities for MgATP versus MgADP, whereas in the second scenario it is sites 1 and 2 that would have reversed affinities..
A more recent crystal structure [22] suggested a molecular mechanism by which a catalytic site may be able to bind MgADP preferentially. In this structure, the high- and the medium-affinity sites were filled with the transition state analog MgADP. AlF4-, the low-affinity site with MgADP (plus sulfate). It was not possible to model MgATP into the low-affinity site because of steric clashes between the γ-phosphate and the side chain of αR3761 [22].
In this paper, we have investigated if a reversal in affinities for MgADP and MgATP occurred between sites 1 and 2, as suggested in [19,20], or between sites 2 and 3, as implied in [17,18], by comparing binding curves for the individual nucleotides with those for a 1:1 mixture of both nucleotides. If there were a reversal of affinities, then, in the concentration range approximating the Kd values of the affected sites, a 1:1 mixture should fill the sites to a greater extent than the individual single nucleotide species would. Furthermore, we tested if filling the first two sites with MgADP-fluoroaluminate (MgADP. AlFx) can indeed create a site that preferentially binds MgADP, as suggested in [22].
2. MATERIALS AND METHODS
Preparation of E. coli wild-type and βY331W mutant F1, set-up and evaluation of the fluorescence experiments, and determination of Kd values are described in [7,23,24]. All fluorescence experiments were performed on a spectrofluorometer type Fluorolog 3 (HORIBA Jovin Yvon, Edison, NJ), at 23 °C.
The theoretical curves for the binding of the MgATP/MgADP mixture were calculated using equation (1):
| (1) |
ν is the number of occupied catalytic binding sites. [D] and [T] are the concentrations of free (not enzyme-bound) MgADP and MgATP, respectively. It should be noted that this equation applies to any combination of concentrations of MgADP and MgATP, not only the 1:1 ratio used in the experiments described here. KdTn is the dissociation constant for MgATP at site n, KdDm is the dissociation constant for MgADP at the same (physical) site. Thus, if the high-affinity site, the medium-affinity site, and the low-affinity site are the same for both nucleotides, for n = 1, m = 1; for n = 2, m = 2; for n = 3, m = 3. If the high-affinity site for MgATP is the medium-affinity site for MgADP, and vice versa, for n = 1, m = 2; for n = 2, m = 1; for n = 3, m = 3. If the medium- and low-affinity sites are swapped between both nucleotides, for n = 1, m = 1; for n = 2, m = 3; for n = 3, m = 2.
3. RESULTS
The Trp fluorescence of E. coli βY331W mutant F1 [7] was used to measure the affinities of the three catalytic sites for MgATP and MgADP (Fig. 1 A). The resulting Kd values for MgATP were Kd1 = 16 nM, Kd2 = 1.5 μM, Kd3 = 29 μM; for MgADP, values of Kd1 = 41 nM, Kd2 = 6.0 μM, and Kd3 = 42 μM were obtained. These results are in agreement with previous determinations [7,23]. Using these Kd values, we calculated theoretical binding curves for a titration with a 1:1 mixture of MgADP and MgATP, assuming three different scenarios: (a) The high-affinity site, the medium-affinity site, and the low-affinity site are the same for both nucleotides (Fig. 1 B, red dashed curve); (b) the high-affinity site for MgATP is the medium-affinity site for MgADP, and vice versa (green curve); and (c), the medium-affinity site for MgATP is the low-affinity site for MgADP and vice versa (blue curve). From theoretical curves (b) and (c) it is obvious that, in the concentration range of the Kd values of the affected sites, the mixture fills these sites at a lower overall concentration than the individual nucleotides. Each nucleotide species has access to a site for which it has the higher affinity.
Fig. 1 C shows the results of the actual titration with the 1:1 MgATP:MgADP mix. It is evident that the data points follow closely the red theoretical line, which assumes that the three sites have the same affinity pattern for both nucleotides. No reversal in affinities for MgATP and MgADP occurs between sites.
In the MgATP binding experiments, at high ligand concentrations, steady-state catalysis occurs and a substantial amount of nucleotide on the catalytic sites is actually MgADP. This was shown using a Trp probe, βW148, that can differentiate between bound MgATP and MgADP [25]. However, experiments with enzyme in which hydrolysis was prevented by chemical modification [26] or mutagenesis [24,26,27] gave similar MgATP affinities, thus justifying to take the determined Kd values as representative for MgATP. In the case of the (noncovalent) inhibitor azide it could be demonstrated, using βW148 fluorescence, that the nucleotide species on the catalytic sites is indeed entirely MgATP [28].
Therefore, to rule out any doubt in our results, we repeated the MgATP and MgADP titrations in presence of 10 mM sodium azide (Fig. 2 A). As determined previously [28], the affinities at sites 1 and 2 for both nucleotides are somewhat higher in presence of azide. The Kd values were as follows: for MgATP, Kd1 = 2 nM, Kd2 = 0.3 μM, Kd3 = 55 μM; for MgADP, Kd1 = 4 nM, Kd2 = 2.3 μM, and Kd3 = 63 μM. The colored lines in Fig. 2 B show the theoretical curves for a 1:1 mixture, considering the same three scenarios as in Fig. 1 B. Due to the fact that in presence of azide the affinities of the three sites are spread out over a larger range, the differences between the theoretical curves are greater than in absence of azide. The individual data points (red dots) in Fig. 2 B represent the experimental results obtained with the 1:1 MgATP:MgADP mixture. As in absence of azide (Fig. 1 C), the experimental data points clearly fall onto the red theoretical line, demonstrating with even greater certainty that there is no affinity reversal between the sites.
Figure 2.
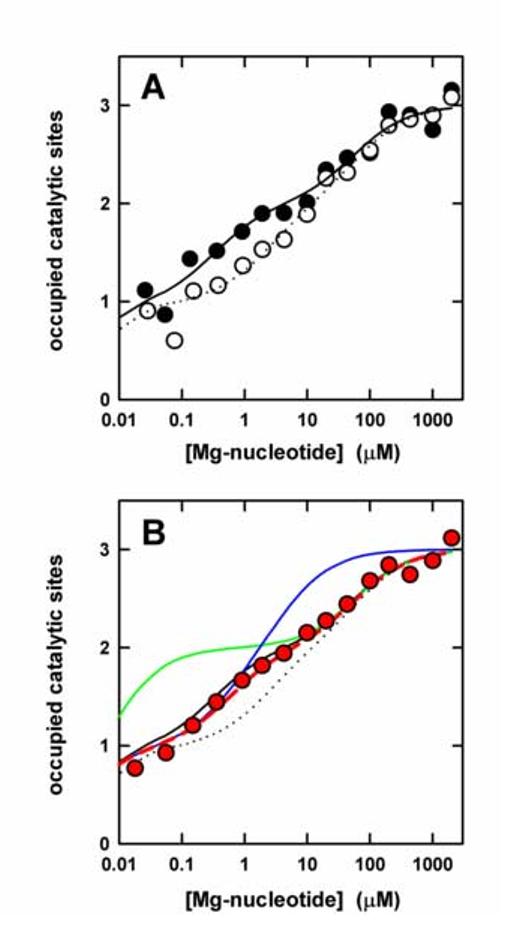
Binding of MgATP and MgADP to the catalytic sites of F1-ATPase in presence of azide. (A) Binding of MgATP (filled circles) and MgADP (open circles). Buffer contained 50 mM Tris/H2SO4, 10 mM azide, 2.5 mM MgSO4, pH 8.0. Each data point represents the average of three independent measurements. The lines represent the theoretical binding curves giving the best fit to the data points; MgATP, solid line; MgADP, dotted line. Kd values are given in the text. (B) The red symbols represent the experimental data points for a 1:1 MgATP:MgADP mix. The colored lines are theoretical binding curves for such a mix under the different binding scenarions described in the text to Fig. 1 B. The binding curves for MgATP and MgADP from (A) are shown in black.
A recent crystal structure suggested that one way to obtain a catalytic site with preference for MgADP over MgATP might be to bring the high- and medium-affinity sites into a transition-state-like state, using MgADP.AlFx as ligand. In the structure [22], the low affinity site was filled with MgADP. Access of MgATP to the site seemed to be blocked by the side chain of αR376, which occupied some of the space necessary to accommodate the γ-phosphate of the nucleotide.
We incubated βY331W mutant F1 for 30 min with 5 μM MgADP, either in presence of fluoroaluminate (1 mM AlCl3, 5 mM NaF) or in its absence. The fluorescence signal indicated (Fig. 3) that under these conditions in absence of fluoroaluminate 1.4 sites were filled, in its presence close to two (1.8), in agreement with previous data [22,24,29]. Then we titrated the resulting complexes with MgATP or the non-hydrolyzable MgATP analog MgAMPPNP. As can be seen in Fig. 3 A, MgATP was bound to the low-affinity binding sites of both complexes with very similar affinities (Kd3 = 40 μM), independent of absence or presence of fluoroaluminate. These values are comparable to the Kd3 of 29 μM measured in the MgATP titration shown in Fig. 1 A, without MgADP preincubation. Essentially the same result was obtained with MgAMPPNP, where a Kd3 of 55 μM was found with F1 preincubated with MgADP.AlFx, and a Kd3 of 57 μM with F1 preincubated only with MgADP (Fig. 3 B). The corresponding Kd3 values for MgADP are 40 μM in presence of fluoroaluminate and 47 μM in its absence [24]. Obviously, all these Mg-nucleotide binding affinities at site 3 fall within a rather small range, independent of the presence of MgADP.AlFx on sites 1 and 2 and independent of the presence of a γ-phosphate in the nucleotide. Therefore, bringing sites 1 and 2 into transition state conformation does not give the low-affinity site a preference for MgADP. In addition, the data obtained with sites 1 and 2 blocked by MgADP.AlFx confirm that site 3 is not involved in an affinity reversal; site 3 is clearly the low-affinity site for MgADP as well as for MgATP (or MgAMPPNP).
Figure 3.
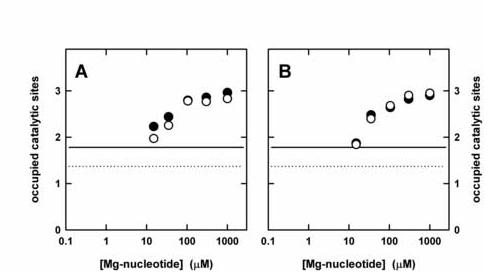
Binding of MgATP (A) or MgAMPPNP (B) to the catalytic sites of F1 after preincubation with MgADP (open circles) or MgADP-fluoroaluminate (filled circles). Buffer was 50 mM Tris/H2SO4, 2.5 mM MgSO4, pH 8.0. The horizontal lines indicate the number of occupied sites after preincubation with 5 μM MgADP (dotted line) or 5 μM MgADP-fluoroaluminate (solid line), before addition of MgATP or MgAMPPNP. The x-axis scale represents the total Mg-nucleotide concentration, i.e. MgADP (± fluoroaluminate) and MgATP (A) or MgADP (± fluoroaluminate) and MgAMPPNP (B).
4. DISCUSSION
In light of the high excess of ATP over ADP in the mitochondrion or in the bacterial cell under normal physiological conditions, it would be highly desirable for F1Fo-ATP synthase to have a catalytic site that preferentially binds MgADP over MgATP, to guarantee efficient ATP synthesis. We tested three hypotheses predicting the existence of such a site. However, our data disprove all three hypotheses. First, the catalytic site with a medium affinity for MgADP does not have a low affinity for MgATP, as implied in [17,18]. Second, the high-affinity site for MgATP has also the highest affinity for MgADP, in contrast to the model suggested in [19,20]. Third, converting sites 1 and 2 into a transition-state-like conformation by filling them with MgADP-fluoroaluminate does not reduce the affinity of site 3 for MgATP (or MgAMPPNP), let alone prevent binding of nucleoside triphosphates altogether, as suggested in [22].
The experiments presented here do certainly not exclude that under certain physiological or experimental conditions one of the catalytic sites might actually have a higher affinity for MgADP than for MgATP. Specifically, the affinity measurements were performed in absence of an electrochemical proton gradient. However, according to the three hypotheses tested here, the proposed catalytic site with a higher affinity for MgADP than for MgATP should not depend on the presence of a proton gradient. The hypotheses are either based on crystal structures of purified F1 [21,22], where obviously no proton gradient can be applied, or they list as support other experimental evidence that was obtained with purified F1 [30].
As mentioned in the Introduction, comparison of KM(MgADP) and Ki(MgATP) values for ATP synthesis suggest that in presence of an electrochemical proton gradient the site that binds incoming substrate indeed has a preference for MgADP over MgATP. Several mechanisms can be envisioned as to how the presence of a proton gradient might affect the relative affinities for MgATP and MgADP. A possible initial step would be a partial rotation of γ, driven by translocation of a single proton. This partial γ rotation could be the reversal of the second, smaller (40°) rotational substep observed during ATP hydrolysis [31,32], and lead to conformational changes in the catalytic binding site, perhaps transmitted via the DELSEED-loop in the C-terminal domain of β [33]. The conformational changes could create a phosphate binding pocket [6, 34]. Presence of Pi would prevent MgATP from binding to the site, while still allowing MgADP binding. An alternative suggestion would be a mechanism where, in presence of an electrochemical proton gradient, closure of the binding site could only occur with MgADP as ligand, not with MgATP, “perhaps controlled by a residue reaching into the binding space of the γ-phosphate” [16]. αR376 certainly remains a viable candidate for this function. The data presented here just show that binding of transition state analog MgADP.AlFx in both sites 1 and 2 simultaneously does not necessarily bring the side chain of αR376 into a conformation where it can prevent ATP binding to site 3. Finally, it should be noted that a role of the ε-subunit in regulation and differentiation of the pathways for ATP synthesis and ATP hydrolysis has been discussed [35,36].
An important open question regarding the catalytic sites is the identification of the high-affinity site in reference to the three catalytic sites, βDP, βTP, and βE (or βHC), seen by X-ray crystallography (see e.g. [21,22]). In all available structures the βDP site and the βTP site, which together must represent the high- and the medium-affinity sites, look so similar that it is difficult to rationalize differences in binding energy for Mg2+-nucleotide of 9 - 13 kJ/mol, as expected based on differences between the Kd1 and Kd2 values for MgATP, MgADP or MgITP [7,23,37]. Some arguments have been presented for βDP representing the high-affinity site [21,22,38,39]. On the other hand, taking into account the observed direction of rotation during MgATP hydrolysis [40] and the measured ratio of bound MgATP:MgADP during steady state-catalysis [25], it has to be postulated that βTP carries the high-affinity site (see e.g. [6,41]). Identification of the high-affinity site is crucial for further dissection of the catalytic mechanism, because in all likelihood only the high-affinity binding site performs catalysis at any given point of time.
5. ACKNOWLEDGMENTS
Supported by NIH grant GM071462. JW would like to thank Drs. Ina L. Urbatsch and Harry M. Weitlauf for their support during his stay at TTUHSC. The authors thank Dr. Alan E. Senior for helpful discussions.
Footnotes
E. coli numbering is used.
6. REFERENCES
- 1.Boyer PD. The binding-change mechanism of ATP synthesis. In: Lee CP, Schatz G, Ernster L, editors. Membrane Bioenergetics. Addison-Wesley; Waltham, MA: 1979. pp. 461–479. [Google Scholar]
- 2.Leslie AGW, Walker JE. Structural model of F1-ATPase and the implications for rotary catalysis. Philos. Trans. R. Soc. Lond. B Biol. Sci. 2000;355:465–471. doi: 10.1098/rstb.2000.0588. [DOI] [PMC free article] [PubMed] [Google Scholar]
- 3.Noji H, Yoshida M. The rotary machine in the cell, ATP synthase. J. Biol. Chem. 2001;276:1665–1668. doi: 10.1074/jbc.R000021200. [DOI] [PubMed] [Google Scholar]
- 4.Capaldi RA, Aggeler R. Mechanism of the F1F0-type ATP synthase, a biological rotary motor. Trends Biochem. Sci. 2002;27:154–160. doi: 10.1016/s0968-0004(01)02051-5. [DOI] [PubMed] [Google Scholar]
- 5.Senior AE, Nadanaciva S, Weber J. The molecular mechanism of ATP synthesis by F1F0-ATP synthase. Biochim. Biophys. Acta. 2002;1553:188–211. doi: 10.1016/s0005-2728(02)00185-8. [DOI] [PubMed] [Google Scholar]
- 6.Weber J, Senior AE. ATP synthesis driven by proton transport in F1F0-ATP synthase. FEBS Lett. 2003;545:61–70. doi: 10.1016/s0014-5793(03)00394-6. [DOI] [PubMed] [Google Scholar]
- 7.Weber J, Wilke-Mounts S, Lee RSF, Grell E, Senior AE. Specific placement of tryptophan in the catalytic sites of Escherichia coli F1-ATPase provides a direct probe of nucleotide binding: maximal ATP hydrolysis occurs with three sites occupied. J. Biol. Chem. 1993;268:20126–20133. [PubMed] [Google Scholar]
- 8.Dou C, Fortes PA, Allison WS. The α3(βY341W)3γ subcomplex of the F1-ATPase from the thermophilic Bacillus PS3 fails to dissociate ADP when MgATP is hydrolyzed at a single catalytic site and attains maximal velocity when three catalytic sites are saturated with MgATP. Biochemistry. 1998;37:16757–16764. doi: 10.1021/bi981717q. [DOI] [PubMed] [Google Scholar]
- 9.Corvest V, Sigalat C, Venard R, Falson P, Mueller DM, Haraux F. The binding mechanism of the yeast F1-ATPase inhibitory peptide: role of catalytic intermediates and enzyme turnover. J. Biol. Chem. 2005;280:9927–9936. doi: 10.1074/jbc.M414098200. [DOI] [PubMed] [Google Scholar]
- 10.Löbau S, Weber J, Senior AE. Catalytic site nucleotide binding and hydrolysis in F1F0-ATP synthase. Biochemistry. 1998;37:10846–10853. doi: 10.1021/bi9807153. [DOI] [PubMed] [Google Scholar]
- 11.Kashket ER. Stoichiometry of the H+-ATPase of growing and resting, aerobic Escherichia coli. Biochemistry. 1982;21:5534–5538. doi: 10.1021/bi00265a024. [DOI] [PubMed] [Google Scholar]
- 12.Koebmann BJ, Westerhoff HV, Snoep JL, Nilsson D, Jensen PR. The glytolytic flux in Escherichia coli is controlled by the demand for ATP. J. Bacteriol. 2002;184:3909–3916. doi: 10.1128/JB.184.14.3909-3916.2002. [DOI] [PMC free article] [PubMed] [Google Scholar]
- 13.Al-Shawi MK, Ketchum CJ, Nakamoto RK. The Escherichia coli F0F1 γM23K uncoupling mutant has a higher K0.5 for Pi. Transition state analysis of this mutant and others reveals that synthesis and hydrolysis utilize the same kinetic pathway. Biochemistry. 1997;36:12961–12969. doi: 10.1021/bi971478r. [DOI] [PubMed] [Google Scholar]
- 14.Wise JG, Senior AE. Catalytic properties of the Escherichia coli proton adenosinetriphosphatase: evidence that nucleotide bound at noncatalytic sites is not involved in regulation of oxidative phosphorylation. Biochemistry. 1985;24:6949–6954. doi: 10.1021/bi00345a030. [DOI] [PubMed] [Google Scholar]
- 15.Fischer S, Etzold C, Turina P, Deckers-Hebestreit G, Altendorf K, Grα̈ber P. ATP synthesis catalyzed by the ATP synthase of Escherichia coli reconstituted into liposomes. Eur. J. Biochem. 1994;225:167–172. doi: 10.1111/j.1432-1033.1994.00167.x. [DOI] [PubMed] [Google Scholar]
- 16.Weber J, Senior AE. ATP synthase: what we know about ATP hydrolysis and what we do not know about ATP synthesis. Biochim. Biophys. Acta. 2000;1458:300–309. doi: 10.1016/s0005-2728(00)00082-7. [DOI] [PubMed] [Google Scholar]
- 17.Boyer PD. Biochemistry. Vol. 66. Moscow: 2001. Toward an adequate scheme for the ATP synthase catalysis; pp. 1058–1066. [DOI] [PubMed] [Google Scholar]
- 18.Boyer PD. Catalytic site occupancy during ATP synthase catalysis. FEBS Lett. 2002;512:29–32. doi: 10.1016/s0014-5793(02)02293-7. [DOI] [PubMed] [Google Scholar]
- 19.Gao YQ, Yang W, Marcus RA, Karplus M. A model for the cooperative free energy transduction and kinetics of ATP hydrolysis by F1-ATPase. Proc. Natl. Acad. Sci. U. S. A. 2003;100:11339–11344. doi: 10.1073/pnas.1334188100. [DOI] [PMC free article] [PubMed] [Google Scholar]
- 20.Gao YQ, Yang W, Karplus M. A structure-based model for the synthesis and hydrolysis of ATP by F1-ATPase. Cell. 2005;123:195–205. doi: 10.1016/j.cell.2005.10.001. [DOI] [PubMed] [Google Scholar]
- 21.Abrahams JP, Leslie AGW, Lutter R, Walker JE. Structure at 2.8 Å resolution of F1-ATPase from bovine heart mitochondria. Nature. 1994;370:621–628. doi: 10.1038/370621a0. [DOI] [PubMed] [Google Scholar]
- 22.Menz RI, Walker JE, Leslie AGW. Structure of bovine mitochondrial F1-ATPase with nucleotide bound to all three catalytic sites: implications for the mechanism of rotary catalysis. Cell. 2001;106:331–341. doi: 10.1016/s0092-8674(01)00452-4. [DOI] [PubMed] [Google Scholar]
- 23.Weber J, Senior AE. Fluorescent probes applied to catalytic cooperativity in ATP synthase. Methods Enzymol. 2004;380:132–152. doi: 10.1016/S0076-6879(04)80006-5. [DOI] [PubMed] [Google Scholar]
- 24.Nadanaciva S, Weber J, Senior AE. Binding of the transition state analog MgADP-fluoroaluminate to F1-ATPase. J. Biol. Chem. 1999;274:7052–7058. doi: 10.1074/jbc.274.11.7052. [DOI] [PubMed] [Google Scholar]
- 25.Weber J, Bowman C, Senior AE. Specific tryptophan substitution in catalytic sites of Escherichia coli F1-ATPase allows differentiation between bound substrate ATP and product ADP in steady-state catalysis. J. Biol. Chem. 1996;271:18711–18718. doi: 10.1074/jbc.271.31.18711. [DOI] [PubMed] [Google Scholar]
- 26.Weber J, Wilke-Mounts S, Senior AE. Cooperativity and stoichiometry of substrate binding to the catalytic sites of Escherichia coli F1-ATPase. Effects of magnesium, inhibitors, and mutation. J. Biol. Chem. 1994;269:20462–20467. [PubMed] [Google Scholar]
- 27.Löbau S, Weber J, Wilke-Mounts S, Senior AE. F1-ATPase, roles of three catalytic site residues. J. Biol. Chem. 1997;272:3648–3656. doi: 10.1074/jbc.272.6.3648. [DOI] [PubMed] [Google Scholar]
- 28.Weber J, Senior AE. Effects of the inhibitors azide, dicyclohexylcarbodiimide, and aurovertin on nucleotide binding to the three F1-ATPase catalytic sites measured using specific tryptophan probes. J. Biol. Chem. 1998;273:33210–33215. doi: 10.1074/jbc.273.50.33210. [DOI] [PubMed] [Google Scholar]
- 29.Nadanaciva S, Weber J, Senior AE. New probes of the F1-ATPase catalytic transition state reveal that two of the three catalytic sites can assume a transition state conformation simultaneously. Biochemistry. 2000;39:9583–9590. doi: 10.1021/bi000941o. [DOI] [PubMed] [Google Scholar]
- 30.Murataliev MB, Boyer PD. Interaction of mitochondrial F1-ATPase with trinitrophenyl derivatives of ATP and ADP. Participation of third catalytic site and role of Mg2+ in enzyme inactivation. J. Biol. Chem. 1994;269:15431–15439. [PubMed] [Google Scholar]
- 31.Yasuda R, Noji H, Yoshida M, Kinosita K, Jr., Itoh H. Resolution of distinct rotational substeps by submillisecond kinetic analysis of F1-ATPase. Nature. 2001;410:898–904. doi: 10.1038/35073513. [DOI] [PubMed] [Google Scholar]
- 32.Shimabukuro K, Yasuda R, Muneyuki E, Hara KY, Kinosita K, Jr., Yoshida M. Catalysis and rotation of F1 motor: cleavage of ATP at the catalytic site occurs in 1 ms before 40 degree substep rotation. Proc. Natl. Acad. Sci. U. S. A. 2003;100:14731–14736. doi: 10.1073/pnas.2434983100. [DOI] [PMC free article] [PubMed] [Google Scholar]
- 33.Ma J, Flynn TC, Cui Q, Leslie AGW, Walker JE, Karplus M. A dynamic analysis of the rotation mechanism for conformational change in F1-ATPase. Structure. 2002;10:921–931. doi: 10.1016/s0969-2126(02)00789-x. [DOI] [PubMed] [Google Scholar]
- 34.Ahmad Z, Senior AE. Involvement of ATP synthase residues αArg-376, βArg-182, and βLys-155 in Pi binding. FEBS Lett. 2005;579:523–528. doi: 10.1016/j.febslet.2004.12.022. [DOI] [PubMed] [Google Scholar]
- 35.Bulygin VV, Duncan TM, Cross RL. Rotor/Stator interactions of the ε subunit in Escherichia coli ATP synthase and implications for enzyme regulation. J. Biol. Chem. 2004;279:35616–35621. doi: 10.1074/jbc.M405012200. [DOI] [PubMed] [Google Scholar]
- 36.Feniouk BA, Suzuki T, Yoshida M. The role of subunit epsilon in the catalysis and regulation of F0F1-ATP synthase. Biochim. Biophys. Acta. doi: 10.1016/j.bbabio.2006.03.022. in press. [DOI] [PubMed] [Google Scholar]
- 37.Weber J, Senior AE. Bi-site catalysis in F1-ATPase: does it exist? J. Biol. Chem. 2001;276:35422–35428. doi: 10.1074/jbc.M104946200. [DOI] [PubMed] [Google Scholar]
- 38.Kagawa R, Montgomery MG, Braig K, Leslie AGW, Walker JE. The structure of bovine F1-ATPase inhibited by ADP and beryllium fluoride. EMBO J. 2004;23:2734–2744. doi: 10.1038/sj.emboj.7600293. [DOI] [PMC free article] [PubMed] [Google Scholar]
- 39.Weber J, Hammond ST, Wilke-Mounts S, Senior AE. Mg2+ coordination in catalytic sites of F1-ATPase. Biochemistry. 1998;37:608–614. doi: 10.1021/bi972370e. [DOI] [PubMed] [Google Scholar]
- 40.Noji H, Yasuda R, Yoshida M, Kinosita K., Jr. Direct observation of the rotation of F1-ATPase. Nature. 1997;386:299–302. doi: 10.1038/386299a0. [DOI] [PubMed] [Google Scholar]
- 41.Nakamoto RK, Ketchum CJ, Al-Shawi MK. Rotational coupling in the F0F1 ATP synthase. Annu. Rev. Biophys. Biomol. Struct. 1999;28:205–234. doi: 10.1146/annurev.biophys.28.1.205. [DOI] [PubMed] [Google Scholar]