Abstract
In this study we present a method of identifying Arabidopsis miRNA promoter elements using known transcription factor binding motifs. We provide a comparative analysis of the representation of these elements in miRNA promoters, protein-coding gene promoters, and random genomic sequences. We report five transcription factor (TF) binding motifs that show evidence of overrepresentation in miRNA promoter regions relative to the promoter regions of protein-coding genes. This investigation is based on the analysis of 800-nucleotide regions upstream of 63 experimentally verified Transcription Start Sites (TSS) for miRNA primary transcripts in Arabidopsis. While the TATA-box binding motif was also previously reported by Xie and colleagues, the transcription factors AtMYC2, ARF, SORLREP3, and LFY are identified for the first time as overrepresented binding motifs in miRNA promoters.
Keywords: microRNA, transcription factors, promoter, sequence scanning, position-specific weight matrices
INTRODUCTION
Less than a decade ago, a class of small RNA molecules named microRNAs (miRNAs) was identified as negative modulators of gene expression. These short (21–24 nt) RNA molecules are processed from longer precursors transcribed from endogenous sequences. Although they have been found both in plants and animals—but not in fungi—there is mounting evidence that the mode of action of miRNAs in the two kingdoms is somewhat different (for a recent review on miRNA biogenesis and function, see He and Hannon 2004). Unlike animal miRNAs, plant miRNAs are primarily encoded in intergenic regions and down-regulate the expression of the gene by guiding an Argonaute protein complex in slicing a highly complementary mRNA-target molecule (for a recent review on plant miRNAs, see Jones-Rhoades et al. 2006). Although much effort has been focused on elucidating the mechanism of miRNA target gene regulation, relatively little is known and published about the regulation of miRNA genes themselves. The nature of miRNA promoter elements remains one of the most interesting open problems in the study of miRNA biogenesis, since their identification would aid in the understanding of regulatory networks in which miRNAs play a crucial role.
Several fundamental studies to date (Bracht et al. 2004; Cai et al. 2004; Lee et al. 2004) have provided laboratory evidence that miRNAs are transcribed in eukaryotes by RNA polymerase II (RNA Pol II), suggesting that miRNA transcription may be regulated by a similar mechanism as established for protein-coding genes. A crucial component in the analysis of a miRNA promoter region is the accurate identification of the Transcription Start Site (TSS). In animals the primary transcript is rapidly cleaved in the nucleus by the enzyme Drosha, and this presents a technical barrier for the large-scale experimental identification of TSSs. The primary transcripts that have been experimentally characterized in animal species have been observed to be on the order of 1–4 kb in length (Bracht et al. 2004; Cai et al. 2004; Lee et al. 2004), whereas the TSS may be as little as 50 nt and as much as 2.5 kb upstream of the first miRNA contained within the transcript, suggesting that promoter location cannot be inferred directly from miRNA location alone. The fact that only a very limited number of published reports mention upstream regulatory sequences of miRNA genes may be largely attributed to this difficulty (Ohler et al. 2004; Sun et al. 2004; Sethupathy et al. 2005).
The recent identification of 63 miRNA TSSs in Arabidopsis (Xie et al. 2005) via 5′-RACE presents an exciting opportunity for computational analysis of miRNA promoter regions in plants. The Carrington laboratory used the de novo motif discovery tool BioProspector to search for 6–8-bp-wide motifs within the TSS region (−50, 10), resulting in the discovery of a TATA-box sequence, which further supports the idea that RNA Pol II is responsible for miRNA transcription. In comparison to the Carrington study, we analyze regions up to 800 nt upstream of the miRNA TSS sites to search for known transcription factor binding elements. The goal of our investigation is to determine whether there exist “miRNA-preferred” transcription factor binding elements in Arabidopsis. More formally, we are looking for known transcription factors that have an overrepresentation of binding sites in miRNA promoter regions. We evaluate overrepresentation of binding sites relative to both random genomic sequences and promoter regions of protein-coding genes.
Several aspects of our promoter region analysis involved the development of specialized methodology. There exists no single centralized collection of Positional Weight Matrices (PWMs) for the many known transcription factors in Arabidopsis. Therefore, we constructed 99 PWMs from binding sites contained in two Arabidopsis promoter binding element databases: AtProbe (http://exon.cshl.org/cgi-bin/atprobe/atprobe.pl) and AGRIS (Davuluri et al. 2003). The subsequent search for binding sites based on these PWMs was highly dependent on the use of a meaningful scoring function, as well as the intelligent choice of a threshold value for this scoring function. A key result of our analysis is that the use of PWM-specific threshold values is superior to the common procedure of using a single score threshold across all PWMs. These PWM-specific threshold values guarantee that a discovered binding site for a particular TF is at least as likely as any database-listed binding site for that TF. To complete our analysis of a particular TF, we compare the frequency of binding site occurrences in miRNA promoter regions to the frequency of occurrences in protein-coding gene promoter regions and randomly sampled Arabidopsis genome sequence. Our investigation leads to the identification of five TF binding motifs that appear to be overrepresented in miRNA sequences relative to protein-coding gene promoter sequences: AtMYC2, ARF, SORLREP3, LFY, and TATA-box.
MATERIALS AND METHODS
Promoter sequence selection
We use two complementary promoter element databases: the Arabidopsis Gene Regulatory Information Server (AGRIS) and the Arabidopsis thaliana Promoter Binding Element Database (AtProbe). AGRIS is a large comprehensive database containing promoter sequences for more than 25,000 genes along with information about hundreds of transcription factors and their binding sites from many sources including PlantCARE, PLACE, and TRANSFAC (Higo et al. 1999; Wingender et al. 2000; Lescot et al. 2002). A particular advantage of AGRIS is that it connects promoter binding element motifs with their observed locations in a large set of protein-coding gene promoter sequences. In contrast, AtProbe is a small database of 118 binding elements containing information manually curated from the literature by the Zhang laboratory. AtProbe focuses on specific elements that have been experimentally observed to bind upstream of known genes.
Our set of protein-coding gene promoter sequences comes from the AGRIS database, which contains three categories of promoter sequences: “experimental,” “curated,” and “predicted.” We focus only on promoter regions that have some experimental support by selecting a set from the “experimental” and “curated” categories. These promoters have either direct experimental support or have been curated by matching full-length Arabidopsis cDNAs from the Riken Institute with AGRIS-predicted promoter regions. We use the term “PGP set” to refer to the resulting set of 12,592 protein-coding gene promoter (PGP) sequences.
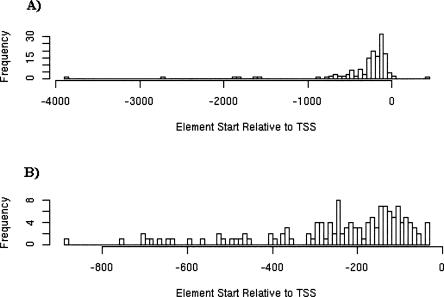
To determine the appropriate length of our promoter regions, we examined the reported location of experimentally supported binding sites in AtProbe. Figure 1A shows the reported binding element start locations relative to gene TSS for AtProbe elements in the range (TSS − 5000, TSS + 5000), whereas Figure 1B shows only the locations within a 1-kb region of the gene TSS. Only four binding site locations were reported outside of this (TSS − 5000, TSS + 5000) region. About 90% of reported binding sites fall within 800 bp of the TSS, and thus we choose to focus on the (TSS − 800) upstream region for both miRNA and protein-coding gene promoter sequences.
FIGURE 1.
(A) A histogram of reported binding element start locations relative to gene TSS for all AtProbe elements in the range (TSS − 5000, TSS + 5000). (B) A histogram of AtProbe reported binding element start locations in the range (TSS − 1000, TSS − 0).
We use the 63 TSS locations identified in Xie et al. (2005) to prepare a set of miRNA upstream promoter regions as follows: we compute the genomic location of the TSS associated with each miRNA, and identify the nearest upstream gene for each miRNA TSS using the TAIR6 genome annotation release (Rhee et al. 2003). In cases in which multiple TSSs were identified upstream of a single miRNA, we restricted ourselves to the downstream-most TSS so that we were considering the largest possible promoter region. This restriction reduced our set of TSS locations from 63 down to 52. Sequences are extracted in the range (−800, 0) with respect to each TSS, but shortened if necessary so as not to overlap with any protein-coding gene 3′-UTR. These 52 miRNA promoter sequences are made available in Supplemental File 1 (see http://www.diana.pcbi.upenn.edu/Supplementary/AthMirnaTFBS.html).
For comparative purposes we generate a set of 12,592 random sequences of length 800 from the five chromosomes of the TAIR6 Arabidopsis genome build as follows. Each nucleotide position of every chromosome, up to 800 nt from the chromosome end, is considered as an equally likely start position. Random sequences are iteratively selected by drawing a start position, and then extracting a genome segment of length 800 nt beginning at this start position. If a previously selected start position is encountered, the start position is redrawn. This procedure results in a collection of unique sequences drawn “without replacement” from among all possible length 800 segments in the genome.
Construction of PWMs for each TF
Next, we extracted all binding sites from the AGRIS database that were contained within the PGP set of sequences. AGRIS lists each binding site with its binding sequence and corresponding promoter location. However, we observed that in some cases this binding sequence was not present in the stated location (perhaps because of genome build changes). Therefore, to avoid including erroneous binding motifs, we filtered this collection of binding sites to exclude any sites with a disagreement between the database-listed binding sequence and the sequence actually observed at the stated promoter binding site location.
The filtered collection of binding sites was used to construct a Positional Weight Matrix (PWM) for each TF, which is a standard method for representing TF binding motifs (Stormo 2000). The PWM matrix consists of the number of occurrences of each nucleotide in each binding position of the motif. To ensure that no entry of the PWM matrix is exactly zero, pseudocounts of 0.25 were added to each entry of the count matrix. The resulting PWM represents each TF binding motif as a simple probability model that describes the chance of finding a particular nucleotide (A, C, G, or T) at a particular position of the motif. We used this same procedure to construct PWMs from the AtProbe database for three TFs (TATA-box, CAAT-box, and GC-box) that were not represented in our collection of filtered AGRIS binding sites. These three PWMs were based on a relatively small number of binding sites, which is not ideal, but we are assuming that the higher experimental support of AtProbe elements will produce a quality representation of the binding motif. In total, PWMs representing 99 TF binding motifs are constructed from the AGRIS and AtProbe databases (Supplemental File 2, at http://www.diana.pcbi.upenn.edu/Supplementary/AthMirnaTFBS.html).
Tuning the scoring function
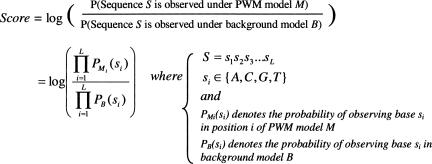
We use a log-likelihood scoring function to scan upstream sequences for potential TF binding sites (Fig. 2), which is a standard PWM-based scoring approach (Durbin et al. 1999). Intuitively, the log-likelihood score compares the probability of observing a particular subsequence according to our PWM model to the probability of observing that subsequence according to a background model. A high score is indicative of a good match to the TF binding motif, but how good must this score be for us to conclude that the subsequence is a binding site for that TF? We address this need for a meaningful threshold with the following simple procedure. For each TF separately, we compute the log-likelihood score of every binding site for that TF within our collection of filtered AGRIS and AtProbe binding sites. The simple background nucleotide distribution used for the calculation of scores is computed from entire set of PGP sequences. There is a noted compositional bias toward A-T enrichment in plant promoters (Pandey and Krishnamachari 2006), and we also observe such a bias in our Arabidopsis promoter sets. Specifically, we observe that the TAIR6 genome build contains a mean A-T content of 64.0%, while our miRNA and protein-coding gene promoter sets in the region from the TSS to 800 bp upstream each contain a mean A-T content of 68.9% and 67.8%, respectively. The similarity in base composition between miRNA promoter and PGP sets supports the idea that an A-T-rich background is a biologically meaningful aspect of Arabidopsis Pol II promoter regions.
FIGURE 2.
Log-likelihood score function for comparing subsequence S to PWM M.
We then select the minimum score for the observed binding sites associated with each PWM, and set our threshold equal to this minimum score. The consequence of this procedure is that, when scanning a particular set of upstream sequences, we will only “discover” a binding site occurrence of a particular TF if its PWM-based log-likelihood score is at least as strong as all database-listed binding sites for that TF. The threshold score for each TF binding motif is listed in Supplemental File 3 (http://www.diana.pcbi.upenn.edu/Supplementary/AthMirnaTFBS.html).
The considerable variability of these threshold scores between different TFs suggests that our PWM-specific threshold scheme is more highly informative than the common procedure of using a single threshold across all TFs. Our procedure for tuning the threshold scores is summarized in Figure 3.
FIGURE 3.
A flow-chart diagram of the process for tuning PWM-specific threshold scores.
Scanning for binding sites
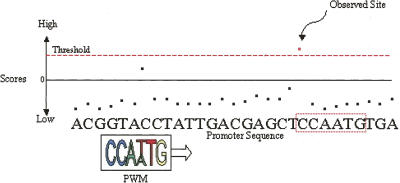
The log-likelihood scoring function and associated TF-specific threshold score are used to scan miRNA promoter sequences for putative TF binding site occurrences, as illustrated in Figure 4. The putative binding sites found to exceed the PWM-specific threshold score for each TF are listed in Supplemental File 4 (http://www.diana.pcbi.upenn.edu/Supplementary/AthMirnaTFBS.html).
FIGURE 4.
An illustration to visualize scanning for binding sites: only those sites in a promoter sequence that exceed the PWM-specific threshold score are “observed” as putative binding sites.
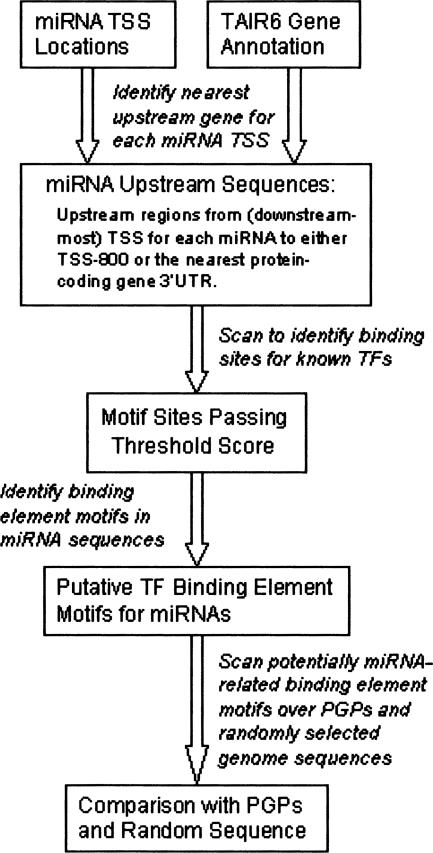
We focus on the “putative miRNA binding TFs,” which are the subset of the TF binding motifs that had at least one discovered binding site in the set of miRNA upstream sequences. For comparison, we also used the same PWMs to scan each of the 12,592 protein-coding gene promoter sequences as well as 12,592 randomly selected sequences of length 800 from the TAIR6 release of the Arabidopsis genome. As noted above, the miRNA upstream regions are truncated to avoid overlap with a protein-coding gene 3′-UTR, and therefore some sequences in this set will have lengths shorter than 800 nt. The effect of this truncation is that the proportion of putative TFBS sites identified in miRNA upstream sequences will be a conservative estimate with respect to the proportions observed in the PGP and random sequence sets. Figure 5 provides a flow-chart summary of the binding site discovery procedure.
FIGURE 5.
A flow-chart diagram of the process for identifying transcription factor binding motifs in miRNA promoter regions.
RESULTS AND DISCUSSION
Binding site locations
As a simple diagnostic for the effectiveness of our binding site discovery procedure, we examined the distribution of binding site locations for two different TFs: the TATA-box, which is a core promoter element and is expected to show a strong locational preference, and LFY, which is not a core promoter element. As expected, the putative TATA-box binding sites observed in both miRNA and protein-coding gene promoter sequences show a clear site location preference for the canonical TATA-box location, while sites are distributed uniformly throughout the random sequences. There does not seem to be a location preference for putative LFY binding sites in either of the two sets of promoter sequences, which is typical of TFs that do not bind to core promoter elements. The putative LFY binding site locations in random sequences are also uniformly distributed as expected. The distribution of putative TATA-box and LFY binding site locations in the miRNA promoter regions, protein-coding promoter regions, and randomly selected genomic sequences is included in Supplemental File 5 (http://www.diana.pcbi.upenn.edu/Supplementary/AthMirnaTFBS.html).
Comparison of binding site proportions
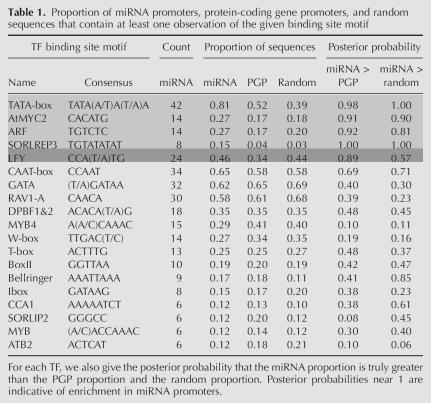
The primary goal of our investigation is the detection of TF binding motifs that may preferentially occur in miRNA promoter regions compared to protein-coding genes or random genomic sequences. For each TF, we compare the proportion of sequences with at least one discovered binding site within each of our three sequence sets: the 52 miRNA promoter sequences, the 12,592 protein-coding promoter sequences, and 12,592 randomly selected Arabidopsis genomic sequences. These proportions are presented in Table 1, along with columns that give (1) the posterior probability that the miRNA proportion of binding sites is truly greater than the PGP proportion and (2) the posterior probability that the miRNA proportion of binding sites is truly greater than the proportion in random sequences. Posterior probabilities near to one are evidence of overrepresentation of that TF in miRNA promoter sequences. These posterior probabilities were calculated by assuming a binomial distribution for the number of sequences containing a binding site in each sequence set. Additional details of this calculation are given in Supplemental File 6 (http://www.diana.pcbi.upenn.edu/Supplementary/AthMirnaTFBS.html). Table 1 also provides the count (out of 52) of the number of miRNA promoter sequences that contained a binding site. Only those TFs that have putative binding sites in at least five miRNA promoter sequences are displayed in Table 1, as we should not infer a substantial role for TFs in miRNA regulation that have a very small number of observations.
Table 1.
Proportion of miRNA promoters, protein-coding gene promoters, and random sequences that contain at least one observation of the given binding site motif
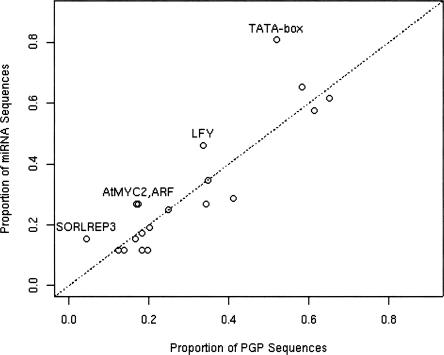
The binding motifs for known TFs TATA-box, AtMYC2, ARF, SORLREP3, and LFY appear a high proportion of the time in miRNA upstream regions relative to their binding site proportions in protein-coding gene promoters and randomly sampled genomic sequences, suggesting that these transcription factors may be involved in Arabidopsis miRNA transcription. The first four TFs (light-gray rows in Table 1) show a high posterior probability of enrichment in miRNA promoter sequences relative to both PGP sequences and random sequences, although ARF has a somewhat lower posterior probability relative to random sequences. The LFY TF (dark-gray row) also shows a fairly high posterior probability of enrichment in miRNA promoters relative to PGP promoters, but not relative to random sequences. The enrichment of binding sites for these five TFs in miRNA promoter regions relative to PGP regions can also be seen in Figure 6, which plots the binding site proportions in miRNA promoter sequences versus PGP sequences for each TF. The points for AtMYC2, ARF, SORLEP3, LFY, and the TATA-box are substantially above the line of equality.
FIGURE 6.
A plot of the proportion of miRNA sequences versus the proportion of PGP sequences containing at least one TF binding site observation.
The generalizability of our analysis relies on an assumption that the chosen sets of miRNA and protein-coding gene promoter sequences are representative of the larger set of all miRNA and protein-coding promoter regions. The results of this study are not generalizable to this larger population if the miRNA promoter sequences associated with the TSSs identified in Xie et al. (2005) or the Riken-curated protein-coding gene promoter sequences contain an unforeseen bias toward certain binding site motifs. Both sequence sets were selected based on their strong experimental support, and we are not aware of any inherent bias in these sets with respect to promoter element binding motifs. However, despite the fact that upstream sequences for 52 out of the 117 known Arabidopsis miRNAs contained in miRBase (Griffiths-Jones et al. 2006) are represented in the miRNA promoter set, the relatively small number of miRNA genes involved in the analysis does make some bias, especially at very low proportion values, unavoidable.
Discussion of binding motifs observed in miRNA promoters
While sequences other than the upstream non-coding “promoter” region of RNA Pol II transcribed genes can modulate gene expression, a recent study emphasizes that the sequences in the 5′-upstream region of genes are of primary importance in Arabidopsis gene regulation (Lee et al. 2006). Specifically, this study found that gene promoter sequences were sufficient to recapture the mRNA expression pattern for 80% of the TFs considered, confirming the important role RNA Pol II promoter regions in Arabidopsis gene expression. In light of this work, we examine the biological role of TFs that may potentially regulate miRNA genes through binding sites in miRNA promoter regions.
The TATA-box is the best characterized of the plant promoter elements (Guarente and Bermingham-McDonogh 1992). There is some evidence that TATA-boxes are often absent in housekeeping genes (Smale 2001), hence the overrepresentation of TATA-boxes in our miRNA promoter sequences could be attributed to the fact that we compare them to a group of protein-coding genes that includes housekeeping genes. The frequency and position of the TATA-box in the promoters of plant protein-coding genes are thoroughly analyzed in Molina and Grotewold (2005).
Three of the elements found to be overrepresented in miRNA upstream sequences with respect to both random and protein-coding gene promoter sequences—ARF, AtMYC2, and LFY—also appear to be directly or indirectly regulated by plant hormones. The ARF (Auxin Response Factor) element associated causes repression of GUS reporter gene expression in the absence of auxin (plant hormone) and activation of expression in the presence of auxin (Ulmasov et al. 1997a,b). AtMYC2 binding sites were originally found in a drought-responsive gene (rd22), and originally designated rd22BP1 as a dehydration-responsive cis-acting element. AtMYC2 was shown to increase responsiveness to drought, mediated through higher sensitivity to the plant hormone ABA. LFY is known for its direct transcriptional activation of certain floral homeotic genes (AP1, AG) (Parcy et al. 1998; Busch et al. 1999; Wagner et al. 1999) and its indirect effect on others (AP3) (Lamb et al. 2002). The LFY gene plays a key role during flower development and can be considered both as a flowering time gene and a meristem identity gene (Parcy 2005). The plant hormone gibberellic acid (GA) strongly affects flowering time, which is achieved in part by up-regulating LFY. MiRNAs have long been noted for their developmental roles in animal species, and it is interesting to note that the roles of these three TFs are generally related to plant development and environmental adaptation.
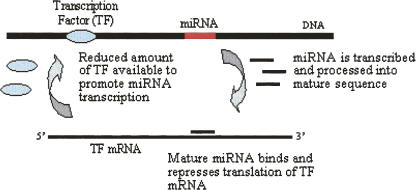
Several recent laboratory studies demonstrating interaction between transcription factors and animal miRNAs in regulatory feedback loops (Fazi et al. 2005; Johnston et al. 2005; Li and Carthew 2005) prompted a more detailed examination of our results. We searched Tarbase, a comprehensive literature-curated database of experimentally supported miRNA targets, for Arabidopsis miRNAs that repress or cleave members of the AtMYC2 (bHLH), ARF, SORLREP3, and LFY transcription factor gene families. We found that two miRNAs with putative ARF binding sites upstream, miR-160 and miR-167, have experimentally supported targets belonging to the ARF gene family (Sethupathy et al. 2006). This interesting observation supports the idea that miRNAs may play a role in negative feedback loops that control their own expression levels (Fig. 7). More generally, the results of this study present a set of putative TF binding site observations that may be further investigated for evidence of miRNA regulation. These sites may be used to search for a functional connection between transcription factors and the targets of the miRNAs they potentially regulate.
FIGURE 7.
An illustration of a miRNA and a transcription factor in a negative feedback loop.
In summary, we have constructed a principled scanningprocedure for discovering binding sites from known TF binding motifs, and used this method to compare the motifs observed in miRNA promoters, protein-coding gene promoters, and random genomic sequences. We have identified five potentially “miRNA-preferred” motifs, AtMYC2, ARF, SORLREP3, LFY, and TATA-box. These results provide a foundation for further investigation of the functional role of known transcription factors in the regulation of Arabidopsis miRNAs, which would be strengthened by additional Arabidopsis miRNA promoter data. In addition, despite the substantial laboratory challenge involved, we anticipate that data from the large-scale identification of TSSs for miRNA primary transcripts in mammals will become available in the near future, at which time our PWM-specific methodology can be adapted for experimentally supported mammalian miRNA promoter regions.
ACKNOWLEDGMENTS
We thank Praveen Sethupathy for his insightful suggestion to examine experimentally supported Arabidopsis miRNA targets contained in Tarbase for potential regulatory feedback loops. We are also grateful to Zissimos Mourelatos and Fernando Pereira for their helpful comments. A.G.H. and M.M. are supported by an NSF Career Award (DBI-0238295). S.T.J. is supported by a University of Pennsylvania Research Foundation Grant. K.K., V.B., and V.R. are supported by the FAMED-contract EST 7295 and FOSRAK-STREP 2004-005120 European grants.
Footnotes
Article published online ahead of print. Article and publication date are at http://www.rnajournal.org/cgi/doi/10.1261/rna.130506.
REFERENCES
- Bracht J., Hunter S., Eachus R., Weeks P., Pasquinelli A.E. Trans-splicing and polyadenylation of let-7 microRNA primary transcripts. RNA. 2004;10:1586–1594. doi: 10.1261/rna.7122604. [DOI] [PMC free article] [PubMed] [Google Scholar]
- Busch M.A., Bomblies K., Weigel D. Activation of a floral homeotic gene in Arabidopsis . Science. 1999;285:585–587. doi: 10.1126/science.285.5427.585. [DOI] [PubMed] [Google Scholar]
- Cai X., Hagedorn C.H., Cullen B.R. Human microRNAs are processed from capped, polyadenylated transcripts that can also function as mRNAs. RNA. 2004;10:1957–1966. doi: 10.1261/rna.7135204. [DOI] [PMC free article] [PubMed] [Google Scholar]
- Davuluri R.V., Sun H., Palaniswamy S.K., Matthews N., Molina C., Kurtz M., Grotewold E. AGRIS: Arabidopsis gene regulatory information server, an information resource of Arabidopsis cis-regulatory elements and transcription factors. BMC Bioinformatics. 2003;4 doi: 10.1186/1471-2105-4-25. [DOI] [PMC free article] [PubMed] [Google Scholar]
- Durbin R., Eddy S., Krogh A., Mitchison G. Biological sequence analysis: Probabilistic models of proteins and nucleic acids. Cambridge University Press; Cambridge, UK: 1999. [Google Scholar]
- Fazi F., Rosa A., Fatica A., Gelmetti V., De Marchis M.L., Nervi C., Bozzoni I. A minicircuitry comprised of microRNA-223 and transcription factors NFI-A and C/EBPα regulates human granulopoiesis. Cell. 2005;123:819–831. doi: 10.1016/j.cell.2005.09.023. [DOI] [PubMed] [Google Scholar]
- Griffiths-Jones S., Grocock R.J., van Dongen S., Bateman A., Enright A.J. miRBase: microRNA sequences, targets and gene nomenclature. Nucleic Acids Res. 2006;34:D140–D144. doi: 10.1093/nar/gkj112. [DOI] [PMC free article] [PubMed] [Google Scholar]
- Guarente L., Bermingham-McDonogh O. Conservation and evolution of transcriptional mechanisms in eukaryotes. Trends Genet. 1992;8:27–32. doi: 10.1016/0168-9525(92)90021-u. [DOI] [PubMed] [Google Scholar]
- He L., Hannon G.J. MicroRNAs: Small RNAs with a big role in gene regulation. Nat. Rev. Genet. 2004;5:522–531. doi: 10.1038/nrg1379. [DOI] [PubMed] [Google Scholar]
- Higo K., Ugawa Y., Iwamoto M., Korenaga T. Plant cis-acting regulatory DNA elements (PLACE) database: 1999. Nucleic Acids Res. 1999;27:297–300. doi: 10.1093/nar/27.1.297. [DOI] [PMC free article] [PubMed] [Google Scholar]
- Johnston R.J., Jr., Chang S., Etchberger J.F., Ortiz C.O., Hobert O. MicroRNAs acting in a double-negative feedback loop to control a neuronal cell fate decision. Proc. Natl. Acad. Sci. 2005;102:12449–12454. doi: 10.1073/pnas.0505530102. [DOI] [PMC free article] [PubMed] [Google Scholar]
- Jones-Rhoades M.W., Bartel D.P., Bartel B. MicroRNAs and their regulatory roles in plants. Annu. Rev. Plant Biol. 2006;57:19–53. doi: 10.1146/annurev.arplant.57.032905.105218. [DOI] [PubMed] [Google Scholar]
- Lamb R.S., Hill T.A., Tan Q.K., Irish V.F. Regulation of APETALA3 floral homeotic gene expression by meristem identity genes. Development. 2002;129:2079–2086. doi: 10.1242/dev.129.9.2079. [DOI] [PubMed] [Google Scholar]
- Lee Y., Kim M., Han J., Yeom K.H., Lee S., Baek S.H., Kim V.N. MicroRNA genes are transcribed by RNA polymerase II. EMBO J. 2004;23:4051–4060. doi: 10.1038/sj.emboj.7600385. [DOI] [PMC free article] [PubMed] [Google Scholar]
- Lee J.Y., Colinas J., Wang J.Y., Mace D., Ohler U., Benfey P.N. Transcriptional and posttranscriptional regulation of transcription factor expression in Arabidopsis roots. Proc. Natl. Acad. Sci. 2006;103:6055–6060. doi: 10.1073/pnas.0510607103. [DOI] [PMC free article] [PubMed] [Google Scholar]
- Lescot M., Dehais P., Thijs G., Marchal K., Moreau Y., Van de Peer Y., Rouze P., Rombauts S. PlantCARE, a database of plant cis-acting regulatory elements and a portal to tools for in silico analysis of promoter sequences. Nucleic Acids Res. 2002;30:325–327. doi: 10.1093/nar/30.1.325. [DOI] [PMC free article] [PubMed] [Google Scholar]
- Li X., Carthew R.W. A microRNA mediates EGF receptor signaling and promotes photoreceptor differentiation in the Drosophila eye. Cell. 2005;123:1267–1277. doi: 10.1016/j.cell.2005.10.040. [DOI] [PubMed] [Google Scholar]
- Molina C., Grotewold E. Genome wide analysis of Arabidopsis core promoters. BMC Genomics. 2005;6 doi: 10.1186/1471-2164-6-25. [DOI] [PMC free article] [PubMed] [Google Scholar]
- Ohler U., Yekta S., Lim L.P., Bartel D.P., Burge C.B. Patterns of flanking sequence conservation and a characteristic upstream motif for microRNA gene identification. RNA. 2004;10:1309–1322. doi: 10.1261/rna.5206304. [DOI] [PMC free article] [PubMed] [Google Scholar]
- Pandey S.P., Krishnamachari A. Computational analysis of plant RNA Pol-II promoters. Biosystems. 2006;83:38–50. doi: 10.1016/j.biosystems.2005.09.001. [DOI] [PubMed] [Google Scholar]
- Parcy F. Flowering: A time for integration. Int. J. Dev. Biol. 2005;49:585–593. doi: 10.1387/ijdb.041930fp. [DOI] [PubMed] [Google Scholar]
- Parcy F., Nilsson O., Busch M.A., Lee I., Weigel D. A genetic framework for floral patterning. Nature. 1998;395:561–566. doi: 10.1038/26903. [DOI] [PubMed] [Google Scholar]
- Rhee S.Y., Beavis W., Berardini T.Z., Chen G., Dixon D., Doyle A., Garcia-Hernandez M., Huala E., Lander G., Montoya M., et al. The Arabidopsis Information Resource (TAIR): A model organism database providing a centralized, curated gateway to Arabidopsis biology, research materials and community. Nucleic Acids Res. 2003;31:224–228. doi: 10.1093/nar/gkg076. [DOI] [PMC free article] [PubMed] [Google Scholar]
- Sethupathy P., Megraw M., Barrasa M., Hatzigeorgiou A. Lecture notes in computer science. Springer; Berlin/Heidelberg, Germany: 2005. Computational identification of regulatory factors involved in microRNA transcription; pp. 457–468. [Google Scholar]
- Sethupathy P., Corda B., Hatzigeorgiou A.G. TarBase: A comprehensive database of experimentally supported animal microRNA targets. RNA. 2006;12:192–197. doi: 10.1261/rna.2239606. [DOI] [PMC free article] [PubMed] [Google Scholar]
- Smale S.T. Core promoters: Active contributors to combinatorial gene regulation. Genes & Dev. 2001;15:2503–2508. doi: 10.1101/gad.937701. [DOI] [PubMed] [Google Scholar]
- Stormo G.D. DNA binding sites: Representation and discovery. Bioinformatics. 2000;16:16–23. doi: 10.1093/bioinformatics/16.1.16. [DOI] [PubMed] [Google Scholar]
- Sun Y., Koo S., White N., Peralta E., Esau C., Dean N.M., Perera R.J. Development of a micro-array to detect human and mouse microRNAs and characterization of expression in human organs. Nucleic Acids Res. 2004;32 doi: 10.1093/nar/gnh186. [DOI] [PMC free article] [PubMed] [Google Scholar]
- Ulmasov T., Hagen G., Guilfoyle T.J. ARF1, a transcription factor that binds to auxin response elements. Science. 1997a;276:1865–1868. doi: 10.1126/science.276.5320.1865. [DOI] [PubMed] [Google Scholar]
- Ulmasov T., Murfett J., Hagen G., Guilfoyle T.J. Aux/IAA proteins repress expression of reporter genes containing natural and highly active synthetic auxin response elements. Plant Cell. 1997b;9:1963–1971. doi: 10.1105/tpc.9.11.1963. [DOI] [PMC free article] [PubMed] [Google Scholar]
- Wagner D., Sablowski R.W., Meyerowitz E.M. Transcriptional activation of APETALA1 by LEAFY. Science. 1999;285:582–584. doi: 10.1126/science.285.5427.582. [DOI] [PubMed] [Google Scholar]
- Wingender E., Chen X., Hehl R., Karas H., Liebich I., Matys V., Meinhardt T., Pruss M., Reuter I., Schacherer F. TRANSFAC: An integrated system for gene expression regulation. Nucleic Acids Res. 2000;28:316–319. doi: 10.1093/nar/28.1.316. [DOI] [PMC free article] [PubMed] [Google Scholar]
- Xie Z., Allen E., Fahlgren N., Calamar A., Givan S.A., Carrington J.C. Expression of Arabidopsis miRNA genes. Plant Physiol. 2005;138:2145–2154. doi: 10.1104/pp.105.062943. [DOI] [PMC free article] [PubMed] [Google Scholar]


