

Abstract
The glomeruli of the main olfactory bulb are the first processing station of the olfactory pathway, where complex interactions occur between sensory axons, mitral cells and a variety of juxtaglomerular neurons, including external tufted cells (ETCs). Despite a number of studies characterizing ETCs, little is known about how their morphological and functional properties correspond to each other. Here we determined the active and passive electrical properties of ETCs using in vitro whole-cell recordings, and correlated them with their dendritic arborization patterns. Principal component followed by cluster analysis revealed two distinct subpopulations of ETCs based on their electrophysiological properties. Eight out of 12 measured physiological parameters exhibited significant difference between the two subpopulations, including the membrane time constant, amplitude of spike afterhyperpolarization, variance in the interspike interval distribution and subthreshold resonance. Cluster analysis of the morphological properties of the cells also revealed two subpopulations, the most prominent dissimilarity between the groups being the presence or absence of secondary, basal dendrites. Finally, clustering the cells taking all measured properties into account also indicated the presence of two subpopulations that mapped in an almost perfect one-to-one fashion to both the physiologically and the morphologically derived groups. Our results demonstrate that a number of functional and structural properties of ETCs are highly predictive of one another. However, cells within each subpopulation exhibit pronounced variability, suggesting a large degree of specialization evolved to fulfil specific functional requirements in olfactory information processing.
Keywords: cluster analysis, in vitro physiology, olfactory bulb, principal component analysis, reconstruction
Abbreviations: ACSF, artificial cerebrospinal fluid; AHP, afterhyperpolarization; AP, action potential; CV, coefficient of variation; EPL, external plexiform layer; ETC, external tufted cell; FWHM, full width at half maximum; GL, glomerular layer; ISI, interspike interval; JGC, juxtaglomerular cell; MOB, main olfactory bulb; PB, phosphate buffer; PCA, principal component analysis; PGC, periglomerular cell; Rin, input resistance; τ, membrane time constant
Introduction
In mammals, olfactory sensory neurons in the nasal epithelium expressing the same odourant receptors project their axons to one or a few glomeruli in each main olfactory bulb (MOB; Ressler et al., 1994; Vassar et al., 1994). The olfactory glomeruli are clear examples of the principle of grouping neural elements and synapses into well defined modules. These spherical regions of neuropil are the first processing station of the olfactory pathway, where sensory axons form synapses on the apical dendrites of the principal cells (mitral and tufted cells) and on some intrinsic neurons (Pinching & Powell, 1971b; Kosaka et al., 1998; Shepherd et al., 2004). Complex dendro-dendritic and axo-dendritic interactions also occur within the glomeruli between principal cells and juxtaglomerular cells (JGCs) and among JGCs (Kosaka et al., 1998, 2001; Hayar et al., 2004a, 2005; Shepherd et al., 2004; Kosaka & Kosaka, 2005). Cell bodies of JGCs are located around the glomeruli, creating a cell-rich neuropil.
It has long been recognized that JGCs are morphologically diverse and comprise short-axon, periglomerular and external tufted cells (ETCs; Cajal, 1911; Pinching & Powell, 1971a; Shepherd et al., 2004). Among the JGCs, ETCs have the largest somata (10–15 μm) and have a single, relatively sparse, fan-shaped apical dendritic tuft that most often arborizes in a single glomerulus. Most ETCs lack secondary dendrites. However, ETCs with basal dendrites have also been described, as have ETCs with apical tufts ramifying in two glomeruli (Pinching & Powell, 1971a; Macrides & Schneider, 1982; Hayar et al., 2004b; Shepherd et al., 2004), indicating the morphological heterogeneity of these cells. In contrast, periglomerular cells (PGCs) have the smallest somata among JGCs and a small, spine-bearing dendritic tuft (Pinching & Powell, 1971a; Shepherd et al., 2004). Short-axon cells of the glomerular layer (GL) have an intermediate soma size and are distinguished by dendrites that arborize around the glomeruli in the periglomerular region without forming an apical tuft (Pinching & Powell, 1971a; Aungst et al., 2003; Shepherd et al., 2004). Juxtaglomerular cells are also diverse, based on their active and passive electrical properties and their synaptic connectivity (Puopolo & Belluzzi, 1998; McQuiston & Katz, 2001; Hayar et al., 2004a, 2004b). Recently, Hayar et al. (2004a) have functionally characterized several JGCs and found robust differences between PGCs, ETCs and short-axon cells, but most physiological properties of the ETCs were found to be rather uniform.
To understand the cellular and synaptic mechanisms of olfactory information processing, the intrinsic properties and synaptic connectivity of these different types of nerve cells need to be deciphered. This requires the identification of whether structural and functional heterogeneity correlate with each other, resulting in well defined subpopulations of cells, or whether these measured features of the cells vary independently, resulting in a single but highly diverse population. In the present study, we aimed to characterize the intrinsic electrical and morphological properties of ETCs in the rat MOB. Based on a large number of measured physiological and morphological parameters, we asked whether ETCs comprise a single population or whether multiple subpopulations exist. We also aimed to determine whether the pattern of dendritic arborization of ETCs could be predicted from their active and passive electrical properties, and vice versa. Over 30 electrophysiological and 18 morphological parameters were measured and calculated for > 60 randomly selected ETCs. These parameters were subject to principal component analysis (PCA) followed by cluster analysis, which revealed two subpopulations of ETCs. Over two-thirds of the measured parameters significantly differed between the two subpopulations. Although pronounced variability in several parameters was still present within each subpopulation, further subdivisions were not justified statistically. Interestingly, there was an almost perfect match between the subgroups derived from the morphological and electrophysiological parameters, demonstrating that a number of functional and structural properties of ETCs are highly predictive of one another.
Materials and methods
Acute slice preparation
Male Wistar rats (26–78 days old; mean ± SD, 36.1 ± 9.7 days) were anaesthetized with ketamine (50 mg per animal) in accordance with the ethical guidelines of the Institute of Experimental Medicine, Hungarian Academy of Sciences. After decapitation, the brain was removed and placed into ice-cold artificial cerebrospinal fluid (ACSF) containing (in mm): sucrose, 230; KCl, 2.5; glucose, 25; NaH2PO4, 1.25; NaHCO3, 24; MgCl2, 4; and CaCl2, 0.5. Horizontal or sagittal slices from the olfactory bulb were cut at 300 μm thickness with a Vibratome (Leica VT1000S; Leica Microsystems, Vienna, Austria) and were stored in ACSF containing (in mm): NaCl, 85; sucrose, 75; KCl, 2.5; glucose, 25; NaH2PO4, 1.25; NaHCO3, 24; MgCl2, 4; and CaCl2, 0.5. After 30 min, this medium was gradually replaced with normal ACSF containing (in mm): NaCl, 126; KCl, 2.5; glucose, 25; NaH2PO4, 1.25; NaHCO3, 24; MgCl2, 2; and CaCl2, 2. All extracellular solutions were bubbled continuously with 95% O2 and 5% CO2, resulting in a pH of 7.4. After an additional 30–60-min period of recovery at 33 °C, slices were incubated at room temperature until they were transferred to the recording chamber.
Electrophysiological recordings
Cell-attached and somatic whole-cell voltage recordings were performed at 33–36 °C. Cells were identified with an infrared differential interference contrast or an oblique illumination technique using an Olympus BX50WI microscope and a 40× water-immersion objective. Recordings were carried out from somata with a diameter of > 10 μm and with a juxtaglomerular location [within the GL or at the border of external plexiform layer (EPL) and GL, but not in the EPL]. Cells were recorded with a potassium gluconate-based intracellular solution (containing, in mm: K-gluconate, 120; KCl, 5; MgCl2, 2; EGTA, 0.05; HEPES, 10; Mg-ATP, 2; Mg-GTP, 0.4; creatinine phosphate, 10; and biocytin, 5.3–8; pH 7.25, osmolarity 270–290 mOsm). Recordings were performed with a MultiClamp 700A amplifier (Axon Instruments, Foster City, CA, USA). Patch pipettes (3–8 MΩ) were pulled (Zeitz Universal Puller; Zeitz-Instrumente Vertriebs, Munich, Germany) from thick-walled borosilicate glass capillaries with an inner filament (1.5 mm outer diameter, 0.86 mm inner diameter; Sutter Instruments, Novato, CA, USA). Trains of action potentials (APs) were evoked by injecting 1-s-long depolarizing current pulses of different amplitudes (20–200 pA). The passive membrane properties were derived from single exponentials fitted to traces of membrane voltage responses to small (1–20 pA, 400 ms) hyper- and depolarizing current injections. For testing the subthreshold resonance properties, 2-s-long sinusoidal (0.5–60 Hz) currents (amplitudes from 5 to 40 pA) were injected into the cells. The peak amplitude of the fast Fourier transform of the voltage responses were then compared to that of a single-compartment passive RC model cell (Fig. 1), which was generated in Berkeley Madonna 8.0.1 (written by R. I. Macey and G. F. Oster at UC Berkeley, CA, USA). Data were digitized on-line at 10 or 20 kHz, and analysed with EVAN 1.3 (Nusser et al., 2001) and with an in-house analysis software (SPIN 1.0.1) written in Matlab (Matlab 7.0; The MathWorks Inc., Natick, MA, USA). All measured physiological parameters are listed in Table 1. All chemicals were purchased from Sigma.
Fig. 1.
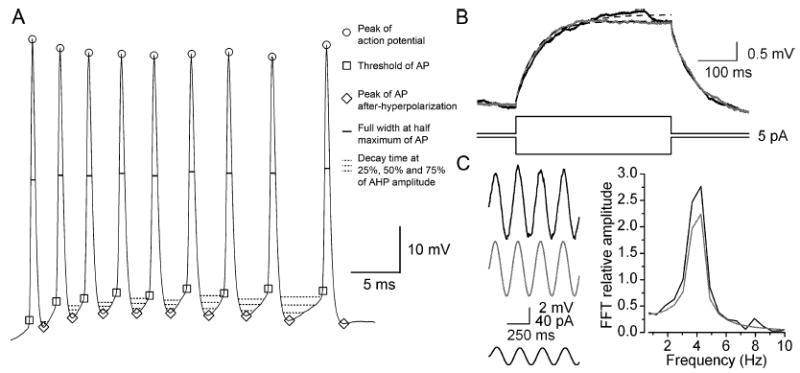
Measurements of physiological properties of ETCs. (A) Somatic DC current injection-evoked spike train is shown. Parameters such as the AP threshold, peak amplitude, full width at half maximum, AP afterhyperpolarization amplitude and width at 25, 50 and 75% decay were automatically measured with custom-made software. (B) Passive membrane properties (Rin and τ) of ETCs were derived from single exponential fits (broken lines) to averaged (of 50–100 traces) voltage responses to small (1–20 pA, 400 ms) hyper- (shaded trace, inverted) and depolarizing (solid trace) current injections. (C) For testing subthreshold resonance, 2-s-long sinusoidal currents (0.5–60 Hz, 5–40 pA, 2 s) were injected into the cells (bottom solid trace). The voltage responses of the cells (solid trace) were then compared to responses of a single-compartment model cell with passive membrane properties (shaded trace) following fast Fourier transformation. (ETC response, solid; passive model, shaded).
Table 1.
Selection of functional parameters
|
P-values
|
||||
|---|---|---|---|---|
| Paired comparison, beginning vs. end of recording
|
||||
| Functional parameters | Parameters independent of both the amplitude of injected current and the elapsed time | Regression analysis of independence of injected current, Pearson’s R correlation | Sign test | Paired t-test |
| Input resistance | Yes | – | 0.405 | – |
| Membrane time constant | Yes | – | 0.868 | – |
| Threshold of first AP | Yes | 0.584 | – | 0.220 |
| Peak amplitude of first AP | No | 0.579 | – | 0.000 |
| Full width at half maximum of first AP | No | 0.259 | 0.006 | – |
| Amplitude of AHP of first AP | Yes | 0.136 | – | 0.560 |
| Decay time at 25 % of AHP amplitude of first AP | No | 0.007 | 0.360 | – |
| Decay time at 50 % of AHP amplitude of first AP | No | 0.005 | 0.542 | – |
| Decay time at 75 % of AHP amplitude of first AP | No | 0.007 | 0.877 | – |
| First ISI | No | 0.004 | 0.291 | – |
| Threshold of last AP | Yes | 0.020 | – | 0.880 |
| Peak amplitude of last AP | No | 0.305 | – | 0.000 |
| Full width at half maximum of last AP | No | 0.410 | 0.095 | – |
| Amplitude of AHP of last AP | Yes | 0.739 | – | 0.263 |
| Decay time at 25 % of AHP amplitude of last AP | No | 0.737 | 0.440 | – |
| Decay time at 50 % of AHP amplitude of last AP | No | 0.475 | 0.542 | – |
| Decay time at 75 % of AHP amplitude of last AP | No | 0.265 | 0.222 | – |
| Last ISI | No | 0.169 | 0.175 | – |
| Ratio of last and first ISI | Yes | 0.061 | 0.651 | – |
| Ratio of thresholds of last and first AP | No | 0.000 | 0.877 | – |
| Ratio of peak amplitude of last and first AP | No | 0.007 | 0.000 | – |
| Ratio of FWHMs of last and first AP | Yes | 0.011 | – | 0.519 |
| Ratio of AHP Amplitude of last and first AP | Yes | 0.093 | – | 0.014 |
| Mean of ISI distribution | Yes | 0.082 | 0.880 | – |
| Maximum of ISI distribution | Yes | 0.203 | 0.880 | – |
| Minimum of ISI distribution | No | 0.009 | 0.291 | – |
| Coefficient of variance of ISI distribution | Yes | 0.524 | 0.880 | – |
Pearson’s regression analysis was used to ensure that the parameters used to characterize the cells did not depend on the amplitude of the injected current. To ensure that the parameters were not influenced by the elapsed time during the whole-cell recordings, they were compared at the beginning and at the end of the recording period with either parametric (paired t-test) or nonparametric (Sign-test) tests as appropriate (following Shapiro–Wilk’s normality test, at P < 0.01). Despite P-values > 0.01, the full width at half maximum of the last AP, the decay times at 25%, 50% and 75% of AHP of the last AP and last ISI were not included in our analysis, as they were not included for the first AP either.
Recorded cells: visualization and reconstruction
After recordings, slices were placed in a fixative containing 4% paraformaldehyde, 1.25% glutaraldehyde and 15 v/v% picric acid in 0.1 m phosphate buffer (PB; pH 7.4) at 4 °C. Before processing, the fixative was thoroughly washed out with 0.1 m PB. Slices were then cryoprotected in 10 and 20% sucrose solutions (in 0.1 m PB) for 45 min followed by freezing in liquid nitrogen and thawing in PB. After several washes in PB, slices were embedded in gelatin and re-sectioned at 60 μm thickness. Biocytin was visualized using avidin–biotin–horseradish peroxidase complex (Vector Laboratories, Burlingame, CA, USA) followed by a reaction with 3′3-diaminobenzidine tetrahydrochloride (0.05% solution in Tris buffer, pH 7.4) as chromogen and 0.01% H2O2 as oxidant for 12 min. Sections were then postfixed in 1% OsO4 for 20 min, stained in 1% uranyl acetate for 40 min, dehydrated in a graded series of ethanol, and embedded in epoxy resin (Durcupan). Labeled cells were identified as ETCs from their size, the location of their somata and the extensive ramification of their apical dendrites in one or occasionally more than one glomerulus. Neurons with no obvious truncations in their dendrites were fully reconstructed with the NeuroLucida system (Micro-BrightField Europe, Magdeburg, Germany) attached to a Zeiss Axioscope 2 microscope using a 100× oil-immersion objective, and were subjected to morphometric measurements available within the software (the measured parameters are listed in Fig. 6B). Because of the frequent truncations of the axons, the axonal arborizations were not analysed quantitatively.
Fig. 6.
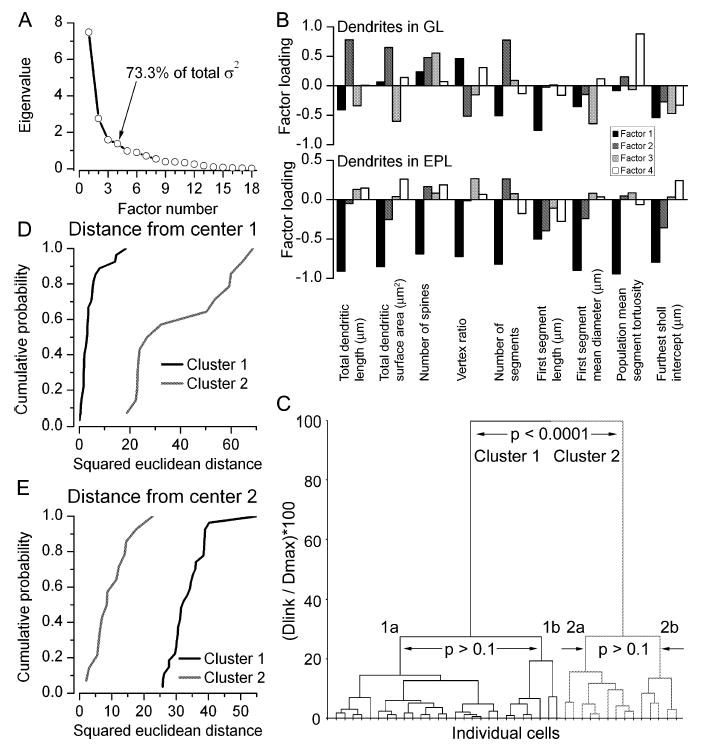
PCA and cluster analysis of the recorded cells based on their morphological properties. (A) Scree plot of the eigenvalues derived from PCA of the 18 morphological parameters. The first four factors had eigenvalues > 1, and together account for 73.3% of the total variance. (B) Factor loading plots demonstrate the contribution of the 18 variables, nine for dendrites in the GL and nine for dendrites in the EPL, to each of the four factors. (C) Joining tree of agglomerative clustering using the first four principal component factor scores for each cell. Individual cells are shown on the x-axis. Clusters 1 and 2 are significantly different from each other. However, further subdivision of the clusters is not justified (neither clusters 1a and 1b nor clusters 2a and 2b are significantly different). (D) Cumulative probability plot of squared Euclidean distances of cells in clusters 1 (solid) and 2 (shaded) from the centre of cluster 1. (E) Cumulative probability plot of squared Euclidean distances of cells in clusters 1 (solid) and 2 (shaded) from the centre of cluster 2; σ2, variance. The vertex ratio is a measure of the branching pattern of the dendrites; tortuosity is the ratio of the length along a dendritic segment to the shortest distance in 3-D between the two ends of the segment; furthest Sholl intercept is the radius of the largest virtual sphere centred on the soma that is still intercepted by the dendrite. Dlink, linkage distance; Dmax, maximum linkage distance.
Statistical procedures
All data are expressed as mean ± SD throughout the manuscript. To ensure that variability in the physiological parameters was not the consequence of different time elapsed from the establishment of the whole-cell configuration, we measured all active and passive electrical properties at the beginning and at the end of the whole-cell recording period. Following a Shapiro–Wilk normality test, either a paired t-test or a sign test was used to compare data measured at the beginning and at the end of the recording. Parameters that significantly (P < 0.01) changed during the whole-cell recordings were discarded from our analysis (see Table 1). Pearson’s regression analysis was used to determine whether the measured physiological parameters depended on the amplitudes of the injected current (20, 40 and 70 pA). Parameters where a significant correlation (P < 0.01) was found were discarded from our analysis (see Table 1). PCA (Joliffe & Morgan, 1992) and agglomerative clustering methods were carried out with Statistica 6.0 (StatSoft, Inc., Tulsa, OK, USA). Breifly, the aim of PCA is to reduce the number of parameters describing a population to a smaller number of ‘factors’, which account for a large fraction of the total variance in the population. Only factors with large eigenvalue (usually > 1) are selected to represent the population. PCA also transforms the data to standard scores, removing any potential bias due to the fact that parameters are in different units. Agglomerative or joining clustering was employed to group data (PCA factors) without any a priori assumption concerning the number of clusters. Dissimilarities between cells were measured as Euclidean distances and Ward’s amalgamation rule was used to determine cluster linkage. The joining tree indicated clusters of differing sizes depending on the degree of dissimilarity. To determine the number of clusters that were statistically different from one another, we calculated the squared Euclidean distance of each cell from the centre of each cluster. The coordinates of each cluster centre in a multidimensional space along each axis (i.e. for each factor used in the clustering) were calculated as the average of each factor score for cells assigned to that cluster by the joining tree. Distances of cells in each cluster from each centre were then compared. Specifically, we first tested the validity of two clusters by calculating the centres of clusters 1 and 2, and then the distances of each member from each centre. By using the Mann–Whitney U-test, we statistically compared the mean distance of the members of clusters 1 and 2 from the centre of cluster 1 (e.g. Figures 2D, 6D and 9C). Then the reverse comparison was carried out (members of clusters 1 and 2 from the centre of cluster 2; Figs 2E, 6E and 9D). If both of these tests were statistically significant (P < 0.001) then we would conclude that ETCs form two subpopulations. Subsequently, a similar statistical comparison was carried out with three clusters, four clusters, etc. using a Kruskal–Wallis nonparametric test and, if significant, a post hoc test (multiple comparisons of mean ranks for all groups) was used to decide whether groups were different or not. None of our analyses revealed three or more subpopulations with significant difference between all subgroups.
Fig. 2.
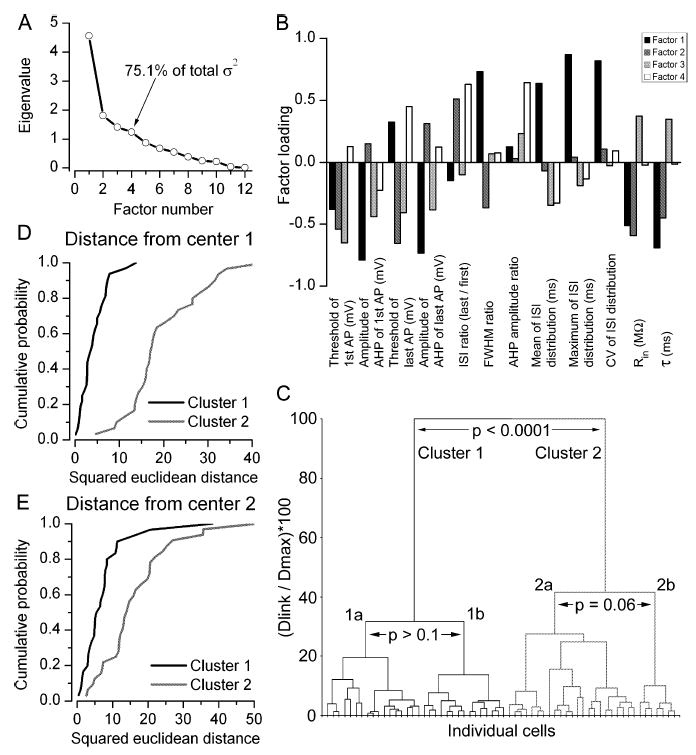
PCA and cluster analysis of the recorded cells based on their physiology parameters. (A) Scree plot of the eigenvalues derived from PCA of 12 physiological parameters. The first four factors had eigenvalues > 1 and together accounted for 75.1% of the total variance. (B) Factor loading plot showing the contribution of the 12 physiological parameters to each of the first four factors. (C) Joining tree of agglomerative clustering using the first four principal component factor scores for each cell. Individual cells are illustrated on the x-axis and the y-axis shows the percentage of the maximum Euclidean distance between any two cells. Clusters 1 and 2 differ significantly from each other. (D) Cumulative probability plots of squared Euclidean distances of each cell in clusters 1 (solid) and 2 (shaded) from the centre of cluster 1. The distributions are statistically significantly different (P < 0.001, Mann–Whitney test). (E) Similar plot as in panel D, but distances of cells in clusters 1 and 2 are shown from the centre of cluster 2. The distributions are statistically significant (P < 0.001, Mann–Whitney test). σ2, variance; FWHM, full width at half maximum amplitude; Dlink, linkage distance; Dmax, maximum linkage distance.
Fig. 9.
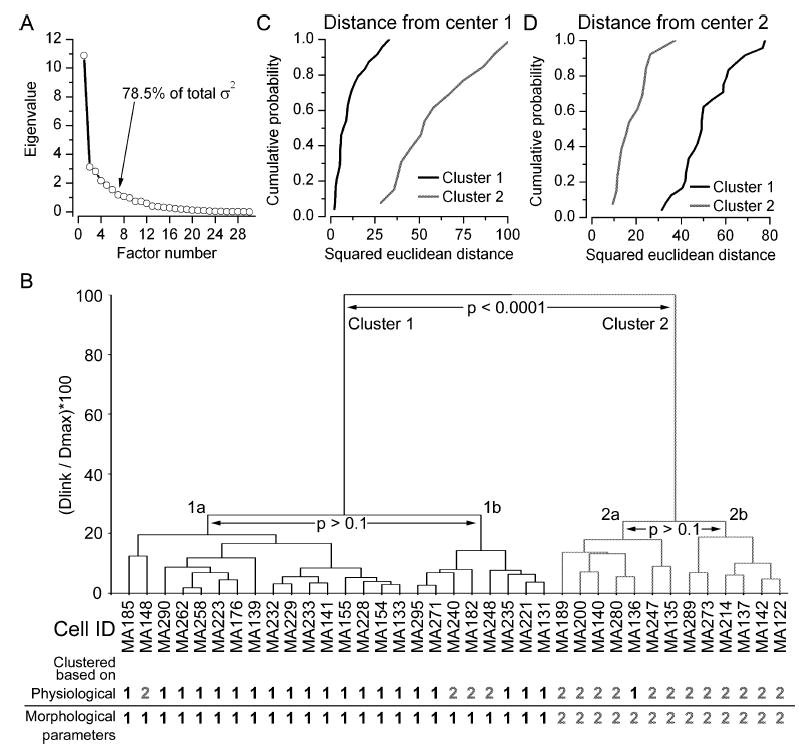
PCA and cluster analysis of the recorded cells based on both physiological and morphological properties. (A) Scree plot of the eigenvalues derived from PCA of the 30 variables (12 functional and 18 structural). The first seven factors together accounted for 78.5% of the total variance. (B) Joining tree of agglomerative clustering using the first seven principal component factor scores for each cell (37 cells in total for which all 30 parameters were determined). The individual cells are shown on the x-axis and the normalized maximum Euclidean distances between any two cells are shown on the y-axis. At the bottom, the group membership of each cell is shown based on clustering of either only the physiological or only the morphological parameters. Note the almost perfect matching between the three ways of clustering. (C) Cumulative probability plot of squared Euclidean distances of cells in clusters 1 (solid) and 2 (shaded) from the centre of cluster 1. (D) Cumulative probability plot of squared Euclidean distances of cells in clusters 1 (solid) and 2 (shaded) from the centre of cluster 2. The distributions in both panels C and D are significantly different from each other (Mann–Whitney, P < 0.001). σ2, variance; Dlink, linkage distance; Dmax, maximum linkage distance.
Results
Active and passive electrical properties of ETCs
To ensure an unbiased, representative sampling of the ETC population, we randomly selected JGCs with somatic diameter > 10 μm without any additional selection criterion (e.g. soma shape, number of emerging dendrites, etc.). We paid particular attention to ensure that we selected only cells with their soma located in the GL (surrounded by other JGC somata) and not in the EPL. All cells were filled with biocytin and were subject to post hoc morphological identification.
Several cells with somatic diameter of > 10 μm were subsequently identified as short-axon cells, which were discarded from the present study (i.e. only anatomically identified ETCs are included in the present study). First we assessed the spontaneous spiking activity of the ETCs in cell-attached recording configuration. The recorded cells displayed large heterogeneity based on their spontaneous firing behaviour. A large proportion of the cells (57%) fired bursts of APs (from 0.03 to 8 Hz; see Hayar et al., 2004b), some (25%) fired individual APs at frequencies ranging from 0.1 to 38 Hz, and the remaining 18% of the cells were completely silent. This spontaneous activity was also observed during the first minute of whole-cell recordings, similar to that found by Hayar et al. (2004b). When a cell showed spontaneous suprathreshold activity, small hyperpolarizing DC current was injected to keep the membrane potential just below firing threshold. Under such conditions, trains of APs were evoked by injecting 1-s-long depolarizing currents of different amplitudes into the cells (Fig. 1). The firing patterns of ETCs were extremely diverse (Fig. 3); qualitative descriptions commonly used to characterize such patterns are regular spiking, irregular spiking with accomodation, and burst firing. Eighty-eight per cent of the cells which showed spontaneous bursting in the cell-attached configuration also displayed bursts of APs upon DC current injections. In 82% of the cells that did not fire bursts spontaneously, somatic current injections evoked regular and irregular firing patterns. Of the silent cells, 37.5% fired bursts of APs and the remaining 62.5% were nonbursting following somatic current injections. To quantitatively characterize the spikes of ETCs, we measured (Fig. 1A) the threshold, peak amplitude, full width at half maximum of the first and last APs of the train, amplitude of spike afterhyperpolarization (AHP) and decay times at 25, 50 and 75% of AHP amplitude after the first and last AP. The ratios of these values were also calculated (parameter X of last spike divided by that of the first spike). In addition, the first and last interspike intervals (ISI) were measured and their ratio was calculated. In the case of burst firing cells the first and last ISIs of the first burst were measured, but all ISIs (intra- and interburst) were used to generate the ISI distribution (see below). To characterize the firing patterns of ETCs we calculated the mean, maximum, minimum and coefficient of variation (CV) of the ISI distributions. These parameters allow distinctions to be made among qualitatively different firing patterns. For example, a bursting pattern would result in very different minimum and maximum ISI values and as a consequence a large CV of the ISI distribution. In contrast, a regular firing pattern would be characterized by similar maximum and minimum ISI values, resulting in a small CV of the ISI distribution. Dissimilarities in individual spike shape, spike frequency adaptation and AP amplitude accommodation are also reflected by our measurements. The membrane time constant (τ) and the input resistance (Rin) of the cells were also measured (Fig. 1B) and revealed tremendous heterogeneities: τ ranging from 5.7 to 63.7 ms with a CV of 0.71 and Rin spanning 43–990 MΩ with a CV of 0.6. We also characterized the cells with respect to their intrinsic, subthreshold resonant properties (Fig. 1C and Materials and Methods). In one-fourth of the cells no active resonance was found at the frequencies tested whereas, in the rest of the cells, the peak resonant frequency varied from 1 to 10 Hz (Fig. 5).
Fig. 3.
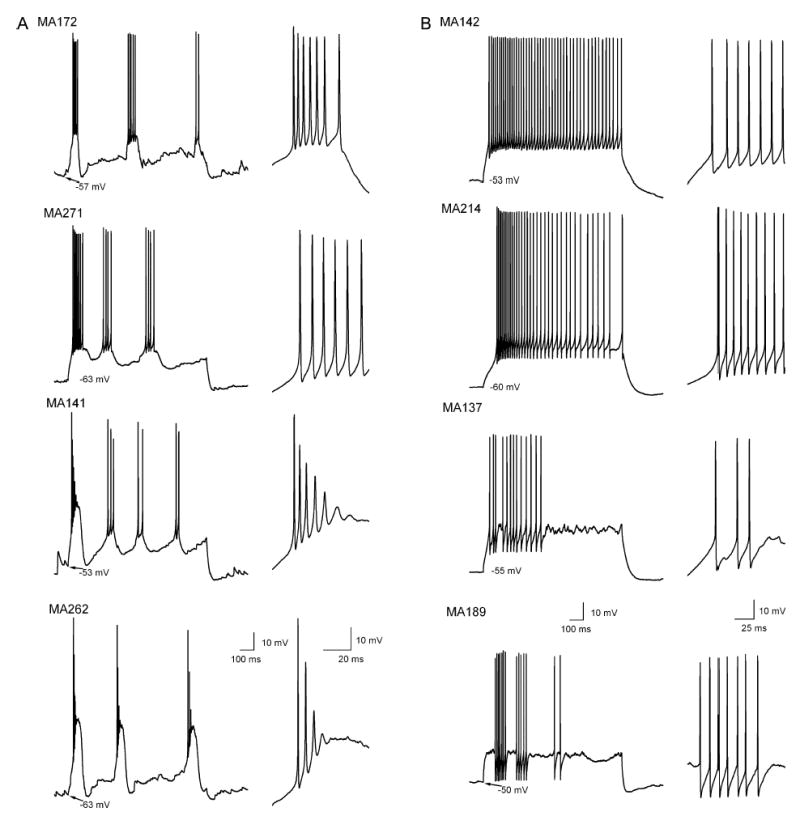
Diverse AP firing patterns of individual ETCs. Whole-cell voltage recordings of suprathreshold responses to depolarizing current injections from ETCs. Although the firing patterns of the members of (A) cluster 1 are clearly different from those in (B) cluster 2, large within-group variability is also apparent. In all panels, the first part of the trace is shown on an expanded timescale on the right.
Fig. 5.
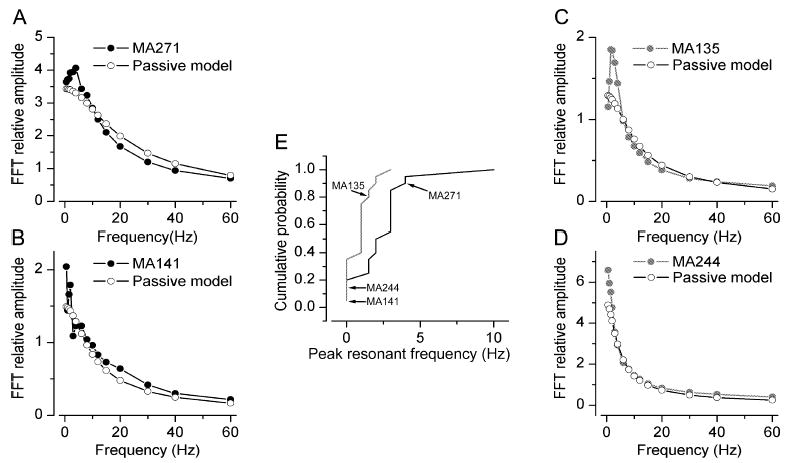
ETCs significantly differed with regard to their subthreshold resonant behaviour. (A–D) Plots of frequency against fast Fourier transform relative amplitude for four individual cells (solid and shaded symbols). For comparison the behaviour of passive model cells are shown (open symbols). The peak resonant frequency was determined from these plots. Cells in panels A and B belong to cluster 1 and those in C and D to cluster 2. (E) Cumulative probability plot of peak resonant frequencies for cells in cluster 1 (solid) and cluster 2 (shaded). The two subpopulations are significantly different (P < 0.002, Mann–Whitney U-test).
Next, we discarded those measured and calculated parameters that showed an obvious dependence on two important experimental variables. Those parameters that significantly changed as a function of elapsed time from the establishment of the whole-cell configuration were discarded. All parameters were statistically compared between the beginning (first 3.5 ± 1.2 min) and at the end (10 ± 3 min later) of the recording periods (Table 1). We also tested whether the measured and calculated parameters depended on the amount of injected current to evoke the spike trains. If regression analysis yielded a significant correlation between a parameter and the amount of current injected, the parameter was discarded. Following these selection criteria, twelve physiological parameters remained and were used for quantitative characterization of ETCs (Table 1).
Presence of two subpopulations of ETCs based on their physiological properties
To determine whether ETCs form multiple subpopulations based on their active and passive electrical properties or whether a single heterogeneous population exists, we performed PCA and cluster analysis (Fig. 2). Because the number of available cells (62 in total) is likely to be insufficient for clustering in a 12-dimensional space, PCA of the parameters was first carried out. As shown in the scree plot in Fig. 2A, the first four factors had eigenvalues of > 1 and accounted for > 75% of the total variance; therefore they were selected for subsequent cluster analysis. Agglomerative clustering revealed a joining tree with two dominant and several additional subbranches (Fig. 2C). Next we developed a method of objective determination of the number of distinct subpopulations following such clustering (see Materials and methods). We considered two clusters significantly different in an n-dimensional space if the distance of the members of cluster 1 from the centre of cluster 1 was significantly smaller than the distance of the members of cluster 2 from the centre of cluster 1, and vice versa. By performing this analysis on ETCs based on the first four factors obtained with PCA, we found that two clusters differed significantly (Fig. 2D and E), but additional subdivisions (into 3, 4 … clusters) were not supported statistically.
So far, our results demonstrate the presence of two subpopulations of ETCs based on PCA factors calculated from parameters describing the intrinsic electrical properties of the cells. Next we asked how different the individual active and passive electrical properties between the two subpopulations were. Statistical comparisons revealed that (i) the threshold of the first AP (cluster 1, −36.1 ± 3.7 mV vs. cluster 2, −33.3 ± 4.9 mV; Fig. 4B); (ii–iii) the amplitude of the AHP after the first (4.5 ± 4.0 vs. 13.3 ± 4.6 mV; Fig. 4A) and last (7.2 ± 3.8 vs. 14.3 ± 3.7 mV) APs; (iv) the ratio of the last and first spike width (1.5 ± 0.4 vs. 1.1 ± 0.1); (v–vii) the mean (77.6 ± 35.2 vs. 39.8 ± 18.7 ms), maximum (319.6 ± 140.3 vs. 104.1 ± 71.4 ms) and CV (1.6 ± 0.5 vs. 0.6 ± 0.5; Fig. 4D) of the ISI distributions; and (viii) the membrane time constants (13.6 ± 6.5 vs. 27.8 ± 17.2 ms; Fig. 4C) were significantly different between the two subpopulations. Qualitatively, the most prominent difference between the two subpopulations was that all members of cluster 1 fired bursts of APs whereas those of cluster 2 had regular or irregular firing patterns (Fig. 3) and did not change to burst firing when hyperpolarized to −60 mVor more negative membrane potentials. However, it is important to note that members of each subpopulation displayed large variability based on several parameters. For example, cells in cluster 1 showed large variability in the degree of the spike amplitude accommodation (Fig. 3A) or the amplitude of the AHP (Figs 3A and 4A). Cells belonging to cluster 2 displayed very different spike frequency adaptations (Figs 3B and 4D), amplitude and time course of AHP (Figs 3B and 4A) or τ (Fig. 4C). The peak resonance of the cells was also significantly different; cells in cluster 1 displayed a higher peak resonant frequency (Fig. 5; 2.5 ± 2.2 vs. 0.9 ± 0.8 Hz). However, as shown in the cumulative probability plot in Fig. 5E, both subpopulations had cells without detectable subthreshold resonance (Fig. 5B and D), but cells that showed active subthreshold resonance had a higher peak frequency in cluster 1.
Fig. 4.
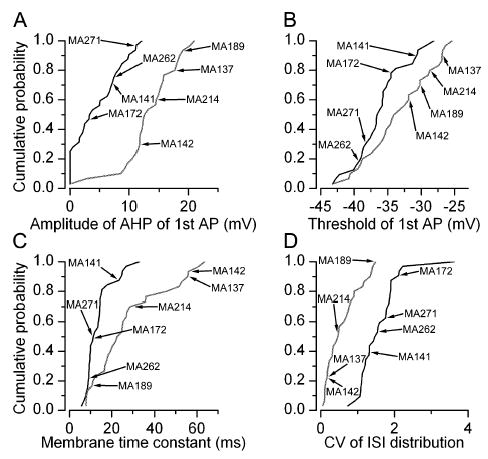
Between- and within-cluster variability in physiological parameters. (A–D) Cumulative probability plots of four parameters (cluster 1, solid; cluster 2, shaded), showing significant difference between the two ETC subpopulations. Each parameter varied considerably within each cluster (CVs ranging from 0.34 to 0.88), resulting in some overlap between the subpopulations. The positions of the cells illustrated in Fig. 3 are marked in each panel.
Quantitative characterization of ETCs based on their dendritic arborizations
Following the recordings, biocytin was visualized and the cells were analysed at the light microscopic level and were judged for completeness. Cells with incomplete filling or with truncations in their dendritic tree were discarded from our quantitative morphological analysis. However, if a cell showed signs of obvious truncation (e.g. secondary dendrites), but could be still positively identified as an ETC (e.g. from the soma and apical tuft), it remained in our study for physiological analysis only. The most noticeable difference between ETCs was the presence of secondary, basal dendrites in approximately one-third of the cells (14 out of 41 cells; Fig. 7). The branching patterns of the basal dendrites were dissimilar; some cells had a nonextensively branching large diameter basal dendrite, spanning a large distance only in one direction from the soma (Fig. 7B, bottom panel), whereas in some other cells the basal dendrites extensively branched and symmetrically occupied the EPL below the cell (Fig. 7B, top and middle panels). Several additional morphological differences were also observed, including the presence of apical dendrites ramifying in two glomeruli and large differences in the extent of arborization of the apical dendritic tufts and in the branching patterns (e.g. funnel shaped with relatively few branches vs. globular shaped with extensive branching; Figs 7 and 8A and B). Cells also had very different axonal arborizations; some emitted a large number of collaterals in the GL and EPL before entering the internal plexiform and granule cell layers whereas some others crossed through the EPL with little branching (Fig. 7). Because we hardly ever found cells without truncation in their axonal arbors, the quantitative characterization of the ETCs was based exclusively on their dendritic morphologies. Forty-one cells with complete filling and no obvious dendritic truncations were reconstructed using the Neurolucida system. To quantitatively describe differences in the dendritic arborizations among ETCs, we measured and calculated nine parameters for the apical as well as the basal dendrites (Fig. 6B). For example, dendritic tufts with extensive branching could be easily discriminated from fan-shaped tufts by calculating the number of segments and the total dendritic length. Cells with similar total dendritic length but very different density of branches can be distinguished by the furthest Sholl intercept and from the mean segment tortuosity. We are confident that these measured parameters are sufficient to discriminate between qualitatively dissimilar dendritic patterns and provide similar values for visually similar dendritic arbors. To reduce the number of dimensions within which clustering was carried out, we performed PCA of the 18 anatomical parameters. The scree plot in Fig. 6A indicates that four factors had eigenvalues > 1, accounting for > 73% of the total variance. Agglomerative clustering using the first four PCA factor scores for each cell revealed two main branches on the joining tree with several additional subbranches (Fig. 6C). Similar statistical analysis to that performed above indicated the presence of two subpopulations of ETCs based on their dendritic arborization patterns (Fig. 6C–E). To determine the morphological parameters that are significantly different between the two ETC subpopulations, we performed a between-groups statistical comparison for each variable. Fifteen out of the 18 variables differed significantly (P < 0.05) between the groups (Table 2).
Fig. 7.
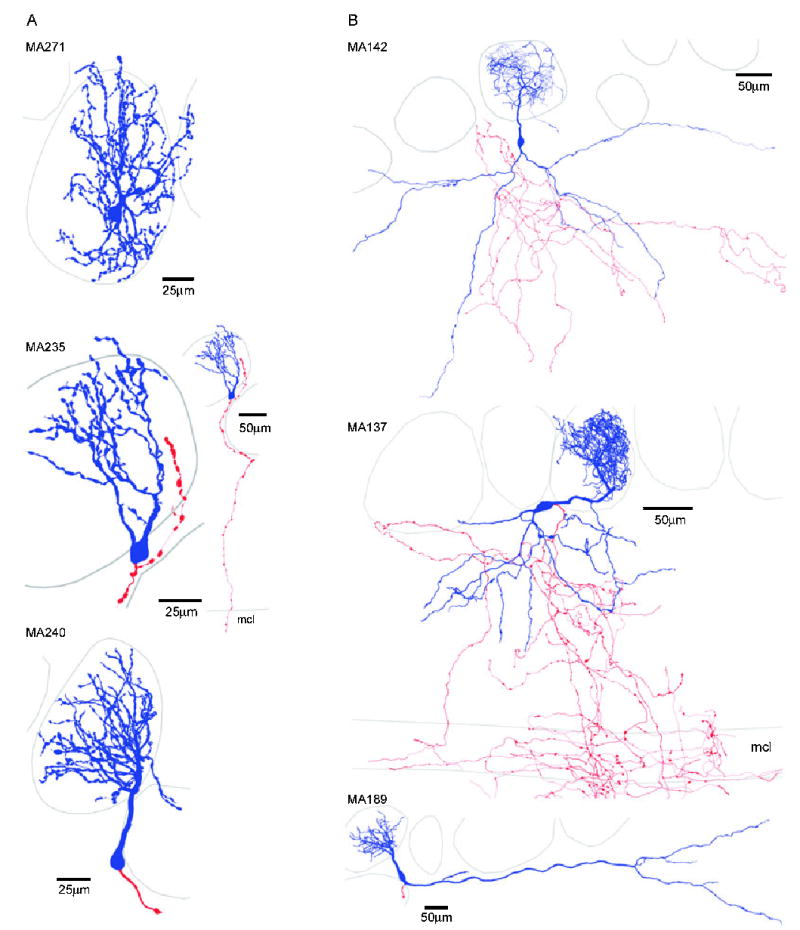
ETCs possessed distinct dendritic arborization patterns. Two-dimensional projections of 3-D reconstructed ETCs with somata and dendrites indicated in blue and the axon in red. The most pronounced difference between the cells in (A) cluster 1 and (B) cluster 2 was the absence of basal dendrites in the EPL of the cells in cluster 1. Cells within each subpopulation showed large diversity based on the total length, number of segments and arborization pattern of their apical tufts. The basal dendrites of ETCs in cluster 2 could also be remarkably different. Note the extensive axonal arbors of MA137 and MA142 in the EPL, MCL, IPL and GCL. The axon of MA235 also projected out through the EPL and MCL. The physiological properties of some of these cells are illustrated in Figs 3–5.
Fig. 8.
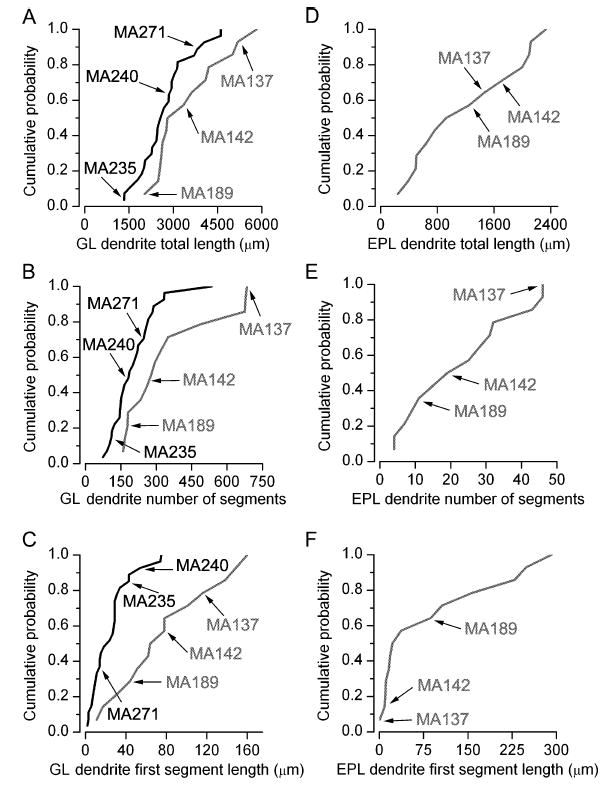
Quantitative comparisons of the morphological parameters between and within ETC subpopulations. Fifteen out of 18 parameters significantly differed between clusters 1 (solid) and 2 (shaded). Some of these parameters include the total dendritic length in (A) GL and (D) EPL, the number of dendritic segments in (B) GL and (E) EPL, and the first segment length in (C) GL and (F) EPL. Each parameter varied considerably within each subpopulation (CVs ranging from 0.32 to 1.15). (D–F) Cumulative probability distributions of EPL dendrites of cells in cluster 1 are not shown because they lacked such dendrites.
Table 2.
Parameters describing the dendritic arborization pattern of ETCs
| Cluster 1
|
Cluster 2
|
|||
|---|---|---|---|---|
| Morphological parameters | Mean ± SD | (Range) | Mean ± SD | (Range) |
| Dendrites in the GL | ||||
| Total length (μm) | 2719 ± 876 | (1337–4613) | 3512 ± 1180* | (2029–5834) |
| Total surface area (μm2) | 10385 ± 4085 | (5201–21973) | 9054 ± 2571 | (5087–16052) |
| Number of spines | 55 ± 60 | (4–242) | 26 ± 24* | (2–76) |
| Vertex ratio | 0.922 ± 0.236 | (0.377–1.425) | 0.718 ± 0.143* | (0.513–0.938) |
| Number of segments | 206 ± 98 | (74–535) | 353 ± 197* | (160–684) |
| First segment length (μm) | 25 ± 20 | (2–75) | 79 ± 48* | (11–160) |
| First segment mean diameter (μm) | 3.09 ± 1.00 | (1.30–6.50) | 3.68 ± 1.03 | (2.25–5.40) |
| Population mean segment tortuosity | 1.57 ± 0.32 | (1.27–2.45) | 1.58 ± 0.39 | (1.31–2.70) |
| Furthest Sholl intercept (μm) | 139 ± 29 | (90–210) | 172 ± 33* | (130–240) |
| Dendrites in the EPL | ||||
| Total length (μm) | – | – | 1211 ± 736* | (242–2335) |
| Total surface area (μm2) | – | – | 4727 ± 3562* | (726–12341) |
| Number of spines | – | – | 8 ± 9* | (0–35) |
| Vertex ratio | – | – | 0.92 ± 0.73* | (0.00–2.00) |
| Number of segments | – | – | 23 ± 15* | (4–46) |
| First segment length (μm) | – | – | 89 ± 102* | (1–292) |
| First segment mean diameter (μm) | – | – | 2.50 ± 1.02* | (1.00–4.00) |
| Population mean segment tortuosity | – | – | 1.41 ± 0.33* | (1.09–2.02) |
| Furthest Sholl intercept (μm) | – | – | 362 ± 226* | (130–860) |
P < 0.05, Cluster 1 vs. Cluster 2, Mann–Whitney or t-test. Cluster 1 contains 27 and Cluster 2 14 ETCs. Vertex ratio, a measure of the branching pattern of the dendrites; tortuosity, ratio of the length along a dendritic segment and the shortest distance in 3-D between the two ends of the segment; furthest Sholl intercept, radius of the largest virtual sphere centred on the soma that is still intercepted by the dendrite.
These results demonstrate that most of the measured morphological parameters are significantly different between the two ETC subpopulations. However, similarly to the physiological parameters, large within-group variability was observed for most measurements (Fig. 8), indicating that ETCs within each subpopulation are highly heterogeneous.
Comparing physiologically and morphologically determined ETC subpopulations
Finally, we asked how the two morphologically determined ETC subpopulations correspond to those derived from the physiological properties. To address this question, we restricted our analysis to a total of 37 ETCs in which all 30 (12 physiological and 18 morphological) parameters were determined (Fig. 9). PCA indicated seven factors with eigenvalues of > 1 (Fig. 9A), accounting for 78.5% of the total variance. Agglomerative clustering showed a joining tree with two major branches. The presence of two subpopulations was statistically confirmed (Fig. 9C and D). When the position of each individual cell was compared, a perfect match was found between the anatomically determined groups and the groups based on all parameters (Fig. 9B). This could be the consequence of a large dominance of the anatomical parameters in the first seven factors derived from PCA. However, a very close agreement between the results of clustering based on all parameters and only the physiological parameters was also observed. Only one cell (MA136) was clustered into the first group based on its physiological properties but was clustered to the second group when all parameters were taken into account. The rest of the cells (20) in the first cluster based on the electrophysiological properties alone were also in the first cluster based on all parameters. Our results demonstrate that a number of electrophysiological (e.g. burst firing) and morphological (e.g. lack of basal dendrites) parameters of ETCs are highly predictive of one another.
Discussion
Our results demonstrate the presence of two subpopulations of ETCs of the rat MOB based on their active and passive intrinsic electrical properties and their dendritic morphologies. Although 24 out of the 30 measured parameters significantly differed between the two ETC subpopulations, qualitatively the most prominent differences between them were the presence and absence of basal dendrites and the lack and presence of AP bursting, respectively. Although our quantitative analysis indicated the existence of only two ETC subpopulations, a large heterogeneity in both physiological and morphological properties within each subpopulation was apparent. We propose that the two ETC populations serve very different roles in the MOB circuit, and the within-group heterogeneity is the reflection of further specialization evolved to fulfil less prominent functional requirements.
The morphological heterogeneity of ETCs has long been described and the existence of three subtypes has been proposed. The first detailed investigation of the dendritic arborizations of ETCs was carried out by Macrides & Schneider (1982) using the Golgi impregnation technique. They concluded that ETCs are comprised of three subpopulations: the first group of ETCs lack secondary dendrites, ETCs in the second group have extensively branched, spatially restricted secondary dendrites, and the third group have sparsely branched secondary dendrites, which extend tangentially in one direction from the soma. Our morphological results are in perfect agreement with the presence of these morphological features (Fig. 7), tempting the division of ETCs into these three categories. However, unsupervised cluster analysis revealed only two subpopulations of ETCs; differences between ETCs with extensively or sparsely branched secondary dendrites were not significant. Macrides & Schneider (1982) have also suggested that ETCs that lack secondary dendrites have a larger glomerular arbor than those with secondary dendrites. Their conclusion was based on the measured area of the two-dimensional projection of the apical dendrites. The results of our quantitative analysis are in disagreement with their conclusion, because detailed three-dimensional measurements of the total dendritic length, the number of segments and the largest extent (Sholl max) of the dendrites in the GL have revealed significantly smaller values for cells in cluster 1 (without basal dendrites) than in cluster 2 (Table 2). Differences in basal dendrites and in the sizes of their glomerular dendritic arbors might impart different functional characteristics to the two ETC subpopulations.
ETCs are not only heterogeneous based on their dendritic and axonal distributions, as they also express distinct sets of ion channels. The ionotropic GABAA receptor α1 and α3 subunits are differentially expressed by ETCs (Panzanelli et al., 2005). Some cells express only the α1, some others only the α3 and ~40% of the cells contain both of these α subunits. Interestingly, ETCs with secondary dendrites predominantly express the α3 subunit, resulting in a strongly immunoreactive dendritic plexus in the outer one-third of the EPL. A previous report from our lab also described that ETCs are heterogeneous with respect to their expression of the hyperpolarization activated and cyclic nucleotide-gated mixed cation channel 1 (HCN1; Holderith et al., 2003). Most of the HCN1 immunopositive ETCs do not seem to have basal dendrites, and are likely to belong to cluster 1.
In a recent study, Hayar et al. (2004b) have also investigated the morphological and electrophysiological properties of ETCs. Several of our findings are in perfect agreement, including (i) approximately one-third of the ETCs possess basal dendrites; (ii) basal dendrites show variable ramification patterns; (ii) the apical tuft of most ETCs arborizes in a single glomerulus, but a few per cent of the ETCs project their apical dendrites into two glomeruli; (iv) the extent of the intraglomerular arborization of the apical dendrites varies considerably (five-fold) from small fan-like tufts to extensive globular tufts; and (v) some cells project their axons towards the mitral cell and granule cell layer without extensive ramification; whereas (vi) some other ETCs had extensive local axon collaterals. Interestingly, despite the observed morphological heterogeneity of ETCs, Hayar et al. (2004b) described rather uniform electrophysiological properties of the ETCs. Most notably, they reported only burst firing behaviours irrespective of whether spontaneous activity was monitored in cell-attached mode or firing was evoked by current injections in the whole-cell configuration. Because they reported that one-third of their recorded cells had basal dendrites, but all cells showed bursting behaviour, it may be appropriate to designate cells with basal dendrites as also possessing bursting behaviour. This is in contrast with our results demonstrating that the majority of cells in cluster 2 (which all have basal dendrites) did not fire bursts of APs. This conclusion is consistent with the results of our cell-attached recordings, demonstrating that the majority of the cells with basal dendrites lack spontaneous bursts of APs, and thus cannot be the consequence of dialysis of the cells during whole-cell recordings. A possible reason for this discrepancy could be due to a subselection of ETCs recorded by Hayar et al. (2004b). As discussed above, we have taken the utmost care to avoid any bias in our sampling of juxtaglomerular cells with diameter > 10 μm. Another possible reason could be the different strain and age of the animals (Hayar, P21–29 Sprague–Dawley vs. our study, P26–78 Wistar). Some of the morphological features of cluster 2 cells are similar to some of the superficially located middle tufted cells (Macrides & Schneider, 1982) or, as another study calls them, ‘superficial’ tufted cells (Hamilton et al., 2005). However, one obvious difference between these cells and the ETCs in our study is that the somata of these cells are located in the EPL, whereas all cells of our study were in a juxtaglomerular position. Despite the different names, their functional roles could be very similar in olfactory processing. It is interesting to note that Hamilton et al. (2005) have described both bursting and nonbursting firing properties for ‘superficial’ tufted cells whereas, in our work, only a single cell in cluster 2 showed bursting behaviour; the rest displayed regular or irregular-accommodating firing patterns.
What could be the major functional differences between the two types of ETCs? As already discussed by Macrides & Schneider (1982), the main difference between ETCs with and without basal dendrites is their potential innervation and lack of innervation by granule cells, respectively. ETCs without secondary dendrites (cluster 1 in our study) are likely to receive GABAergic inputs only from periglomerular and short-axon cells onto their apical tufts. These cells could still receive feedforward and feedback inhibition, and could also sense the activity of some neighbouring glomeruli. However, ETCs with extensive secondary dendrites will also integrate feedback GABAergic inputs from granule cells and sample the neuronal activity from a much larger area of the bulb. Our results also revealed that these cells have significantly larger glomerular dendritic trees. If the two types of ETCs have similar synaptic densities per unit dendritic length, this would predict a more robust sensory innervation of ETCs with secondary dendrites. Our qualitative observation that ETCs with basal dendrites possess a much larger and more extensively ramifying local axonal arbor predicts an additional functional difference between the two types of ETCs. In summary, ETCs in cluster 2 are predicted to receive much more sensory input, form connections with a higher number of cells in the GL and EPL and sample the network activity through interacting with granule cells from a much larger area of the bulb. It has also been suggested that different ETC populations may be responsible for the commissural innervation of the contralateral MOB through the anterior olfactory nucleus pars externa and for the lateromedial intrabulbar associational connection on the opposite side of the same bulb (Schoenfeld et al., 1985). These pathways allow communication among principal cells via granule cells, suggesting a key role for ETCs in processing olfactory sensory information. Whether the two ETC subpopulations are responsible for this functional difference or whether cells within each subgroup participate in both commissural and associational projections remains to be determined. However, these authors also noted that most if not all ETCs in the superficial two-thirds of the GL have neither intrabulbar nor bulbofugal axonal projections. Interestingly, we found that most cells lacking basal dendrites (cluster 1) were recorded from such locations.
Another important feature of the ETCs with bursting firing pattern is that they show different subthreshold resonant behaviours than cells with basal dendrites. A larger proportion of the bursting cells have active resonance at the theta frequency range. In addition, a very significant proportion of these cells are spontaneously active at the theta frequency range even in in vitro slices, indicating that their activity could be associated with the theta rhythm (Adrian, 1950; Freeman, 1975; Laurent & Davidowitz, 1994). ETCs with basal dendrites have an intrinsic resonant frequency below 1 Hz, a frequency range which is below the frequency of local field potential oscillations observed in vivo (Adrian, 1950; Freeman, 1975; Laurent & Davidowitz, 1994). Thus, we predict that these ETCs may not participate in the theta frequency oscillation. Whether they are entrained to gamma frequency oscillations like mitral cells, middle or deep tufted cells (Desmaisons et al., 1999), or do not fire rhythmically at all, remains to be determined.
Acknowledgments
Z.N. is the recipient of a European Commission Integrated Project grant (EUSynapse project; LSHM-CT-2005–019055), a European Young Investigator Award, a Postdoctoral Fellowship from the Boehringer Ingelheim Fond and a Wellcome Trust project grant. The financial support from these Foundations is gratefully acknowledged. We would like to thank Dr Szabolcs Káli for advice and useful discussions concerning PCA and clustering analysis.
References
- Adrian ED. The electrical activity of the mammalian olfactory bulb. Electroencephalogr Clin Neurophysiol. 1950;2:377–388. doi: 10.1016/0013-4694(50)90075-7. [DOI] [PubMed] [Google Scholar]
- Aungst JL, Heyward PM, Puche AC, Karnup SV, Hayar A, Szabo G, Shipley MT. Centre-surround inhibition among olfactory bulb glomeruli. Nature. 2003;426:623–629. doi: 10.1038/nature02185. [DOI] [PubMed] [Google Scholar]
- Cajal, S.R. & y. (1911) Histologie Du Systeme Nerveux de l’Homme et Des Vertebres Maloine, Paris.
- Desmaisons D, Vincent JD, Lledo PM. Control of action potential timing by intrinsic subthreshold oscillations in olfactssory bulb output neurons. J Neurosci. 1999;19:10727–10737. doi: 10.1523/JNEUROSCI.19-24-10727.1999. [DOI] [PMC free article] [PubMed] [Google Scholar]
- Freeman, W.J. (1975) Mass Action in the Nervous System Academic Press, New York.
- Hamilton KA, Heinbockel T, Ennis M, Szabo G, Erdelyi F, Hayar A. Properties of external plexiform layer interneurons in mouse olfactory bulb slices. Neuroscience. 2005;133:819–829. doi: 10.1016/j.neuroscience.2005.03.008. [DOI] [PMC free article] [PubMed] [Google Scholar]
- Hayar A, Karnup S, Ennis M, Shipley MT. External tufted cells: a major excitatory element that coordinates glomerular activity. J Neurosci. 2004a;24:6676–6685. doi: 10.1523/JNEUROSCI.1367-04.2004. [DOI] [PMC free article] [PubMed] [Google Scholar]
- Hayar A, Karnup S, Shipley MT, Ennis M. Olfactory bulb glomeruli: external tufted cells intrinsically burst at theta frequency and are entrained by patterned olfactory input. J Neurosci. 2004b;24:1190–1199. doi: 10.1523/JNEUROSCI.4714-03.2004. [DOI] [PMC free article] [PubMed] [Google Scholar]
- Hayar A, Shipley MT, Ennis M. Olfactory bulb external tufted cells are synchronized by multiple intraglomerular mechanisms. J Neurosci. 2005;25:8197–8208. doi: 10.1523/JNEUROSCI.2374-05.2005. [DOI] [PMC free article] [PubMed] [Google Scholar]
- Holderith NB, Shigemoto R, Nusser Z. Cell type-dependent expression of HCN1 in the main olfactory bulb. Eur J Neurosci. 2003;18:344–354. doi: 10.1046/j.1460-9568.2003.02756.x. [DOI] [PubMed] [Google Scholar]
- Joliffe IT, Morgan BJ. Principal component analysis and exploratory factor analysis. Stat Meth Med Res. 1992;1:69–95. doi: 10.1177/096228029200100105. [DOI] [PubMed] [Google Scholar]
- Kosaka K, Aika Y, Toida K, Kosaka T. Structure of intraglomerular dendritic tufts of mitral cells and their contacts with olfactory nerve terminals and calbindin-immunoreactive type 2 periglomerular neurons. J Comp Neurol. 2001;440:219–235. doi: 10.1002/cne.1381. [DOI] [PubMed] [Google Scholar]
- Kosaka T, Kosaka K. Intraglomerular dendritic link connected by gap junctions and chemical synapses in the mouse main olfactory bulb: Electron microscopic serial section analyses. Neuroscience. 2005;131:611–625. doi: 10.1016/j.neuroscience.2004.11.050. [DOI] [PubMed] [Google Scholar]
- Kosaka K, Toida K, Aika Y, Kosaka T. How simple is the organization of the olfactory glomerulus?: the heterogeneity of so-called periglomerular cells. Neurosci Res. 1998;30:101–110. doi: 10.1016/s0168-0102(98)00002-9. [DOI] [PubMed] [Google Scholar]
- Laurent G, Davidowitz H. Encoding of olfactory information with oscillating neural assemblies. Science. 1994;265:1872–1875. doi: 10.1126/science.265.5180.1872. [DOI] [PubMed] [Google Scholar]
- Macrides F, Schneider SP. Laminar organization of mitral and tufted cells in the main olfactory bulb of the adult hamster. J Comp Neurol. 1982;208:419–430. doi: 10.1002/cne.902080410. [DOI] [PubMed] [Google Scholar]
- McQuiston AR, Katz LC. Electrophysiology of interneurons in the glomerular layer of the rat olfactory bulb. J Neurophysiol. 2001;86:1899–1907. doi: 10.1152/jn.2001.86.4.1899. [DOI] [PubMed] [Google Scholar]
- Nusser Z, Naylor D, Mody I. Synapse-specific contribution of the variation of transmitter concentration to the decay of inhibitory postsynaptic currents. Biophys J. 2001;80:1251–1261. doi: 10.1016/S0006-3495(01)76101-2. [DOI] [PMC free article] [PubMed] [Google Scholar]
- Panzanelli P, Perazzini AZ, Fritschy JM, Sassoe-Pognetto M. Heterogeneity of gamma-aminobutyric acid type A receptors in mitral and tufted cells of the rat main olfactory bulb. J Comp Neurol. 2005;484:121–131. doi: 10.1002/cne.20440. [DOI] [PubMed] [Google Scholar]
- Pinching AJ, Powell TP. The neuron types of the glomerular layer of the olfactory bulb. J Cell Sci. 1971a;9:305–345. doi: 10.1242/jcs.9.2.305. [DOI] [PubMed] [Google Scholar]
- Pinching AJ, Powell TP. The neuropil of the periglomerular region of the olfactory bulb. J Cell Sci. 1971b;9:379–409. doi: 10.1242/jcs.9.2.379. [DOI] [PubMed] [Google Scholar]
- Puopolo M, Belluzzi O. Functional heterogeneity of periglomerular cells in the rat olfactory bulb. Eur J Neurosci. 1998;10:1073–1083. doi: 10.1046/j.1460-9568.1998.00115.x. [DOI] [PubMed] [Google Scholar]
- Ressler KJ, Sullivan SL, Buck LB. Information coding in the olfactory system: evidence for a stereotyped and highly organized epitope map in the olfactory bulb. Cell. 1994;79:1245–1255. doi: 10.1016/0092-8674(94)90015-9. [DOI] [PubMed] [Google Scholar]
- Schoenfeld TA, Marchand JE, Macrides F. Topographic organization of tufted cell axonal projections in the hamster main olfactory bulb: an intrabulbar associational system. J Comp Neurol. 1985;235:503–518. doi: 10.1002/cne.902350408. [DOI] [PubMed] [Google Scholar]
- Shepherd, G.M., Chen, W.R. & Greer, C.A. (2004) Olfactory Bulb Oxford University Press, New York.
- Vassar R, Chao SK, Sitcheran R, Nunez JM, Vosshall LB, Axel R. Topographic organization of sensory projections to the olfactory bulb. Cell. 1994;79:981–991. doi: 10.1016/0092-8674(94)90029-9. [DOI] [PubMed] [Google Scholar]