

Abstract
Previous approaches to comparing gene and chromosome organization between two genomes have been based on genetic maps or genomic sequences. We have developed a system to align an FPC-based physical map to a genomic sequence based on BAC end sequences and sequence-tagged hybridization markers and to align two FPC maps to one another based on shared markers and fingerprints. The system, called SyMAP (Synteny Mapping and Analysis Program), consists of an algorithm to compute synteny blocks and Web-based graphics to visualize the results. The approach to calculating the anchors (corresponding elements on the respective maps) maximizes the inclusion of anchors with different rates of divergence. Chains (putative syntenic sets of anchors) are computed using a dynamic programming algorithm, which includes off-diagonal anchors that result from map coordinate errors and small inversions. As the gap parameters (the distances allowed between anchors in a chain) can vary over different data sets and be difficult to set manually, they are automatically computed per data set. The criterion for a chain to be acceptable is based on the number of anchors and the Pearson correlation coefficient. Neighboring chains are merged into synteny blocks for display. This algorithm has been tested with three data sets that vary in the number of BACs, BAC end sequences, hybridization markers, distance between anchors, and number and antiquity of genome duplication events. The Web-based graphics uses Java for a highly interactive display that allows the user to interrogate the evidence of synteny.
Comparative genomics is useful for elucidating the function of genes, for studying evolutionary history, and for ordering and editing contigs (physical and sequence). Conserved regions between divergent genomes may be computed by aligning genetic maps or comparing genomic sequences. The availability of completed sequences for a few model organisms and the need for many additional sequences to reveal biological diversity creates a new need that is intermediate between these two extremes, specifically the comparison of a physical map for an as-yetunsequenced genome to the completed genomic sequence of a model organism. By such comparisons, fully sequenced models might be used to reduce the amount of de novo work needed to bring additional related genomes to a high degree of closure. Our system, called SyMAP (Synteny Mapping and Analysis Program), focuses on this emerging need by aligning FPC contigs (Soder-lund et al. 1997) to a sequenced genome based on BAC end sequences (BES) and hybridized markers with known sequence.
The first published comparison between an FPC map and genome sequence was by Gregory et al. (2002), who aligned the mouse map to the human sequence using BESs. They manually merged FPC contigs based on adjacent alignments to the human genome; that is, when the end clones of contigs overlap slightly but not enough to be detected by the FPC algorithm, the dual evidence of their proximity on the human sequence and the manual inspection of the candidate overlapping fingerprints justified merging of contigs. Besides aiding in merging contigs, the mouse–human alignment provided insights into the evolutionary history before the mouse was sequenced. This approach was used by Bowers et al. (2005) who aligned the sorghum FPC map to the rice sequence, and by F. Wei (pers. comm.) who used the SyMAP alignment of the maize FPC map to the rice sequence to aid in the manual editing on the maize map.
Assembly problems using only the whole-genome shotgun (WGS) approach are likely to increase as progressively larger genomes are tackled. This is especially a problem with plant genomes, where many are large, recent polyploids and highly repetitive; for example, hexaploid wheat is 17,300 Mb and 95% of all cultivated wheat is hexaploid (for review, see Feldman 2001), and maize is a 2400-Mb paleopolyploid with ∼58% repetitive elements (Messing et al. 2004).
If a genome GA exists that is recently diverged from a completely sequenced genome GB, the following scenario can provide an excellent resource: (1) build a fingerprint map for GA; (2) BAC end sequence the clones from the map; (3) hybridize sequenced markers to the map; (4) align the FPC map to the sequence of GB using the BES and sequenced markers; (5) use the alignment as supporting evidence in decisions to manually merge FPC contigs; (6) if the genomes are very recently diverged, anchor the FPC contigs by the alignment to the GB chromosomes, obviating the need for a genetic or radiation hybrid map; (7) if the GA genome has draft sequence, many of the sequence contigs can be anchored by aligning them to sequence on the FPC map or aligning them to the sequence of GB and then placing them on the homologous FPC segment.
This resource contributes comparative data for ordering and anchoring of BACs, location of gene-based markers on the map, and early insights into evolutionary history. It also provides the foundation for BAC-by-BAC sequencing of either targeted regions or the entire genome and aids in the annotation of the sequenced genome, since gene-based homologies will confirm hypothetical gene annotations and BES homologies can aid in determining conserved functional sites.
To create an FPC map for the above scenario, either agarose based (e.g., Marra et al. 1997) or High Information Content Fingerprint (HICF) (Ding et al. 2001; Luo et al. 2003; Nelson et al. 2005) approaches can be used. The HICF approach is becoming increasingly popular, since the fingerprints can be run on a sequencing machine so that there is little manual intervention, the precision of the sizing is excellent, and the high information content causes the fingerprints to assemble into significantly fewer contigs than the agarose approach (Nelson et al. 2005). This has enabled the fingerprinting of ∼50,000 clones to be done in 2 wk on one ABI 3730 sequencer.
Approaches to computing synteny
The general problem can be broken up into three components. (1) Find the homologous sequences (ai,bj) where ai is the location of a sequence on genome GA and bj is the location of a sequence on genome GB. The pair (ai,bj) is referred to as an anchor (or gene pair, homologous sequence, or conserved element). The anchors are represented as an N M matrix, where the rows are the sorted GA locations a1… .an, the columns are the sorted GB locations b1…bm, and a '1' indicates that (ai, bj) is an anchor. (2) Determine segments SA and SB from GA and GB that share a common ancestor, where the segments are determined to diverge from the same ancestral chromosome if they share anchors. If the anchors retain the same order, they are referred to as conserved (or col-linear) segments. If rearrangements are allowed, they are referred to as synteny blocks (or conserved synteny, collinearity with rearrangements, or homologous segments). As synteny blocks allow inversions, deletions, insertions, transpositions, and duplications, the anchors are generally grouped into chains (or clusters) and the chains are merged into synteny blocks. A chain has an orientation based on whether it has a positive or negative slope. Anchors that group on a horizontal or vertical line are repetitive sequences. Anchors that are computed from a genomic sequence also have an orientation, which is whether the homologous sequence is from the top or bottom strand. (3) The output may be simply a text file listing the alignment of GA to GB or it may be a graphical display.
Multiple programs exist to compute anchors from two sequenced genomes, for example, PatternHunter (Ma et al. 2002) and BLASTZ (Schwartz et al. 2003). There are also multiple approaches to calculate synteny blocks, most of them taking as input a pre-computed anchor list, gene annotations, or shared markers from genetic maps. These different approaches to finding synteny blocks all solve a similar problem, but with different emphasis. One predominant difference is whether the anchors are gene products or homologous sequences that may be coding or noncoding. A second difference is the criteria for declaring that a set of anchors represents a synteny block. Most approaches have a function to determine the distance between two anchors, though these vary as to how strictly diagonal the anchors must be. For example, some algorithms use the Manhattan distance, which emphasizes the closeness of the anchors over the diagonal property, while others have developed specialized distance measures that emphasize the nearness of the anchors to the diagonal, such as was done by Vandepoele et al. (2002) and Haas et al. (2004). The following briefly summarizes some approaches for finding synteny blocks between two eukaryotic genomes, where the first two are the most relevant algorithms to our approach.
Vandepoele et al. (2002) developed the Automatic Detection of Homologous Regions (ADHoRe) software, which takes as input two lists of gene products and computes the anchors with an all-against-all BLASTP. The anchors are split into two lists based on orientation, and processed separately. The algorithm iteratively clusters anchors whose distance is less than the gap size, and the gap size increases over the iterations until it is equal to D. All clusters are removed that have a quality less than Q, where the quality is computed as the coefficient of determination by linear regression through the points in a cluster. The clusters are post-processed by adding anchors that are not in a cluster to nearby clusters when possible, joining the clusters into blocks, and removing the blocks that are computed to be not significant.
Haas et al. (2004) developed the DAGchainer software, which takes as input a file of gene pairs with their BLAST E-value and the location of each gene on its respective genome. A directed acyclic graph (DAG) is constructed, and dynamic programming is used to determine the maximally scoring chains from the DAG. Once all chains are found over a minimum scoring threshold, the DAG is recreated with the coordinates reversed for the second genomic sequence and the algorithm is run again to find the chains in the opposite orientation.
Gregory et al. (2002) aligned mouse FPC contigs to the human minimal tiling path using mouse BESs, where they computed the anchors as BES matches with unique locations on the human tiling path of sequenced clones. Pevzner and Tesler (2003) used the PatternHunter anchors as input, which were used to compute a graph with an edge between each two anchors if their Manhattan distances were within the distance D, then clusters were computed from the connected components, and nearby clusters were merged into synteny blocks. Calabrese et al. (2003) developed the Fast Identification of Segmental Homology (FISH) software package, which takes as input the anchor list, uses the Manhattan distance function and dynamic programming, and models the probability of finding a synteny block by chance. Cannon et al. (2003) developed the DiagHunter software for computing synteny blocks and the GenoPix2D software for displaying and querying the results; DiagHunter compresses the search matrix to reduce the span between hits in the diagonal and uses two scoring matrixes, a left-handed and a right-handed, for weighing anchors based on distance from the diagonal. Hampson et al. (2003) computed maize duplications using genetic maps with a program they developed called LineUp, which detects all possible clusters of anchors and computes the probability of each cluster. Kent et al. (2003) used BLASTZ alignments and built clusters using a k-dimensional tree; clusters were merged on the base-level, and then the clusters were combined into “nets.”
In addition to the computational packages described above, there are numerous other Web sites that display synteny data. For example, Gramene (Ware et al. 2002) can interactively align many different types of maps from different plant organisms. NCBI (Wheeler et al. 2003) and Ensembl (Hubbard et al. 2005) both have displays of comparative maps shown with shared genes and block alignments. Byrne and Wolfe (2005) developed a Yeast Genome Order Browser (YGOB) to compute and view the syntenic relations found in various sequenced species of yeast.
SyMAP provides both synteny computing algorithms and a Web-based graphical display. The algorithm takes into account the properties of aligning an FPC map to a sequence, such as the fact that there are many tiny false inversions due to map and BES ambiguities. It is sensitive to duplicated regions and anchors that have various divergence rates. Since the two genomes being compared may have very different lengths, different gap parameters are used for two genomes. There are various parameters that are difficult for the user to determine the best values; hence, our algorithm computes values for the data set-dependent parameters, and we have optimized all other parameters on three diverse data sets. The SyMAP Web-based graphics is extremely versatile, allowing the user the ability to manipulate and filter the map in order to adjust the view.
Methods
Properties of FPC to genome synteny
Our goal was to align the Zea mays, Sorghum bicolor, and Sorghum propinquum FPC maps to the Oryza sativa genomic sequence. All three FPC maps contain hybridized markers with known sequence, and many of the contigs have been anchored to chromosomes using genetic markers. Rice is ∼420 Mb, sorghum is ∼740 Mb, and maize is 2400 Mb. The three genomes share a common ancestor that had a duplication event ∼70 million years ago (Mya), with a common maize–sorghum ancestor diverging from rice ∼42–47 Mya (Paterson et al. 2004), then diverging from one another shortly before a subsequent genome duplication specific to maize ~11 Mya (Swigonova et al. 2004). The properties of our data set, which are generally applicable to many plant genomes, are described in the following paragraphs.
Since rice and maize both have ancient duplications, a maize FPC contig can align strongly to one rice chromosome and have weaker synteny with another chromosome, or even another location on the same chromosome. Further, since maize has a second, more recent duplication, two maize contigs may align to the same segment of a rice chromosome (for example, see Fig. 1).
Figure 1.

Two maize chromosomes aligning to rice chromosome 3. Blue marker names are found in both maize segments, while red names indicate markers that have been deleted or diverged beyond recognition in one segment. Note, most marker names are not shown because the list continues beyond the end of the blocks. The green lines are marker synteny and the purple lines are BES synteny.
Genome duplication followed by diploidization often results in the loss of one gene from a duplicated pair (e.g., Paterson et al. 2004). Consequently, two chromosomes may have diverged from the same ancestral chromosome, but have many nonhomologous genes between anchors. This is evident in Figure 1, where the marker names shown in blue are retained in both maize segments and the marker names shown in red are only retained with detectable homology in one segment.
Maize has six times as much nuclear DNA as rice, mainly due to the expansion of transposon families and the remnants of the second duplication. Therefore, two regions may have diverged from the same chromosome, resulting in a series of contiguous anchors, but the distance between the anchors can vary greatly and will usually be significantly larger in maize than in rice.
Since the BESs and markers in the FPC map do not cover the genome, there will be many possible anchors that cannot be detected. Therefore, there will be many genes in rice that do not appear to have a homologous sequence in maize. Moreover, the hybridized markers in FPC will contain false positives and false negatives.
When comparing an FPC contig with a genomic sequence, the FPC coordinates are converted to an approximate basepair length by multiplying the number of consensus bands in the contig by the average size of a restriction fragment, where a consensus band (CB) is an approximate restriction fragment. Regions where the average restriction fragment size is greater or less than the overall average will appear condensed or expanded in relation to the genomic sequence.
In FPC contigs, markers are given the location of the largest stack of clones for which they hybridize. The fingerprint coordinates are approximate, where the precision of their coordinates directly correlates with the precision of the data (Soderlund et al. 2000). The approximate coordinates cause off-diagonal anchors to appear in synteny chains, which would otherwise be strictly diagonal. In addition, the order of the BESs for a clone is not known and the BESs are assigned arbitrarily to an end of the parent clone. Incorrect assignment of an end also causes off-diagonal anchors, as illustrated in Figure 2.
Figure 2.

Incorrectly ordered BESs, false-positives, and inversions. (A)A set of overlapping clones is aligned to the genome based on BESs. The crossed lines may be a result of misplaced BESs, false-positives, or inversions. They may also be a result of incorrect clone endpoints (data not shown in this example). (B) Shows the effect on the matrix. The x's are the incorrectly ordered BESs and the o is a false positive.
Though the orientation of a homologous sequence on the rice genome is known, it will not be known for the homologous marker or BES; however, the two BESs for a clone should have opposite orientations relative to the rice genome, as one BES is from the top strand of the BAC and the other is from the bottom strand. If a clone's BESs have the same orientation, this may indicate an inversion with the breakpoint lying somewhere within the clone.
FPC contigs may be anchored to a region on a chromosome or they may not be anchored. A genetic map or radiation map is generally used to determine a set of markers that are ordered along the chromosomes. These markers are hybridized to the clones in the FPC map and the contigs can be anchored based on this information. While many plant genomes have genetic maps, if the markers have not been integrated into the FPC map, the FPC contigs will be unanchored.
The SyMAP software
SyMAP consists of the synteny block algorithm and the graphical display. The synteny block algorithm consists of the anchor finder, chain finder, and postprocessor. The task of filtering noise is accomplished partly by the anchor finder and partly by the chain finder; the more noise that can be filtered by the anchor finder, the easier it is for the chain finder to distinguish the syntenic anchors from the noise.
The anchor finder
The anchor finder first runs RepeatMasker (www.repeatmasker. org) on the BESs, and then BLAT (Kent 2002) is used to align the FPC sequences (BESs and markers) to the genome sequence using the nucleotide/nucleotide search mode at low stringency. BLAT combines separate HSPs into one hit, eliminating the need to postprocess the hit data to join hits from different exons (or nongenic hits that have a gap due to an insertion), as is necessary with BLAST (Altschul et al. 1997).
As using a low-stringency cutoff generates many alignments, only the top F1 (default 2) alignments for an FPC sequence are assigned as anchors, and then any anchor is removed that has a score within F2% (default 25%) of any of the remaining alignments (in other words, alignments must stand out from the “background” of false positives). Taking the top F1 hits avoids using a strict cutoff that can miss more highly divergent anchors and allows the chain finder to include weaker hits if they occur in chains and to ignore them otherwise. F1 can be increased if ploidy or duplications result in a larger expected number of valid alignments per marker or BES.
To reduce vertical and horizontal lines in the anchor matrix, two additional filters are applied. (1) FPC markers that hybridize to more than F3 contigs (default 10) are not used, and (2) sections of the pseudomolecule of length F4 (default 10kb) that are hit by an excessive number of anchors (more than four standard deviations above average) are not used.
The chain finder
The input to the chain finder is a set of anchors (uA,uB) where uA is the location on the FPC map of genome GA and uB is the location on the genomic sequence of GB. The set of anchors may be from a single contig for unanchored contigs or from a set of neighboring contigs for anchored contigs. Since there may be a large difference in the two genome sizes, they have different parameters; letting x signify A or B, tx is the gap unit length and Mx is the maximum allowed gap size. These parameters are automatically determined, as explained in the next section.
A weighted directed acyclic graph (DAG) is constructed, where the set of nodes are the anchors and the set of edges (u, v) is:
The distance function is the weight associated with each edge and is defined as:
This scaled Manhattan function is necessary since the average distance between anchors may be different for the two genomes. A dynamic programming (DP) algorithm is repeatedly executed to find the maximal scoring chains, where the score of a chain is defined as the number of anchors minus the sum of the edge distances. Defining P(v) as the set of nodes u for which (u,v) Î E, the DP function is
where 1 is the anchor score for ai and bj, which effectively counts the anchors in a chain. In matrix notation (see Fig. 2B), the neighborhood of (ai, bj) that the DP can investigate is bounded by uA ± MA and uB − MB, and the array is traversed in row order. The two-way range of the A neighborhood allows for the incorporation of off-diagonal anchors due to incorrect FPC coordinates, erroneous BES assignments, and small inversions. It also simultaneously computes chains with negative and positive slopes.
In order to accept a chain as valid, it must meet one of four conditions based on the following variables: n is the number of anchors; r1 is the approximate linearity of the anchors in the chain as measured by the Pearson correlation coefficient; r2 is the correlation of all the anchors in the chain's bounding rectangle; and dx is the average density of anchors in the chain along the respective axes. The parameter N (default 10) is the minimum number of an chors in a chain. The four conditions are tested in the acceptable function, as shown in Figure 3A. The conditions require chains to be more precisely linear the closer they are to the minimal num ber of anchors N. The r2 test serves to exclude cases where the DP may pick out a highly linear chain through a region of random false-positive anchors. The last condition makes an exception for densechains, which may have a lower correlation due to errors in the assignment of BES ends or clone ordering within a contig, especially if they are short. When comparing the four conditions to determine how many chains were accepted by each for the rice/maize data set, the conditions are overlapping, with the third being satisfied the least (23%) and the fourth being satisfied the most (81%). Using the SyMAP graphics, we were able to adjust the parameters for the acceptable function until the chains closely matched those determined by human inspection.
Figure 3.

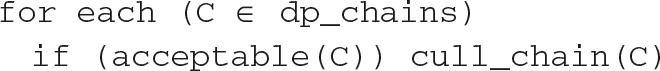
(A) The acceptable function determines whether a candidate chain qualifies. (B) The chain finder function adjusts the parameters to detect candidate chains. It calls the dp_chains, which is the dynamic programming function to find candidate chains, and it calls cull_chain, which removes anchors of the chain from the DAG and saves the chain for output.
The dp_chains function runs multiple iterations of the DP, each time removing the highest scoring chain, until no chains remain. The function then returns the list of (nonintersecting) chains. The function cull_chain removes the anchors of a chain from the DAG and saves the chain for final output. If the gap parameters were set once and used for all chains, the SyMAP algorithm to find all acceptable chains would be as follows:
 |
As described in the next section, this loop is modified to optimize the tx parameter for each chain.
An option exists to keep the best chain for each contig, even if the chain does not pass the acceptance test; this option provides a way to suggest a location for small contigs that may have too few anchors to reach the threshold.
Setting gap parameters
The chain finder depends on gap parameters that are difficult to manually set, as their optimal values depend on the average distance between anchors in a chain as well as extraneous (false-positive) anchors near the chain, both of which vary from chain to chain. For example, one chain may contain a strong primary synteny, while another chain within the same chromosome pair may contain only secondary syntenies resulting from more ancient duplication events. Also, one chain may be located in a region of sparse background noise, while another may be found in a region of high noise. In order to use the optimal gap parameters for each chain, the chain finder is called within a loop in which these parameters are varied and the resulting chains checked for quality. The parameters that maximize the chain length while retaining satisfactory quality are used.
Specifically, the parameters MA and MB are set to reasonable default values and then tA and tB are optimized according to the algorithm shown in Figure 3B. Note that larger values of tA and tB give rise to longer chains, but possibly of lower quality (i.e., includes spurious anchors). Since the goal is to find the longest possible chains of good quality, the gap parameters start with high values and are gradually lowered. When an acceptable chain is found, a binary search is performed to locate the highest gap parameters to ensure finding the longest acceptable form of the chain. Note that the binary search is not exhaustive (this would be too time-consuming) and may occasionally miss the optimal tx for a chain, particularly if several chains are present at the same parameter values; however, it is a significant improvement over using one global tx value.
Postprocessor
The BESs initially are arbitrarily assigned to a clone end, which causes lines to incorrectly cross (or not to cross for inversions) in the display. After a chain is accepted, the BESs are reassigned. For clones with two BESs that are part of a chain with a negative slope, the BESs are assigned an end so that their lines cross, and if the slope is positive the ends are assigned so that the lines do not cross. Once all of the paired BESs are fixed, the single BESs are adjusted based on the nearest BES hit that is part of a pair or the nearest marker hit.
A chain may have embedded inversions, which would cause incorrect BES assignments in these regions, as the overall slope was applied to the inverted region as well. To overcome this problem, the chains are scanned for unusually large gaps, and these gaps are evaluated as possible inversion breakpoints. BES reassignment is then carried out on the uniformly sloping subchains between successive breakpoints.
The last step creates blocks from the bounding rectangles of the chains, (optionally) merging chains into one block if they are near each other. Chains may be near each other in a chromosome pair if there were gaps too large for the DP to cross, which may be due to large inversions, deletions, or insertions. Chains are merged into one block if the separation between them is small compared with the size of the larger chain. The merging of chains aids in viewing the blocks and is not necessarily biologically relevant (see Discussion).
The display
SyMAP has a versatile CGI/HTML and Java display that allows the user to observe the synteny from different views, and drill down into a view to see details. The FPC map to genomic sequence alignment (FPCþSEQ) has the following six views: dot plot, genome blocks, chromosome blocks, close-up chromosome, closeup contigs, and table view. All views, except the table view, are illustrated in Figure 4. The dot plot gives a global view of the anchors (Fig. 4A,B), where each square represents the anchors between the two corresponding chromosomes. It shows the anchors that are output from the anchor-finder algorithm and places a red rectangle around the computed synteny blocks. From this view, it is easy to see the duplications in both genomes (see Fig. 5). Additionally, if anchors are not used in blocks, the user can visually determine whether they should be part of the block. The dot plot and close-up views are Java displays that have complete support for zooming, stretching, clipping, and filtering. The views can be filtered on attributes of the contig display, the hits that are shown, and the sequences. For example, the sequence filter allows the rice gene annotations to be shown so that the user can view what FPC sequences are aligning to predicted genes. The table view lists all of the contigs and where they map to on the sequenced genome. There is also a table of contigs that map to multiple locations and a table of contigs that map to no locations.
Figure 4.

The SyMAP displays. (A) Java dot plot of two whole genomes, where the vertical axis is the FPC contigs and the horizontal axis is the sequenced genome. Each square represents the anchors shared by the two chromosomes. Clicking on a square zooms in on it. (B) From the square, a region can be selected which turns it yellow. Clicking a yellow region displays the close-up shown in E. (C) CGI/Perl display of the blocks aligned to the sequenced chromosomes. The blocks are color coded to indicate what FPC chromosome they are from. Clicking on a sequenced chromosome will show the close-up. (D) CGI/Perl display of the close-up of a sequenced chromosome, where the numbers in the small rectangles are contig numbers. Selecting a block will display the close-up. (E) Java close-up of the block. Purple lines are BESs. Green lines are markers. Select a contig to show the close-up. (F) Java close-up of the contig. The displays E and F have filters for the three tracks. The Block and Contig filters allow marker and clone names to be filtered on different properties. The Hit filter allows the lines between the anchor points to be filtered on different properties. The sequence filter allows the annotation, framework markers, and gaps to be made visible/invisible.
Figure 5.

A maize FPC (19.7.2005 release) to rice genomic sequence (IRGSP V4) dot plot. The dot plot by default is drawn to fit the browser; therefore, the maize coordinates are compressed. There is an option to show the dot plot to scale; the scaled dot plot for maize chromosome 6 and rice chromosome 6 is shown in the lower right corner (covering the dot plots for maize 5–10 and rice 11–12).
As shown in Figure 1, SyMAP has a dual alignment display that shows two FPCs aligned to a sequence (FPC⇒SEQ⇐FPC). The synteny blocks are the same as the FPC⇒SEQ view, and the graphical display is almost the same, except that it is only available in the two close-up views (Fig. 4E,F) and has two more tracks representing the second set of anchors and blocks. SyMAP also works for aligning two FPC maps (FPC⇔FPC). The only difference in the algorithm is that anchors are computed from the shared markers or fingerprint similarity, and the graphics use an FPC track in place of the sequence track.
The Java component of SyMAP executes as an applet on a user's computer. Efficiency was a priority in developing SyMAP given the large amount of data to be transferred from the database server to a user's computer over the network. To avoid repeatedly downloading the same data, a caching system was developed in order to reduce the amount of data transferred between the database server and the client, thus increasing usability. The caching system relies upon Java's soft reference functionality, which allows objects to remain in memory as long as the space is available. To further reduce the memory footprint of the downloaded data, objects are stored in the cache as data objects that are designed to minimize memory usage. Data objects are then converted to view objects upon request of a SyMAP component.
Results
The SyMAP algorithm was tested on the maize, S. bicolor, and S. propinquum FPC maps against the rice genomic sequence V4 (The International Rice Sequencing Consortium 2005). As shown in Table 1, these data sets have a range of attributes; maize has a recent duplication, S. propinquum has less coverage and fewer BESs than maize, and S. bicolor has more coverage than S. propinquum, but no BESs. The default and automatically computed parameters were used for all data sets, that is, there was no manual adjustment of parameters from one data set to the next.
Table 1.
Comparison between different FPC mappings

Figure 5 shows a dot plot of the maize FPC and rice genomic sequence. The recent and ancient duplications are visible; for example, there are four maize synteny blocks aligned to the same region of rice chromosome 4. The block detected for rice chromosome 6 and maize chromosome 6, which has multiple inversions, is shown to scale in the lower right corner of Figure 5. Visual inspection of the dot plot confirms that the algorithm finds all of the strong synteny and rarely identifies obvious random anchors as a chain. There are a few small blocks that are questionable; however, when we randomized the maize anchors and ran the algorithm, no blocks were found, implying that the small blocks may be significant.
The results of SyMAP can be viewed at www.agcol.arizona. edu/symap, where the following alignments are available:
(FPC⇒SEQ) Maize, S. propinquum, S. bicolor aligned to the rice genome sequence.
(FPC⇒SEQ⇐FPC) Dual alignments for any two FPC blocks to the rice genome sequence. This includes blocks from the same species, which can show genome duplication (as shown in Fig. 1).
(FPC⇔FPC) Alignments of all three FPCs to each other. The comparison was based on a set of markers that were hybridized to the clones in all three FPCs (Bowers et al. 2003). There is also an alignment of the maize FPC to itself in order to view genome duplication.
SyMAP software is freely available at http://www.agcol.arizona.edu/software/symap.
Discussion
SyMAP consists of the algorithm to compute synteny and the graphics to view the results. The algorithm computes anchors from the alignment of BESs and markers in an FPC map to a genomic sequence for the FPC⇒SEQ mode and shared markers and fingerprint similarity for the FPC⇔FPC mode. It then computes chains of anchors using a dynamic programming (DP) algorithm and merges the chains into blocks. The algorithm must be able to handle noise from incorrect FPC coordinates, false-positive marker hybridization, and lack of knowledge of the correct clone end for a BES. The average distance between two anchors can be vastly different for the two genomes being aligned. There may be spurious anchors due to low complexity and repetitive sequences. Due to ancient polyploidy, a region may also align to more than one location. This variety of problems makes detecting synteny between an FPC map and sequenced genome a challenging problem. The most difficult aspect of the problem was that anchors are more likely to be syntenic the closer they are to each other, yet maize has large distances between markers due to duplications and transposons that should be ignored.
We initially used a strict cutoff for the alignment of the FPC sequences against the genomic sequence, but this was not ideal since a low cutoff resulted in too many spurious markers and a high cutoff missed divergent markers. Hence, anchors are now computed by taking the best alignments for each FPC sequence regardless of the score. This allows the chain finder to use weak hits if they occur in clusters and ignore them otherwise. By changing our implementation in this way, the number and quality of the chains noticeably improved.
We experimented with four different algorithms as follows: (1) the DP algorithm described above; (2) fixed-gap clustering similar to Pevzner and Tesler (2003); (3) a sliding-window clustering algorithm; and (4) a RANSAC-based line-finding algorithm (Fischler and Bolles 1981). All algorithms gave reasonable results on the obvious syntenies, but the DP algorithm proved to be the most sensitive and robust for the full range of chains. The algorithm is similar to DAGchainer (Haas et al. 2004), but it also allows the dynamic algorithm to explore a neighborhood of anchors similar to Calabrese et al. (2003). When we constructed the DAG according to the DAGchainer rules, which only allows chains of one orientation, it did not incorporate off-diagonal anchors caused by the noise in the data, and consequently, formed multiple chains from the same cluster that had to be merged. By building the DAG so that the DP could search either direction on the FPC axis, the complexity of the algorithm was greatly reduced, as it was able to handle the noise and computed both positive and negative sloping chains in a single pass. In addition, the DAGchainer used the score of the alignment between two sequences as the anchor score. We found for SyMAP that it is better to use a constant 1 as the anchor score, as the sequence match score can be weak due to divergence or high due to conserved repeats and is not a reliable guide to the significance of an anchor. Also, when mixing BES anchors with alignments of short unique overgos, the resulting scores have very different magnitudes.
Given the amount of uncertainty and the vast difference in data set attributes, it is difficult to avoid using many parameters, which could make tuning the parameters for different data sets difficult; however, our algorithm largely avoids this problem by setting most parameters to well-tested defaults and automatically setting the gap parameters using a binary search over the parameter space. The most likely parameters that the user may need to alter are N and F1, which are the minimum number of anchors in a chain and the expected number of anchors per marker or BES sequence (a function of duplication number and ploidy), respectively. Even for these, the defaults are satisfactory for all species tested to date, including 10 Oryza species of varying divergence time (Wing et al. 2005) that are not currently publicly available.
The gap parameter is the most difficult parameter to set, as it is dependent on the density of anchors, distance between anchors, and divergence time. The necessary gap parameter for one chain may therefore be different from that for another chain due to the existence of ancient and recent duplications and the varying density of genes and repetitive elements. Vandepoele et al. (2002) has one user-defined gap parameter for the maximum gap size D, and they allow the gap size to vary per chain by initializing it to three and gradually increasing it over the iterations of chain-finding until it is equal to D. SyMAP has independent sets of gap parameters for the two genomes, since they can be very different in size and attributes. The two gap parameters are the gap unit length t and the maximum gap size M. The algorithm determines M for each genome based on the expected average separation between anchors on a randomized dot plot containing the same total number of anchors. The parameter t for each genome is initialized to a fixed fraction of these maximum sizes. A binary search over the parameter space determines the maximum acceptable t for each chain, using acceptability criteria that depend on the number of anchors, correlation coefficients, and anchor density.
We tested the default and computed parameters on several data sets where there was a large difference in the coverage, markers, and BESs. Furthermore, the recent (11 Mya) duplication of maize and ancient (70 Mya) duplication in the common ancestor of maize and sorghum allow these tests to cover a very wide mixture of evolutionary histories. The maize/maize alignment was also tested, using shared markers and the FPC/FPC mode of SyMAP, and the duplication blocks were identified with high accuracy. No parameter adjustment was needed between any of these tests. Lastly, we tested these defaults on randomized maize and S. propinquum data, observing no false-positive block detection. The use of dynamic programming and binary search yields a fast algorithm, where the maximum time to execute for our data sets was 30 min on a Dell Poweredge processor 6650 with 8 GB of RAM.
A complication that occurs when aligning an FPC map using BESs to a genomic sequence is that a BES for a clone can come from either end of the clone, which causes the initial assignment of the BES to a clone end to be arbitrary and leads to off-diagonal anchors. As just discussed, the DP can handle the off-diagonal anchors. The problem then becomes one of viewing the data, since many lines will be unnecessarily crossed and it is hard to detect small inversions. However, once the orientation for a chain was fixed, the algorithm can generally assign the BES to the correct clone end. The fact that there can be small inversions within the chain is taken into account during the assignment.
Displaying results using a versatile and interactive graphical interface is critical, since results need to be visually analyzed. SyMAP provides a complete range of views along with the ability to zoom, clip, and filter the data. The only data that the user cannot view are the alignments that were filtered out as noise by the anchor finder. Due to the large number of potential alignments (average ~2 M for the data sets tested, resulting from the very relaxed parameters which we used), this filtering was necessary to decrease the size of the database, increase the speed of viewing the data, decrease the potentially overwhelming amount of data shown to the user, and supply the block finder with the most probable set of anchors. Though Java provides the flexibility to quickly alter the view, its drawback is that it does not always work the same on all browsers (we keep a list of browsers that have been tested on the Help page of SyMAP).
Gregory et al. (2002) first suggested the use of synteny with the human genome to aid in editing the mouse FPC map. We have taken this approach further by developing a system that can be used for any FPC map and sequenced genome from related species. Moreover, the edited FPC map can be iteratively input into the algorithm to update the synteny. This approach was used as part of the editing processes for the maize and sorghum FPC maps.
Acknowledgments
This work is funded in part by NSF DBI #0115903. We thank Fusheng Wei, Hye Ran Kim, and Jose Luis Goicoechea for feedback on the quality of the SyMAP results, Marti Martinez for the initial work on the Java dot plot, Anne Descour for her feedback on the manuscript, and Lomax Boyd for system management.
Footnotes
[SyMAP software is freely available at http://www.agcol.arizona.edu/software/symap.]
Article is online at http://www.genome.org/cgi/doi/10.1101/gr.5396706. Freely available online through the Genome Research Open Access option.
References
- Altschul S.F., Madden T.L., Schaffer A.A., Zhang J., Zhang Z., Miller W., Lipman D.J., Madden T.L., Schaffer A.A., Zhang J., Zhang Z., Miller W., Lipman D.J., Schaffer A.A., Zhang J., Zhang Z., Miller W., Lipman D.J., Zhang J., Zhang Z., Miller W., Lipman D.J., Zhang Z., Miller W., Lipman D.J., Miller W., Lipman D.J., Lipman D.J. Gapped BLAST and PSI-BLAST: A new generation of protein database search programs. Nucleic Acids Res. 1997;25:3389–3402. doi: 10.1093/nar/25.17.3389. [DOI] [PMC free article] [PubMed] [Google Scholar]
- Bowers J.E., Abbey C., Anderson S., Chang C., Draye X., Hoppe A.H., Jessup R., Lemke C., Lennington J., Li Z., Abbey C., Anderson S., Chang C., Draye X., Hoppe A.H., Jessup R., Lemke C., Lennington J., Li Z., Anderson S., Chang C., Draye X., Hoppe A.H., Jessup R., Lemke C., Lennington J., Li Z., Chang C., Draye X., Hoppe A.H., Jessup R., Lemke C., Lennington J., Li Z., Draye X., Hoppe A.H., Jessup R., Lemke C., Lennington J., Li Z., Hoppe A.H., Jessup R., Lemke C., Lennington J., Li Z., Jessup R., Lemke C., Lennington J., Li Z., Lemke C., Lennington J., Li Z., Lennington J., Li Z., Li Z., et al. A high-density genetic recombination map of sequence-tagged sites for sorghum, as a framework for comparative structural and evolutionary genomics of tropical grains and grasses. Genetics. 2003;165:367–386. doi: 10.1093/genetics/165.1.367. [DOI] [PMC free article] [PubMed] [Google Scholar]
- Bowers J.E., Arias M.A., Asher R., Avise J.A., Ball R.T., Brewer G.A., Buss R.W., Chen A.H., Edwards T.M., Estill J.C., Arias M.A., Asher R., Avise J.A., Ball R.T., Brewer G.A., Buss R.W., Chen A.H., Edwards T.M., Estill J.C., Asher R., Avise J.A., Ball R.T., Brewer G.A., Buss R.W., Chen A.H., Edwards T.M., Estill J.C., Avise J.A., Ball R.T., Brewer G.A., Buss R.W., Chen A.H., Edwards T.M., Estill J.C., Ball R.T., Brewer G.A., Buss R.W., Chen A.H., Edwards T.M., Estill J.C., Brewer G.A., Buss R.W., Chen A.H., Edwards T.M., Estill J.C., Buss R.W., Chen A.H., Edwards T.M., Estill J.C., Chen A.H., Edwards T.M., Estill J.C., Edwards T.M., Estill J.C., Estill J.C., et al. Comparative physical mapping links conservation of microsynteny to chromosome structure and recombination in grasses. Proc. Natl. Acad. Sci. 2005;102:13206–13211. doi: 10.1073/pnas.0502365102. [DOI] [PMC free article] [PubMed] [Google Scholar]
- Byrne K.P., Wolfe K.H., Wolfe K.H. The Yeast Gene Order Browser: Combining curated homology and syntenic context reveals gene fate in polyploid species. Genome Res. 2005;15:1456–1461. doi: 10.1101/gr.3672305. [DOI] [PMC free article] [PubMed] [Google Scholar]
- Calabrese P.P., Chakravarty S., Vision T.J., Chakravarty S., Vision T.J., Vision T.J. Fast identification and statistical evaluation of segmental homologies in comparative maps. Bioinformatics. 2003;19::i74–i80. doi: 10.1093/bioinformatics/btg1008. [DOI] [PubMed] [Google Scholar]
- Cannon S.B., Kozik A., Chan B., Michelmore R., Young N.D., Kozik A., Chan B., Michelmore R., Young N.D., Chan B., Michelmore R., Young N.D., Michelmore R., Young N.D., Young N.D. DiagHunter and GenoPix2D: Programs for genomic comparisons, large-scale homology discovery and visualization. Genome Biol. 2003;4:R68. doi: 10.1186/gb-2003-4-10-r68. [DOI] [PMC free article] [PubMed] [Google Scholar]
- Ding Y., Johnson M.D., Chen W.Q., Wong D., Chen Y.J., Benson S.C., Lam J.Y., Kim Y.M., Shizuya H., Johnson M.D., Chen W.Q., Wong D., Chen Y.J., Benson S.C., Lam J.Y., Kim Y.M., Shizuya H., Chen W.Q., Wong D., Chen Y.J., Benson S.C., Lam J.Y., Kim Y.M., Shizuya H., Wong D., Chen Y.J., Benson S.C., Lam J.Y., Kim Y.M., Shizuya H., Chen Y.J., Benson S.C., Lam J.Y., Kim Y.M., Shizuya H., Benson S.C., Lam J.Y., Kim Y.M., Shizuya H., Lam J.Y., Kim Y.M., Shizuya H., Kim Y.M., Shizuya H., Shizuya H. Five-color-based high-information-content fingerprinting of bacterial artificial chromosome clones using type IIS restriction endonucleases. Genomics. 2001;74:142–154. doi: 10.1006/geno.2001.6547. [DOI] [PubMed] [Google Scholar]
- Feldman M. Origin of cultivated wheat. In: Bojean A.P., William J.A., William J.A., editors. The world wheat book—A history of wheat breeding. Limagrain: Lavoisier, France; 2001. pp. 1–56. [Google Scholar]
- Fischler M., Bolles R., Bolles R. Comm. of the ACM. Vol. 24. Random sample consensus; 1981. A paradigm for model fitting with applications to image analysis and automated cartography; pp. 381–395. [Google Scholar]
- Gregory S.G., Sekhon M., Schein J., Zhao S., Osoegawa K., Scott C.E., Evans R.S., Burridge P.W., Cox T.V., Fox C.A., Sekhon M., Schein J., Zhao S., Osoegawa K., Scott C.E., Evans R.S., Burridge P.W., Cox T.V., Fox C.A., Schein J., Zhao S., Osoegawa K., Scott C.E., Evans R.S., Burridge P.W., Cox T.V., Fox C.A., Zhao S., Osoegawa K., Scott C.E., Evans R.S., Burridge P.W., Cox T.V., Fox C.A., Osoegawa K., Scott C.E., Evans R.S., Burridge P.W., Cox T.V., Fox C.A., Scott C.E., Evans R.S., Burridge P.W., Cox T.V., Fox C.A., Evans R.S., Burridge P.W., Cox T.V., Fox C.A., Burridge P.W., Cox T.V., Fox C.A., Cox T.V., Fox C.A., Fox C.A., et al. A physical map of the mouse genome. Nature. 2002;418:743–750. doi: 10.1038/nature00957. [DOI] [PubMed] [Google Scholar]
- Haas B.J., Delcher A.L., Wortman J.R., Salzberg S.L., Delcher A.L., Wortman J.R., Salzberg S.L., Wortman J.R., Salzberg S.L., Salzberg S.L. DAGchainer: A tool for mining segmental genome duplications and synteny. Bioinformatics. 2004;20:3643–3646. doi: 10.1093/bioinformatics/bth397. [DOI] [PubMed] [Google Scholar]
- Hampson S., McLysaght A., Gaut B., Baldi P., McLysaght A., Gaut B., Baldi P., Gaut B., Baldi P., Baldi P. LineUp: Statistical detection of chromosomal homology with application to plant comparative genomics. Genome Res. 2003;13:999–1010. doi: 10.1101/gr.814403. [DOI] [PMC free article] [PubMed] [Google Scholar]
- Hubbard T., Andrews D., Caccamo M., Cameron G., Chen Y., Clamp M., Clarke L., Coates G., Cox T., Cunningham F., Andrews D., Caccamo M., Cameron G., Chen Y., Clamp M., Clarke L., Coates G., Cox T., Cunningham F., Caccamo M., Cameron G., Chen Y., Clamp M., Clarke L., Coates G., Cox T., Cunningham F., Cameron G., Chen Y., Clamp M., Clarke L., Coates G., Cox T., Cunningham F., Chen Y., Clamp M., Clarke L., Coates G., Cox T., Cunningham F., Clamp M., Clarke L., Coates G., Cox T., Cunningham F., Clarke L., Coates G., Cox T., Cunningham F., Coates G., Cox T., Cunningham F., Cox T., Cunningham F., Cunningham F., et al. Ensembl 2005. Nucleic Acids Res. 2005;33:D447–D453. doi: 10.1093/nar/gki138. [DOI] [PMC free article] [PubMed] [Google Scholar]
- The International Rice Genome Sequence Consortium. The map-based sequence of the rice genome. Nature. 2005;436:793–800. doi: 10.1038/nature03895. [DOI] [PubMed] [Google Scholar]
- Kent W.J. BLAT–The BLAST-like alignment tool. Genome Res. 2002;12:656–664. doi: 10.1101/gr.229202. [DOI] [PMC free article] [PubMed] [Google Scholar]
- Kent W.J., Baertsch R., Hinrichs A., Miller W., Haussler D., Baertsch R., Hinrichs A., Miller W., Haussler D., Hinrichs A., Miller W., Haussler D., Miller W., Haussler D., Haussler D. Evolution's cauldron: Duplication, deletion, and rearrangement in the mouse and human genomes. Proc. Natl. Acad. Sci. 2003;100:11484–11489. doi: 10.1073/pnas.1932072100. [DOI] [PMC free article] [PubMed] [Google Scholar]
- Luo M.C., Thomas C., You F.M., Hsiao J., Ouyang S., Buell C.R., Malandro M., McGuire P.E., Anderson O.D., Dvorak J., Thomas C., You F.M., Hsiao J., Ouyang S., Buell C.R., Malandro M., McGuire P.E., Anderson O.D., Dvorak J., You F.M., Hsiao J., Ouyang S., Buell C.R., Malandro M., McGuire P.E., Anderson O.D., Dvorak J., Hsiao J., Ouyang S., Buell C.R., Malandro M., McGuire P.E., Anderson O.D., Dvorak J., Ouyang S., Buell C.R., Malandro M., McGuire P.E., Anderson O.D., Dvorak J., Buell C.R., Malandro M., McGuire P.E., Anderson O.D., Dvorak J., Malandro M., McGuire P.E., Anderson O.D., Dvorak J., McGuire P.E., Anderson O.D., Dvorak J., Anderson O.D., Dvorak J., Dvorak J. High-throughput fingerprinting of bacterial artificial chromosomes using the snapshot labeling kit and sizing of restriction fragments by capillary electrophoresis. Genomics. 2003;82:378–389. doi: 10.1016/s0888-7543(03)00128-9. [DOI] [PubMed] [Google Scholar]
- Ma B., Tromp J., Li M., Tromp J., Li M., Li M. PatternHunter: Faster and more sensitive homology search. Bioinformatics. 2002;18:440–445. doi: 10.1093/bioinformatics/18.3.440. [DOI] [PubMed] [Google Scholar]
- Marra M.A., Kucaba T.A., Dietrich N.L., Green E.D., Brownstein B., Wilson R.K., McDonald K.M., Hillier L.W., McPherson J.D., Waterston R.H., Kucaba T.A., Dietrich N.L., Green E.D., Brownstein B., Wilson R.K., McDonald K.M., Hillier L.W., McPherson J.D., Waterston R.H., Dietrich N.L., Green E.D., Brownstein B., Wilson R.K., McDonald K.M., Hillier L.W., McPherson J.D., Waterston R.H., Green E.D., Brownstein B., Wilson R.K., McDonald K.M., Hillier L.W., McPherson J.D., Waterston R.H., Brownstein B., Wilson R.K., McDonald K.M., Hillier L.W., McPherson J.D., Waterston R.H., Wilson R.K., McDonald K.M., Hillier L.W., McPherson J.D., Waterston R.H., McDonald K.M., Hillier L.W., McPherson J.D., Waterston R.H., Hillier L.W., McPherson J.D., Waterston R.H., McPherson J.D., Waterston R.H., Waterston R.H. High throughput fingerprint analysis of large-insert clones. Genome Res. 1997;7:1072–1084. doi: 10.1101/gr.7.11.1072. [DOI] [PMC free article] [PubMed] [Google Scholar]
- Messing J., Bharti A.K., Karlowski W.M., Gundlach H., Kim H.R., Yu Y., Wei F., Fuks G., Soderlund C.A., Mayer K.F., Bharti A.K., Karlowski W.M., Gundlach H., Kim H.R., Yu Y., Wei F., Fuks G., Soderlund C.A., Mayer K.F., Karlowski W.M., Gundlach H., Kim H.R., Yu Y., Wei F., Fuks G., Soderlund C.A., Mayer K.F., Gundlach H., Kim H.R., Yu Y., Wei F., Fuks G., Soderlund C.A., Mayer K.F., Kim H.R., Yu Y., Wei F., Fuks G., Soderlund C.A., Mayer K.F., Yu Y., Wei F., Fuks G., Soderlund C.A., Mayer K.F., Wei F., Fuks G., Soderlund C.A., Mayer K.F., Fuks G., Soderlund C.A., Mayer K.F., Soderlund C.A., Mayer K.F., Mayer K.F., et al. Sequence composition and genome organization of maize. Proc. Natl. Acad. Sci. 2004;101:14349–14354. doi: 10.1073/pnas.0406163101. [DOI] [PMC free article] [PubMed] [Google Scholar]
- Nelson W.M., Bharti A.K., Butler E., Wei F., Fuks G., Kim H., Wing R.A., Messing J., Soderlund C., Bharti A.K., Butler E., Wei F., Fuks G., Kim H., Wing R.A., Messing J., Soderlund C., Butler E., Wei F., Fuks G., Kim H., Wing R.A., Messing J., Soderlund C., Wei F., Fuks G., Kim H., Wing R.A., Messing J., Soderlund C., Fuks G., Kim H., Wing R.A., Messing J., Soderlund C., Kim H., Wing R.A., Messing J., Soderlund C., Wing R.A., Messing J., Soderlund C., Messing J., Soderlund C., Soderlund C. Whole-genome validation of high-information-content fingerprinting. Plant Physiol. 2005;139:27–38. doi: 10.1104/pp.105.061978. [DOI] [PMC free article] [PubMed] [Google Scholar]
- Paterson A.H., Bowers J.E., Chapman B.A., Bowers J.E., Chapman B.A., Chapman B.A. Ancient polyploidization predating divergence of the cereals, and its consequences for comparative genomics. Proc. Natl. Acad. Sci. 2004;101:9903–9908. doi: 10.1073/pnas.0307901101. [DOI] [PMC free article] [PubMed] [Google Scholar]
- Pevzner P., Tesler G., Tesler G. Genome rearrangements in mammalian evolution: Lessons from human and mouse genomes. Genome Res. 2003;13:37–45. doi: 10.1101/gr.757503. [DOI] [PMC free article] [PubMed] [Google Scholar]
- Schwartz S., Kent W.J., Smit A., Zhang Z., Baertsch R., Hardison R.C., Haussler D., Miller W., Kent W.J., Smit A., Zhang Z., Baertsch R., Hardison R.C., Haussler D., Miller W., Smit A., Zhang Z., Baertsch R., Hardison R.C., Haussler D., Miller W., Zhang Z., Baertsch R., Hardison R.C., Haussler D., Miller W., Baertsch R., Hardison R.C., Haussler D., Miller W., Hardison R.C., Haussler D., Miller W., Haussler D., Miller W., Miller W. Human–mouse alignments with BLASTZ. Genome Res. 2003;13:103–107. doi: 10.1101/gr.809403. [DOI] [PMC free article] [PubMed] [Google Scholar]
- Soderlund C., Longden I., Mott R., Longden I., Mott R., Mott R. FPC: A system for building contigs from restriction fingerprinted clones. Comput. Appl. Biosci. 1997;13:523–535. doi: 10.1093/bioinformatics/13.5.523. [DOI] [PubMed] [Google Scholar]
- Soderlund C., Humphray S., Dunham A., French L., Humphray S., Dunham A., French L., Dunham A., French L., French L. Contigs built with fingerprints, markers, and FPC V4.7. Genome Res. 2000;10:1772–1787. doi: 10.1101/gr.gr-1375r. [DOI] [PMC free article] [PubMed] [Google Scholar]
- Swigonova Z., Lai J., Ma J., Ramakrishna W., Llaca V., Bennetzen J.L., Messing J., Lai J., Ma J., Ramakrishna W., Llaca V., Bennetzen J.L., Messing J., Ma J., Ramakrishna W., Llaca V., Bennetzen J.L., Messing J., Ramakrishna W., Llaca V., Bennetzen J.L., Messing J., Llaca V., Bennetzen J.L., Messing J., Bennetzen J.L., Messing J., Messing J. Close split of sorghum and maize genome progenitors. Genome Res. 2004;14:1916–1923. doi: 10.1101/gr.2332504. [DOI] [PMC free article] [PubMed] [Google Scholar]
- Vandepoele K., Saeys Y., Simillion C., Raes J., Van De Peer Y., Saeys Y., Simillion C., Raes J., Van De Peer Y., Simillion C., Raes J., Van De Peer Y., Raes J., Van De Peer Y., Van De Peer Y. The automatic detection of homologous regions (ADHoRe) and its application to microcolinearity between Arabidopsis and rice. Genome Res. 2002;12:1792–1801. doi: 10.1101/gr.400202. [DOI] [PMC free article] [PubMed] [Google Scholar]
- Ware D.H., Jaiswal P., Ni J., Yap I.V., Pan X., Clark K.Y., Teytelman L., Schmidt S.C., Zhao W., Chang K., Jaiswal P., Ni J., Yap I.V., Pan X., Clark K.Y., Teytelman L., Schmidt S.C., Zhao W., Chang K., Ni J., Yap I.V., Pan X., Clark K.Y., Teytelman L., Schmidt S.C., Zhao W., Chang K., Yap I.V., Pan X., Clark K.Y., Teytelman L., Schmidt S.C., Zhao W., Chang K., Pan X., Clark K.Y., Teytelman L., Schmidt S.C., Zhao W., Chang K., Clark K.Y., Teytelman L., Schmidt S.C., Zhao W., Chang K., Teytelman L., Schmidt S.C., Zhao W., Chang K., Schmidt S.C., Zhao W., Chang K., Zhao W., Chang K., Chang K., et al. Gramene, a tool for grass genomics. Plant Physiol. 2002;130:1606–1613. doi: 10.1104/pp.015248. [DOI] [PMC free article] [PubMed] [Google Scholar]
- Wheeler D.L., Church D.M., Federhen S., Lash A.E., Madden T.L., Pontius J.U., Schuler G.D., Schriml L.M., Sequeira E., Tatusova T.A., Church D.M., Federhen S., Lash A.E., Madden T.L., Pontius J.U., Schuler G.D., Schriml L.M., Sequeira E., Tatusova T.A., Federhen S., Lash A.E., Madden T.L., Pontius J.U., Schuler G.D., Schriml L.M., Sequeira E., Tatusova T.A., Lash A.E., Madden T.L., Pontius J.U., Schuler G.D., Schriml L.M., Sequeira E., Tatusova T.A., Madden T.L., Pontius J.U., Schuler G.D., Schriml L.M., Sequeira E., Tatusova T.A., Pontius J.U., Schuler G.D., Schriml L.M., Sequeira E., Tatusova T.A., Schuler G.D., Schriml L.M., Sequeira E., Tatusova T.A., Schriml L.M., Sequeira E., Tatusova T.A., Sequeira E., Tatusova T.A., Tatusova T.A., et al. Database resources of the National Center for Biotechnology. Nucleic Acids Res. 2003;31:28–33. doi: 10.1093/nar/gkg033. [DOI] [PMC free article] [PubMed] [Google Scholar]
- Wing R.A., Ammiraju J.S., Luo M., Kim H., Yu Y., Kudrna D., Goicoechea J.L., Wang W., Nelson W., Rao K., Ammiraju J.S., Luo M., Kim H., Yu Y., Kudrna D., Goicoechea J.L., Wang W., Nelson W., Rao K., Luo M., Kim H., Yu Y., Kudrna D., Goicoechea J.L., Wang W., Nelson W., Rao K., Kim H., Yu Y., Kudrna D., Goicoechea J.L., Wang W., Nelson W., Rao K., Yu Y., Kudrna D., Goicoechea J.L., Wang W., Nelson W., Rao K., Kudrna D., Goicoechea J.L., Wang W., Nelson W., Rao K., Goicoechea J.L., Wang W., Nelson W., Rao K., Wang W., Nelson W., Rao K., Nelson W., Rao K., Rao K., et al. The oryza map alignment project: The golden path to unlocking the genetic potential of wild rice species. Plant Mol. Biol. 2005;59:53–62. doi: 10.1007/s11103-004-6237-x. [DOI] [PubMed] [Google Scholar]