Abstract
This study evaluated the pharmacokinetics of cefepime in 36 patients with different levels of renal function. Pharmacokinetic and pharmacodynamic parameters were calculated using samples obtained at steady state. Patients with creatinine clearance (CLCR) of >100 ml/min had more rapid clearance (CL) and a lower minimum concentration in serum (Cmin). Cmin in this group was found to be 3.3 ± 3.6 mg/liter (mean and standard deviation), compared to 19.5 ± 21.5 mg/liter in patients with a CLCR of between 60 and 100 ml/min (P = 0.025) and 14.0 ± 11.5 mg/liter in patients with a CLCR of <60 ml/min (P = 0.009). Patient data were also analyzed by the nonparametric expectation maximization method and Bayesian forecasting. The median volume of distribution in the central compartment was 27.08 liters. CL and CLCR were highly correlated (P = 0.00033) according to the equation CL= 0.324 liters/h + (0.0551 × CLCR). The median rate constants from the central compartment to the peripheral compartment and from the peripheral compartment to the central compartment were 12.58 and 41.09 h−1, respectively. The time-concentration profiles for 1,000 patients (CLCRs, 120, 60, and 30 ml/min) each receiving various dosing regimens were simulated by using Monte Carlo simulations. Standard dosing resulted in a Cmin that was greater than or equal to the MIC in more than 80% of the simulated profiles with MICs ≤2 mg/liter. Current dosing recommendations may be suboptimal for monotherapy of infections due to less susceptible pathogens (e.g., those for which MICs are ≥4 mg/liter), particularly when CLCR exceeds 120 ml/min.
Cefepime is a parenteral fourth-generation cephalosporin antibiotic with an extended spectrum of antimicrobial activity. It is active against many gram-positive and gram-negative bacteria, including most members of the family Enterobacteriaceae, Pseudomonas aeruginosa, and Staphylococcus aureus (12, 13). It is excreted primarily unchanged in the urine. The terminal half-life (t1/2) in plasma is approximately 2 h in normal renal function and increases proportionately to 13.5 h as renal function declines toward anuria. A good correlation has been demonstrated between cefepime clearance (CL) and creatinine clearance (CLCR) in healthy volunteers with various degrees of renal function (1-4). Dosage adjustment for renal insufficiency has been recommended in order to prevent drug accumulation, which may result in a higher incidence of adverse drug events and/or an unnecessary increase in drug costs (9).
The dosage adjustment recommended is primarily based on the proportional decrease in the rate of elimination and healthy volunteer data. However, modification of the dosing regimen based on renal impairment should also take into consideration pharmacodynamic parameters predicting clinical outcome (17). In vitro data have suggested that the bactericidal activity of β-lactams is generally concentration independent and that there is a lack of a postantibiotic effect against gram-negative bacteria (8, 19). Time above the MIC (T>MIC) is the most important pharmacodynamic parameter predicting outcome (7, 10). For therapeutic equivalence, the minimum concentration in serum (Cmin) of regimens adjusted for renal insufficiency should not be substantially different from that attained with the standard regimen in patients with normal renal function.
The objective of this study was to determine and compare various pharmacokinetic and pharmacodynamic parameters of cefepime in patients with normal renal function and receiving standard doses and in those receiving various dosing regimens adjusted for renal insufficiency. In order to put the pharmacokinetic data into perspective, we also evaluated the susceptibility distribution of recent clinical isolates of P. aeruginosa, a nosocomial pathogen for which cefepime therapy is often used in the Detroit Receiving Hospital.
MATERIALS AND METHODS
Patients.
All patients admitted to Detroit Receiving Hospital and University Health Center between October 1999 and June 2000 and prescribed cefepime for documented or suspected infections were evaluated for enrollment. This study was approved by the Wayne State University Human Investigations Committee, and informed consent was obtained from all patients or their representatives prior to study participation. For inclusion, patients had to be more than 18 years old and receiving cefepime (Maxipime; Bristol-Myers Squibb) at doses based on renal function as recommended by the manufacturer. Exclusion criteria consisted of conditions which could alter the pharmacokinetics of cefepime: pregnancy, severe burn of >20% of body surface area, spinal cord injury, cystic fibrosis, and severe underweight or overweight (±40% of ideal body weight). In addition, patients with severely impaired renal function (with an estimated CLCR of <11 ml/min or on dialysis), rapidly declining or fluctuating renal function (with a serum creatinine level of ±20% since the start of therapy), or neutropenic fever (absolute neutrophil count, <1,000 cells/μl) and those unable to give informed consent were also excluded. Demographic data (age, weight, infectious disease diagnosis, and Acute Physiology and Chronic Health Evaluation [APACHE] II score) were collected upon enrollment in the study, and any adverse events related to treatment or its administration were noted by reviewing relevant medical records daily while the patients were on cefepime therapy.
Study design.
This study was a prospective pharmacokinetic study. The sample size was predetermined by using Cmin as the primary end point. Based on results from a previous study, a standard deviation of 31% was estimated (1). A sample size of at least seven patients per group was necessary to provide an alpha value of 0.05 and a power of 0.80 in order to detect a difference of 50% in Cmin.
Antimicrobial agent administration.
Cefepime was reconstituted according to the manufacturer's guidelines and administered as an intravenous infusion over 30 min via a syringe pump. Dosing was based on the manufacturer's recommendations: 2 g every 12 h (q12) for a CLCR of ≥60 ml/min, 2 g every 24 h (q24) for a CLCR of ≥30 ml/min but <60 ml/min, and 1 g q24 for a CLCR of <30 ml/min.
Assessment of renal function.
Patients were categorized into different groups based on CLCR. Initial dosing was based on estimated CLCR (6). Subsequently, CLCR was assessed by urine collection over 8 h during the dosing interval and measurement of the concurrent serum creatinine level (15) to validate the appropriateness of the group assignments. When a patient also was prescribed an aminoglycoside, available aminoglycoside concentrations in serum were used to estimate renal function.
Blood sampling.
Three blood samples were obtained from each patient during one dosing interval after the third or higher dose of cefepime in order to ensure that the data collected represented steady-state conditions. Samples obtained were specifically timed in relation to the previous dose given and were centrifuged within 30 min of collection. The plasma was frozen at −70°C until analysis.
Analytic methods.
Serum cefepime concentrations were determined by a microbioassay with Klebsiella pneumoniae ATCC 10031 as the reference organism. Standards and samples were tested in duplicate by using blank 0.25-in. disks saturated with 20 μl of the appropriate solution. The disks were placed on antibiotic assay medium 1 (Difco, Detroit, Mich.) agar plates preswabbed with a 0.5-McFarland-standard suspension of the reference organism, forming a confluent lawn. The plates were incubated at 37°C for 24 h, at which time the zones of inhibition were measured. The assay was linear (correlation coefficient of ≥0.96 for all standard plates) over the standard antibiotic concentrations of 150, 50, and 0.5 mg/liter, with the last being the lower limit of detection due to the limitation of the blank disk size. Antibiotic standards were diluted in pooled human serum to simulate the components of the patient samples. The between-day coefficient of variation was <20% for each standard. Concurrently used antibiotics with activity against the reference organism were deactivated prior to the microbioassay (e.g., phosphate for aminoglycosides).
Susceptibility testing.
A total of 120 clinical isolates of P. aeruginosa were obtained from the microbiology department of our institution between February and April 2001. The MICs of cefepime for these isolates were determined by using the E test. The MICs at which 50 and 90% of the clinical isolates were inhibited (MIC50 and MIC90, respectively) were defined as the 50 and 90% percentiles of the MICs of the isolates.
Pharmacokinetic analysis.
Data analysis for point estimates of pharmacokinetic parameter values was performed in three ways. First, a maximum a posteriori probability (MAP) Bayesian estimation was determined by using ADAPT II pharmacokinetic-pharmacodynamic system analysis software (Biomedical Simulations Resource, Los Angeles, Calif.). Prior parameter estimates were derived from a population pharmacokinetic analysis of cefepime and displayed as functions of demographic variables (11). We calculated the prior estimates based on the relationships reported and obtained a point estimate for each patient in our population by using that patient's demographic variables. A one- or two-compartment open model with zero-order, time-limited infusion into the central compartment and elimination from the central compartment was fit to the data. The models were discriminated by using Akaike's information criterion (20). Volumes of distribution, CLs, and t1/2s were derived for each patient, and the pharmacokinetic profile over one dosing interval at steady state was simulated from the patient's parameter estimates. The following parameters were computed for analysis: maximum concentration in serum (Cmax), Cmin, t1/2, CL, volume of distribution at steady state, and area under the plasma cefepime concentration-time curve over 24 h (AUC24). The proportion of patients in whom the cefepime concentration was above the MIC50 and the NCCLS susceptibility breakpoint for P. aeruginosa throughout the entire dosing interval were also determined.
Second, to describe the disposition of cefepime in the patients collectively, the pharmacokinetic data were also analyzed by nonparametric expectation maximization population modeling. A two-compartment open model with first-order elimination from the central compartment and zero-order intravenous infusion was fit to the data. The following population pharmacokinetic parameters were estimated: volume of distribution in the central compartment (V1, in liters), CL (in liters per hour), and intercompartmental transfer rate constants (the rate constant from the central compartment to the peripheral compartment and the rate constant from the peripheral compartment to the central compartment, in hour−1). A general linear model was used to determine whether there was a correlation between V1 or CL (dependent variables) and demographic variables, including age, gender, race, weight, site of infection, and CLCR (independent variables). Third, the population pharmacokinetic analysis was performed again with CLCR as a covariate for CL [CL = CLi + (CLs × CLCR)], where CLi is the y intercept and CLs is the slope of the linear correlation between CL and CLCR].
Monte Carlo simulations.
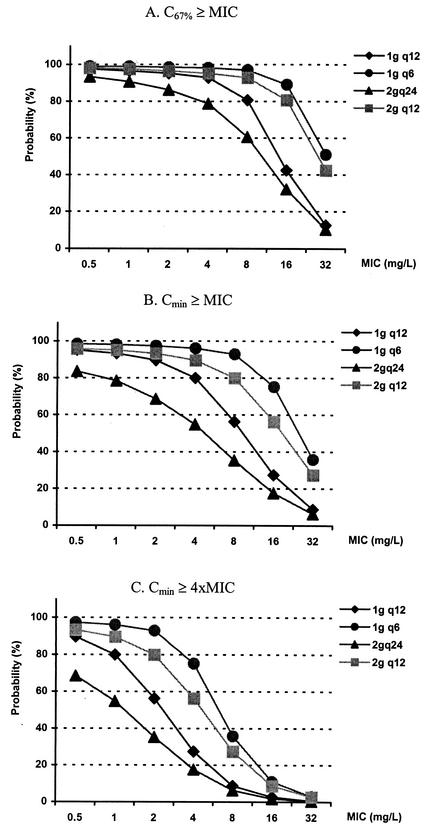
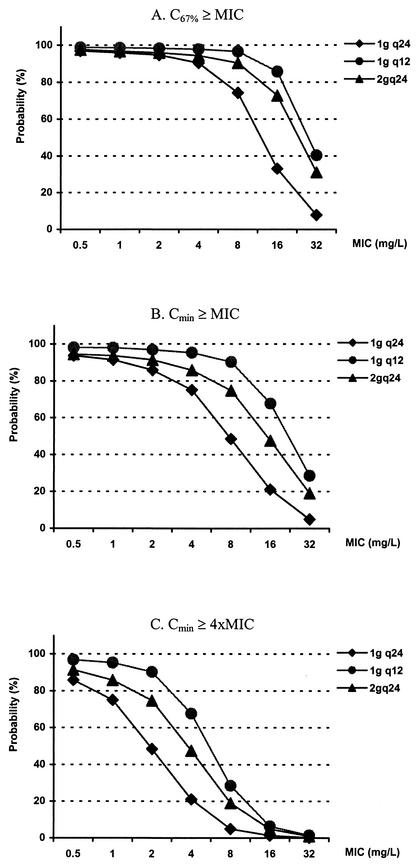
In order to assess the probability of various dosing regimens achieving pharmacodynamic targets in patients with various levels of renal function, the pharmacokinetic profiles at steady state for 1,000 patients (CLCR, 120, 60, and 30 ml/min) each receiving a particular dosing regimen were simulated by using Monte Carlo simulations. The pharmacodynamic targets chosen were a concentration at 67% of the dosing interval (C67%) greater than or equal to the MIC (C67%≥MIC), a Cmin greater than or equal to the MIC (Cmin≥MIC), and a Cmin greater than or equal to four times the MIC (Cmin≥4×MIC). The median estimates and covariance of the population pharmacokinetic parameters from the final model with covariates were used as prior estimates and in the lower triangular covariance matrix.
Statistical analysis.
Standard statistical tests (two-sample Student t test, Mann-Whitney U test, Fisher exact test, and general linear model) were used. Analysis was performed by using statistical software (SYSTAT for Windows, version 9.0; SPSS, Inc., Chicago, Ill.). Groups 2 and 3 (CLCR of between 100 and 60 ml/min and CLCR of <60 ml/min, respectively) were compared to group 1 (CLCR of >100 ml/min), used as the reference group. Bias was calculated as percent error as follows: [(observed value − predicted value)/observed value] × 100. Precision was calculated as absolute percent error as follows: [(|observed value − predicted value|)/observed value] × 100. P values of <0.05 were considered significant unless otherwise stated.
RESULTS
Patient demographics.
Thirty-six patients were enrolled; their demographics and various pharmacokinetic and pharmacodynamic parameters are shown in Table 1. Patients in group 2 and group 3 were significantly older than those in group 1 (P = 0.004 and P < 0.0001, respectively). APACHE II scores at the onset of cefepime therapy did not differ significantly among the three groups, suggesting similarly ill cohorts. Positive cultures were obtained for 22 patients; all were gram-negative bacteria except for one blood culture of S. aureus isolated in conjunction with P. aeruginosa. The respiratory tract was the predominant site of infection (23 out of 36 patients). Other sites of infection included blood (four patients), soft tissue or wound (four patients), urinary tract (three patients), and bone (two patients). All but five patients (one in group 1 and two each in groups 2 and 3) received a concurrent aminoglycoside; dosing was based on infectious disease diagnosis, body weight, and renal function, in accordance with institutional policy.
TABLE 1.
Patient demographics and pharmacokinetic and pharmacodynamic parametersa
| Parameter | Value for group:
|
||
|---|---|---|---|
| 1 | 2 | 3 | |
| CLCR criterion (ml/min) | >100 | 60-100 | 11-59 |
| Dose | 2 g q12 | 2 g q12 | 1-2 g q24b |
| N | 12 | 12 | 12 |
| Age (yr)c | 39 ± 12 | 57 ± 15d | 69 ± 14d |
| Race (no. of AA/C/O) | 6/6/0 | 8/3/1 | 10/2/0 |
| Gender (no. of M/F) | 10/2 | 8/4 | 7/5 |
| APACHE II scoree | 8 (0-15) | 15 (2-23) | 12.5 (5-32) |
| CLCR (ml/min)c | 122 ± 18 | 80 ± 11d | 35 ± 13d |
| Cmax (mg/liter)c | 259 ± 287 | 167 ± 124 | 207 ± 295 |
| Cmin (mg/liter)c | 3.3 ± 3.6 | 19.5 ± 21.5d | 14.0 ± 11.5d |
| t1/2 (h)c | 3.1 ± 2.6 | 7.6 ± 5.2d | 12.1 ± 6.3d |
| CL (liters/h)e | 7.0 ± 4.3 | 4.4 ± 2.2 | 2.6 ± 1.1d |
| Vss (liters/kg)c | 0.28 ± 0.25 | 0.46 ± 0.30 | 0.56 ± 0.30d |
| AUC24 (mg · h/liter)e | 734 ± 344 | 1,138 ± 540d | 845 ± 296 |
| Cmin ≥ MIC50 (no. of patients) | 6 | 11d | 11d |
| Cmin ≥ 8 mg/liter (no. of patients) | 1 | 8d | 7d |
AA, African American; C, Caucasian; O, other; M, male; F, female; Vss, volume of distribution at steady state.
Two grams q24 when CLCR was ≥30 but <60 ml/min and 1 g q24 when CLCR was >10 but <30 ml/min.
Mean and standard deviation.
The P value was < 0.05 in a comparison with the result obtained with a CLCR of > 100 ml/min.
Median (range) APACHE II score at the start of cefepime therapy.
Pharmacokinetic parameters.
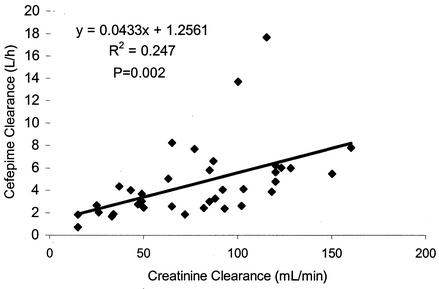
With the MAP Bayesian method, a satisfactory model fit was obtained for the majority of patients; the r2s were more than 0.98 for 33 out of 36 patients. We noticed a strong correlation between CL and CLCR (P = 0.002), as shown in Fig. 1, but the relationship was not as strong as that demonstrated for volunteers in a previous investigation (2). The bias and precision of the predictive performance of the relationship previously reported were assessed by using all three methods that we used to estimate cefepime CL. The median values determined for bias and precision with the MAP Bayesian estimation as the reference were −32 and 40%, respectively. When the population model without covariates was used as the reference, the median values determined for bias and precision were −1 and 3%, respectively. The respective values were −11 and 11% when the population model with covariates was used as the reference. The Cmax in group 2 was lower than those in the other two groups, although this result was not statistically significant. The Cmin and AUC24 value in group 2 were significantly higher than those in group 1 (P = 0.025 and P = 0.04, respectively). As expected, the cefepime t1/2 in the renally impaired groups (groups 2 and 3) was longer than that in group 1 (P = 0.02 and P = 0.0004, respectively).
FIG. 1.
Correlation between cefepime CL and CLCR.
Susceptibility.
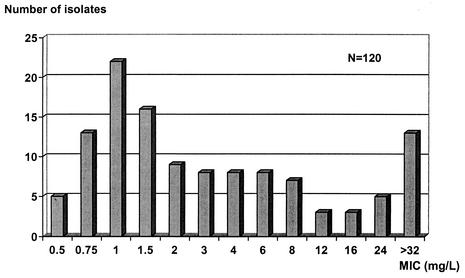
The MICs for the 120 clinical isolates of P. aeruginosa ranged from 0.5 to >32 mg/liter, as shown in Fig. 2. The MIC50 and MIC90 were found to be 2 and >32 mg/liter, respectively.
FIG.2.
MIC distribution for 120 clinical isolates of P. aeruginosa. The MIC50 was 2 mg/liter; the MIC90 was >32 mg/liter.
Pharmacodynamic parameters.
The proportion of patients in each group in whom the cefepime concentration was above the MIC50 and the NCCLS susceptibility breakpoint (8 mg/liter) throughout the dosing interval are also shown in Table 1. Higher proportions of patients in groups 2 and 3 than in group 1 achieved a Cmin greater than or equal to the MIC50 (P = 0.034). Higher proportions of patients in groups 2 and 3 than in group 1 achieved a Cmin of ≥8 mg/liter (P = 0.005 and P = 0.014, respectively).
Population pharmacokinetic analysis.
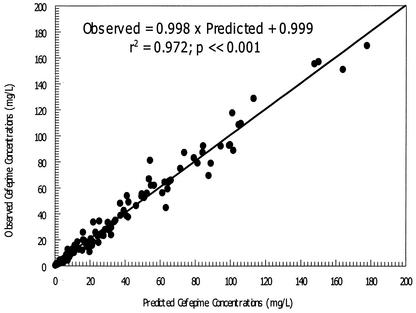
Based on the final estimates from our first analysis, CL was significantly correlated with CLCR only (P = 0.00033), while V1 was not correlated with any of the demographic variables examined. Consequently, the data were reanalyzed by using CLCR as a covariate for CL. The final estimates of the population pharmacokinetic parameters are shown in Table 2. The fit of the model to the data was satisfactory. The observed cefepime concentrations and MAP Bayesian predictions of concentrations were highly correlated (r2 = 0.972; P < 0.001), as shown in Fig. 3.
TABLE 2.
Cefepime population pharmacokinetic parametersa
| Parameter | V1 (liters) | Kcp (h−1) | Kpc (h−1) | CLi (liters/h) | CLs |
|---|---|---|---|---|---|
| Mean | 22.97 | 11.20 | 35.63 | 0.389 | 0.0628 |
| Median | 27.08 | 12.58 | 41.09 | 0.329 | 0.0551 |
| SD | 15.56 | 8.069 | 19.48 | 0.354 | 0.0324 |
CL = CLi + (CLs × CLCR). Kcp, rate constant from the central compartment to the peripheral compartment; Kpc, rate constant from the peripheral compartment to the central compartment.
FIG. 3.
Observed versus MAP Bayesian-predicted cefepime concentrations from a population pharmacokinetic model with covariates.
Monte Carlo simulations.
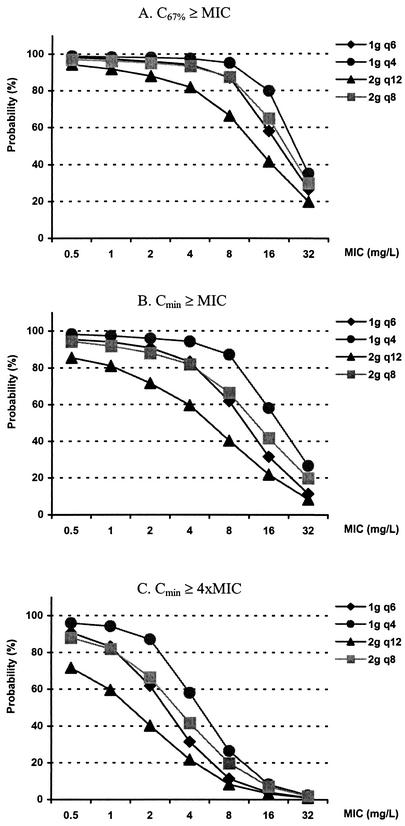
The likelihoods of pharmacodynamic target attainment are shown in Fig. 4, 5, and 6. For patients with a CLCR of 120 ml/min, the probabilities of pharmacodynamic target attainment with various dosing regimens are shown for C67%≥MIC (Fig. 4A), Cmin≥MIC (Fig. 4B), and Cmin≥4×MIC (Fig. 4C) as the pharmacodynamic targets. When the most liberal value for C67%≥MIC was used as the pharmacodynamic target, the current recommended dosage of 2 g q12 had more than an 80% likelihood of achieving an optimal target with an MIC of up to 4 mg/liter. On the other hand, when Cmin≥MIC was used as the pharmacodynamic target, an 80% probability of target attainment was achieved with an MIC of ≤1 mg/liter. Finally, when the stringent Cmin≥4×MIC was used as the pharmacodynamic target, an 80% probability of target attainment was not achieved.
FIG. 4.
Probability of target attainment in patients with a CLCR of 120 ml/min. Doses were given over 30 min every 4 h (q4), every 6 h (q6), every 8 h (q8), and q12. The current recommended dose is 2 g q12; the maximal recommended dose is 2 g q8. 4xMIC, four times the MIC.
For patients with a CLCR of 60 ml/min, an 80% probability of target attainment resulting from the recommended dose (2 g q24) was achieved with MICs of 2, 0.5, and <0.5 mg/liter when C67%≥MIC, Cmin≥MIC, and Cmin≥4×MIC were used as the targets, respectively (Fig. 5). For patients with a CLCR of 30 ml/min, the recommended dose (1 g q24) had less than an 80% likelihood of achieving an optimal target with MICs of >4, 2, and 0.5 mg/liter when the abovementioned pharmacodynamic parameters were used as the targets, respectively (Fig. 6). In all scenarios, the probability of pharmacodynamic target attainment could be increased by using a higher daily dosage or lower doses administered more frequently.
FIG. 5.
Probability of target attainment in patients with a CLCR of 60 ml/min. Doses were given over 30 min every 6 h (q6), q12, and q24. The current recommended dose is 2 g q24; the maximal recommended dose is 2 g q12. 4xMIC, four times the MIC.
FIG. 6.
Probability of target attainment in patients with a CLCR of 30 ml/min. Doses were given over 30 min q12 and q24. The current recommended dose is 1 g q24; the maximal recommended dose is 2 g q24. 4xMIC, four times the MIC.
Safety and tolerance of the study drug.
No adverse effects related to the drug or route of administration were observed in any patient during the study period.
DISCUSSION
Although the pharmacodynamics of the β-lactams are well elucidated, most data are derived from in vitro and animal studies. In view of their concentration-independent bactericidal activity and apparent lack of a postantibiotic effect against gram-negative bacteria, the T>MIC has consistently been shown to be the most important pharmacodynamic parameter governing bacterial killing (10, 19). However, there is great controversy regarding the optimal pharmacodynamic target. Time-kill studies suggested that maximal bactericidal activity is achieved at a concentration four times the MIC (8). On the other hand, Craig previously showed that maximal efficacy of cefotaxime for the Enterobacteriaceae is approached when concentrations in serum are above the MIC for 60 to 70% of the dosing interval (7). Finally, there are also data suggesting that there is a linear relationship between efficacy and the duration of time that the cefazolin concentration exceeds the MIC for Escherichia coli and the ticarcillin concentration exceeds the MIC for P. aeruginosa (19) and that maximal bactericidal activity is achieved when the concentrations of β-lactams in serum are above the MICs throughout the entire dosing interval. While T>MIC of 60 to 70% is conservative, Cmin≥MIC is also considered a reasonable pharmacodynamic target until more data become available from human studies. Nonetheless, we presented our assessments with the three representative (best, conservative, and worst) case scenarios, and decisions for dosing can be based on an individual clinician's opinion. C67%≥MIC was used for our assessment in place of T>MIC of 60 to 70% for computational convenience.
Recently, it was reported that cefepime T>MIC of 25 to 40% is necessary for a bacteriostatic effect against E. coli and K. pneumoniae in neutropenic animals (D. Andes and W. A. Craig, Abstr. 41st Intersci. Conf. Antimicrob. Agents Chemother., abstr. A-1099, p. 26, 2001). To the best of our knowledge, that study reported the most liberal pharmacodynamic target for gram-negative bacteria. It is noteworthy that the end point of that study was bacteriostasis, in contrast to optimal activity, such as concentrations to achieve 90 to 95% of the maximum effect; previous nonclinical data from the same or other laboratories (7, 8, and 19) and nonneutropenic clinical data from our group (18) did not reach a similar conclusion in experiments done to determine the optimal pharmacodynamic threshold. We have actually performed a similar assessment with these targets and found that overwhelmingly high proportions of patients would attain these targets (>97% for T>MIC of 25% and >90% for T>MIC of 40% with all susceptible isolates). In view of the likely Pseudomonas MIC distribution from various surveillance studies and the fact that these pharmacodynamic targets were derived from neutropenic animals, a very high response rate would be anticipated for immunocompetent hosts. However, the results do not seem concordant with the available nonneutropenic clinical experience (E. M. Grant, P. G. Ambrose, D. N. Nicolau, C. H. Nightingale, and R. Quintiliani, Abstr. 40th Intersci. Conf. Antimicrob. Agents Chemother., abstr. 742, p. 494, 2000). Consequently, we are unsure of their clinical relevance, but we believe that it is reasonable to consider all possibilities until more conclusive data are available.
Very limited data have been published on the correlation of pharmacodynamics of β-lactams and outcomes in clinical settings. Part of the reason may be the lack of commercial drug assays for routine practice. Alternatively, it may be perceived that β-lactams are relatively safe and so doses are generally given well in excess of the critical amounts necessary to treat various infections. Since cefepime is mostly excreted unchanged via the renal route, dosage adjustment is recommended for renal insufficiency, but the recommendations are somewhat arbitrary and based primarily on a proportional decrease in CL without taking pharmacodynamics into consideration. In addition, it is generally assumed that the standard dose of 2 g q12 is optimal in patients with normal or mild renal insufficiency for various infections. Suboptimal concentrations in serum could lead to therapeutic failure and a longer hospital stay.
Our data for patients with a CLCR of >100 ml/min are consistent with previous investigations of critically ill or adult thermal burn patients (5, 14). Using standard doses of 2 g q12, our Cmin observed in patients in group 1 (3.3 ± 3.6 mg/liter) (mean and standard deviation) was highly variable but not significantly different from those reported elsewhere (3.2 ± 2.6 mg/liter [14] and 2.3 ± 1.6 mg/liter [5]). Unlike our study, these studies included only patients with normal renal function, and none of them correlated concentrations in serum with outcomes.
Based on NCCLS susceptibility interpretive standards, microbiology laboratories report isolates of Enterobacteriaceae, Acinetobacter, and P. aeruginosa as susceptible to cefepime if the MIC is ≤8 mg/liter (16). Many laboratories report the results as susceptible, intermediate, or resistant routinely, without specifying the actual MIC data. Regardless of which pharmacodynamic target to adopt, patients receiving cefepime monotherapy based on current dosing recommendations may not receive optimal therapy when infected with a gram-negative bacterium which is reported as susceptible. This idea is reflected in our sample of clinical isolates of P. aeruginosa; for approximately 20% of the isolates, the MIC was higher than the mean Cmin in group 1 but not higher than the NCCLS susceptibility breakpoint of 8 mg/liter. On the other hand, if cefepime is used empirically before susceptibility data are available, the Cmin achieved may not be sufficient. We found that only 50% of the patients in group 1 had a Cmin higher than the MIC50 for the isolates tested. The above observations might have been biased by the small number of patients with a CLCR of >100 ml/min. Consequently, we used Monte Carlo simulations to explore the probability of achieving an optimal pharmacodynamic target for a larger sample of patients. The results were in general agreement with the above observations. Our data suggest that standard doses will suffice for most pathogens, except those with reduced susceptibility to cefepime, such as more resistant strains of P. aeruginosa.
When dosages are adjusted at a predetermined CLCR threshold, patients with a CLCR slightly below the threshold have the least likelihood of receiving optimal therapy. Therefore, we performed Monte Carlo simulations and pharmacodynamic assessments for such cohorts at risk. We showed that such patients are unlikely to receive adequate therapy with cefepime monotherapy based on the current dosing recommendations when pathogens that are less than fully susceptible are treated. Based on our observations, there are situations in which more frequent dosing should be considered. In patients with a CLCR of <60 ml/min, a fractionated total daily dose of 2 g should be administered as 1 g q12 up to a maximum of 2 g q12 (which achieves a >80% likelihood of Cmin≥MIC at an MIC of up to 8 mg/liter). For patients with a CLCR of <30 ml/min, 1 g q24 may be appropriate only when the MIC is <2 mg/liter; otherwise, the maximum recommended dose of 2 g q24 should be divided into 1 g q12 (which achieves a >80% likelihood of Cmin≥MIC at an MIC of up to 8 mg/liter). These recommendations are designed to optimize cefepime monotherapy. If suboptimal concentrations are predicted based on MICs, combination therapy may be required to provide optimal coverage.
While only the unbound drug is the pharmacologically active moiety, we have performed the analysis by using total serum drug concentrations. We believe that this strategy is justified in view of the low protein binding (<20%) in human serum (13). We have actually performed the analysis for free drug, and the outcome is inconsequentially different, with a target attainment variance of approximately 2 to 6% (data not shown).
We did not observe any adverse effects related to the drug or route of administration during the study, despite greater drug exposure in the renally impaired cohorts. This results seems to suggest that a reasonable safety margin exists if higher doses are given, at least to patients with a CLCR of >100 ml/min. Current dosing recommendations, while appropriate for the most susceptible organisms, may be suboptimal for certain patients infected with pathogens that are less than fully susceptible (e.g., MIC of ≥4 mg/liter). In these circumstances, more frequent dosing, higher doses, or combination therapy should be considered.
Acknowledgments
We thank Denise H. Rhoney and William M. Coplin for assistance with patient enrollment and data collection.
REFERENCES
- 1.Barbhaiya, R. H., S. T. Forgue, C. R. Gleason, C. A. Knupp, K. A. Pittman, D. J. Weidler, H. Movahhed, J. Tenney, and R. R. Martin. 1992. Pharmacokinetics of cefepime after single and multiple intravenous administrations in healthy subjects. Antimicrob. Agents Chemother. 36:552-557. [DOI] [PMC free article] [PubMed] [Google Scholar]
- 2.Barbhaiya, R. H., C. A. Knupp, S. T. Forgue, G. R. Matzke, D. R. P. Guay, and K. A. Pittman. 1990. Pharmacokinetics of cefepime in subjects with renal insufficiency. Clin. Pharmacol. Ther. 48:268-276. [DOI] [PubMed] [Google Scholar]
- 3.Barbhaiya, R. H., C. A. Knupp, S. T. Forgue, G. R. Matzke, C. E. Halstenson, J. A. Opsahl, and K. A. Pittman. 1991. Disposition of the cephalosporin cefepime in normal and renally impaired subjects. Drug Metab. Dispos. 19:68-73. [PubMed] [Google Scholar]
- 4.Barbhaiya, R. H., C. A. Knupp, and K. A. Pittman. 1992. Effects of age and gender on pharmacokinetics of cefepime. Antimicrob. Agents Chemother. 36:1181-1185. [DOI] [PMC free article] [PubMed] [Google Scholar]
- 5.Bonapace, C. R., R. L. White, L. V. Friedrich, E. D. Norcross, and J. A. Bosso. 1999. Pharmacokinetics of cefepime in patients with thermal burn injury. Antimicrob. Agents Chemother. 43:2848-2858. [DOI] [PMC free article] [PubMed] [Google Scholar]
- 6.Cockcroft, D. W., and M. H. Gault. 1976. Prediction of creatinine clearance from serum creatinine. Nephron 16:31-41. [DOI] [PubMed] [Google Scholar]
- 7.Craig W. A. 1995. Interrelationship between pharmacokinetics and pharmacodynamics in determining dosage regimens for broad-spectrum cephalosporins. Diagn. Microbiol. Infect. Dis. 22:89-96. [DOI] [PubMed] [Google Scholar]
- 8.Craig, W. A., and S. C. Ebert. 1991. Killing and regrowth of bacteria in vitro: a review. Scand. J. Infect. Dis. Suppl. 74:63-70. [PubMed] [Google Scholar]
- 9.Dixit, S., P. Kurle, L. Buyan-Dent, and R. D. Sheth. 2000. Status epilepticus associated with cefepime. Neurology 54:2153-2155. [DOI] [PubMed] [Google Scholar]
- 10.Ebert, S. C., and W. A. Craig. 1990. Pharmacodynamic properties of antibiotics: application to drug monitoring and dosage regimen design. Infect. Control Hosp. Epidemiol. 11:319-326. [DOI] [PubMed] [Google Scholar]
- 11.Ette, E. I., and T. M. Ludden. 1995. Population pharmacokinetic modeling: the importance of informative graphics. Pharm. Res. 12:1845-1855. [DOI] [PubMed] [Google Scholar]
- 12.Fuchs, P. C., R. N. Jones, A. L. Barry, and C. Thornsberry. 1985. Evaluation of the in vitro activity of BMY-28142, a new broad-spectrum cephalosporin. Antimicrob. Agents Chemother. 27:679-682. [DOI] [PMC free article] [PubMed] [Google Scholar]
- 13.Kessler, R. E., M. Bies, R. E. Buck, D. R. Chisholm, T. A. Pursiano, Y. H. Tsai, M. Misiek, K. E. Price, and F. Leitner. 1985. Comparison of a new cephalosporin, BMY 28142, with other broad-spectrum β-lactam antibiotics. Antimicrob. Agents Chemother. 27:207-216. [DOI] [PMC free article] [PubMed] [Google Scholar]
- 14.Lipman, J., S. C. Wallis, and C. Rickard. 1999. Low plasma cefepime levels in critically ill septic patients: pharmacokinetic modeling indicates improved troughs with revised dosing. Antimicrob. Agents Chemother. 43:2559-2561. [DOI] [PMC free article] [PubMed] [Google Scholar]
- 15.Markantonis, S. L., and E. Agathokleous-Kioupaki. 1998. Can two-, four-, or eight-hour urine collections after voluntary voiding be used instead of twenty-four-hour collections for the estimation of creatinine clearance in healthy subjects? Pharm. World Sci. 20:258-263. [DOI] [PubMed] [Google Scholar]
- 16.National Committee for Clinical Laboratory Standards. 2001. Performance standards for antimicrobial susceptibility testing. NCCLS document M100-S11, vol. 21, no. 1. National Committee for Clinical Laboratory Standards, Wayne, Pa.
- 17.Neuhauser, M. M., P. S. McKinnon, E. Hershberger, and M. J. Rybak. 2000. Pharmacokinetics and pharmacodynamics of ceftizoxime in patients with dosages adjusted for renal function. Pharmacotherapy 20:554-561. [DOI] [PubMed] [Google Scholar]
- 18.Tam, V. H., P. S. McKinnon, R. L. Akins, M. J. Rybak, and G. L. Drusano. 2002. Pharmacodynamics of cefepime in patients with Gram-negative infections. J. Antimicrob. Chemother. 50:425-428. [DOI] [PubMed] [Google Scholar]
- 19.Vogelman, B., S. Gudmundsson, J. Leggett, J. Turnidge, S. Ebert, and W. A. Craig. 1988. Correlation of antimicrobial parameters with therapeutic efficacy in an animal model. J. Infect. Dis. 158:831-847. [DOI] [PubMed] [Google Scholar]
- 20.Yamaoka, K., T. Nakagawa, and T. Uno. 1978. Application of Akaike's information criterion (AIC) in the evaluation of linear pharmacokinetic equations. J. Pharmacokinet. Biopharm. 6:165-175. [DOI] [PubMed] [Google Scholar]


