Abstract
Single-cell recordings from macaque visual cortex have shown that orientation selective neurons in area in V2 code for border ownership (Zhou et al., J. Neuroscience 20, 6594-6611, 2000): Each piece of contrast border is represented by two pools of neurons whose relative firing rate indicates the side of border ownership. Here we show that the human visual cortex uses a similar coding scheme by demonstrating a border-ownership contingent tilt aftereffect. The aftereffect was specific for the adapted location, indicating that the adapted neurons have small receptive fields. We conclude that figure-ground organization is represented by border-ownership selective neurons at early stages in the human visual cortex.
Keywords: Figure-ground segregation, border ownership, tilt aftereffect, neural coding of contour, top-down attention, visual Cortex, area V2, area V4
Introduction
The phenomenon of figure-ground segregation in perception was first studied by psychologists early in the 20th century and played an important role in the formulation of Gestalt theory which proposes that mechanisms of perceptual organization exist in visual cortex that are pre-attentive and independent of the subject’s knowledge and expectation.1-6 The existence of mechanisms of visual preprocessing at early cortical levels is now generally accepted, especially since the discovery of the receptive field properties of visual cortical neurons. However, the level where figure-ground organization occurs is still unclear, because it generally involves large-scale integration of the visual context, which runs contrary to the small size of the receptive fields at the early cortical stages. There are even doubts if mechanisms of figure-ground organization as envisioned by the Gestalt psychologists exist at all, or if the perceptual phenomenon merely reflects the general process of perceptual inference.7 However, recent psychophysical studies have shown that border-ownership8 assignment affects object recognition, specifically, detection and recognition of shape.9-11 These experiments demonstrate that border-ownership assignment precedes the processes of object recognition, in support of the hypothesis of early figure-ground organization.
Recent neurophysiological studies discovered that border ownership is represented in the neural activity in visual cortex of macaques.12 Neurons at cortical levels as early as areas V1 and V2 respond to a light-dark contrast border with different firing rates depending on whether the border is the contour of a figure on one side of their receptive field or the other (such neurons are infrequent in area V1, but common in V2 and V4). Thus, the same local stimulus produces different responses according to the image context that defines border ownership. These findings indicate that each segment of contour is represented by two pools of orientation selective neurons, one for each side of ownership. The differential activity between these pools codes for border ownership, while their average activity codes for the conventional contour attributes, such as orientation, color, movement, etc.13,14
In the present study we show that the human visual cortex uses a similar coding scheme. We use an adaptation paradigm that is based on the tilt aftereffect.15,16 Adaptation aftereffects are important tools in studying neural mechanisms in the human visual system that otherwise can only be inferred from neurophysiological studies in animals.17-19 Specifically, the tilt aftereffect has been used to show the existence of binocular orientation selective neurons,20 neurons selective for 3D tilt,21 and neurons signaling illusory contours.22,23 If the human visual cortex codes border ownership in a similar way as was found in the macaque cortex, by representing each piece of contour by two pools of neurons, then we should be able to adapt the two pools separately by making the adapting orientation contingent on border ownership.
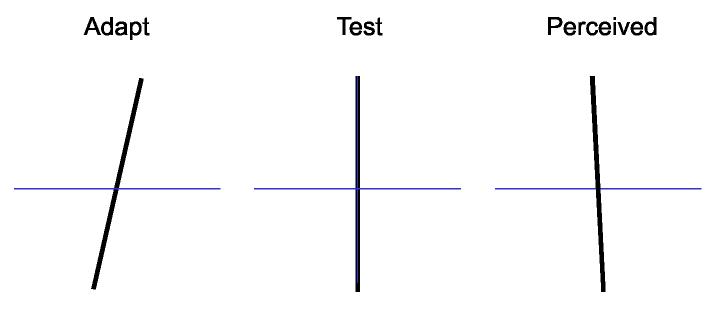
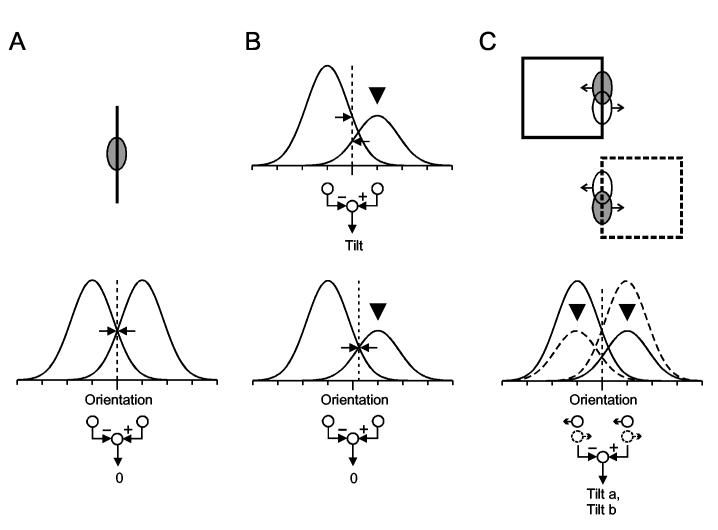
The principle of the classical tilt aftereffect15 is illustrated in Fig. 1. After inspection of a clockwise tilted line (left) for a minute or so, a vertical line (center) appears to be tilted in the opposite direction, as illustrated on the right (negative aftereffect). To perceive vertical, a test line must now be tilted slightly clockwise, that is, in the direction of the adapting tilt. Since visual information is represented in the cortex mainly by orientation-selective neurons (Hubel & Wiesel 1962) a plausible explanation for the tilt aftereffect is to assume that tilt judgments are based on a comparison of activity between two groups of neurons whose receptive fields are in the same location, but rotated by about 10-20 deg in either direction from the vertical.24 Fig. 2A, shows the hypothetical orientation tuning curves of the neurons in the two groups. When a vertical bar is presented in the receptive fields, as shown at the top, both groups are equally activated (the dashed line represents the stimulus orientation, and horizontal arrows mark the points where the line intersects with the two curves). Thus, the output of the comparator circuit, which is illustrated at the bottom, will be zero. When the bar is tilted, for example counterclockwise, the dashed line is displaced to the right (not shown) and will intersect the right curve at a higher level than the left curve. Thus, the activity of the right group of cells increases, while the activity of the left group decreases, and the comparator will give a positive signal. Prolonged stimulation with counterclockwise tilt has the effect that the gain factor of the cells in the right group is reduced (Fig. 2B, black triangle), and consequently, a vertical bar will now produce an imbalance of activity leading to a negative tilt signal (Fig. 2B top). To restore the balance, the bar must then be tilted counterclockwise (Fig. 2B bottom, dashed line displaced to the right). This model explains the finding that maximal tilt aftereffects are obtained with adapting tilts of 10-20 deg which corresponds approximately to the half width of orientation tuning of cortical cells. It also explains how the tilt judgments can be as accurate as they are, with an uncertainty of about 1 deg which is much smaller than the widths of even the narrowest neural tuning curves.
Fig. 1.
Gibson’s tilt aftereffect. After inspecting a tilted line for about a minute (‘adaptation’, a vertical test line appears slightly tilted in the direction opposite to the adapting tilt.
Fig. 2.
A plausible mechanism of the tilt aftereffect and the hypothesis of border ownership coding. A, The test line excites orientation selective cortical neurons which are tuned to a range of orientations near the vertical. The ellipse indicates the receptive field of such a neuron. Although the vertically tuned cells are activated most, tilt is detected by comparing the activity between two pools of cells tuned to orientations left and right of vertical, as shown by the bell-shaped tuning curves. Dashed line indicates the stimulus orientation; arrows indicate the corresponding activity in the two pools of cells. The comparator circuit is shown at the bottom. For vertical orientation, the activities are in balance, and the difference signal is zero. B, top: After adaptation with tilt in positive direction, the activity of the corresponding cells is reduced (black triangle). Therefore, the same vertical test line now produces different levels of activity (arrows). Hence the comparator circuit gives a negative signal (negative aftereffect). B, bottom: To restore the balance, the test line has to be tilted slightly to the side of the adapting tilt, as indicated by the shift of the dashed line. C, top: Single-cell recordings from macaque visual cortex indicate that each contour segment is represented by two pools of neurons, one for each side of ‘border ownership’ a vertical line that is contour of a figure to the left preferentially excites one pool, while a vertical line that is contour of a figure to the right excites preferentially the other pool (excitation indicated by shading of receptive field). C, bottom: Because border ownership selectively activates one of the two pools, tilt adaptation produces aftereffects that are specific for the side of border ownership. If the two pools are adapted with opposite tilts (black triangles), opposite tilt aftereffects are obtained depending on the ownership of the test line.
The hypothesis of border-ownership coding is illustrated in Fig. 2C. A vertical line activates two pools of neurons. One of these responds more strongly when the line is part of the contour of a figure on the left, the other responds more strongly when the line is part of the contour of a figure on the right (ellipses with arrows indicate the receptive fields of two example cells; higher activity is indicated by shading). According to this hypothesis, it should be possible to adapt the two pools of neurons differently, as illustrated in Fig. 2C, bottom. For example, adaptation with a clockwise tilt for left border ownership, and a counterclockwise tilt for right border ownership, as shown in Fig. 3 (top), should produce a counterclockwise tilt aftereffect in the left border ownership pool, but a clockwise tilt aftereffect in the right border ownership pool. Consequently, the perception of tilt should now depend on the ownership of the test line (Fig. 3). When tested with the right side of a square (ownership left), counterclockwise tilt should be perceived, and the opposite when tested with the left side of a square (ownership right). No tilt should be perceived for an isolated test line, because such a line activates the two border ownership pools equally, and their opposite adaptations should cancel out.
Fig. 3.
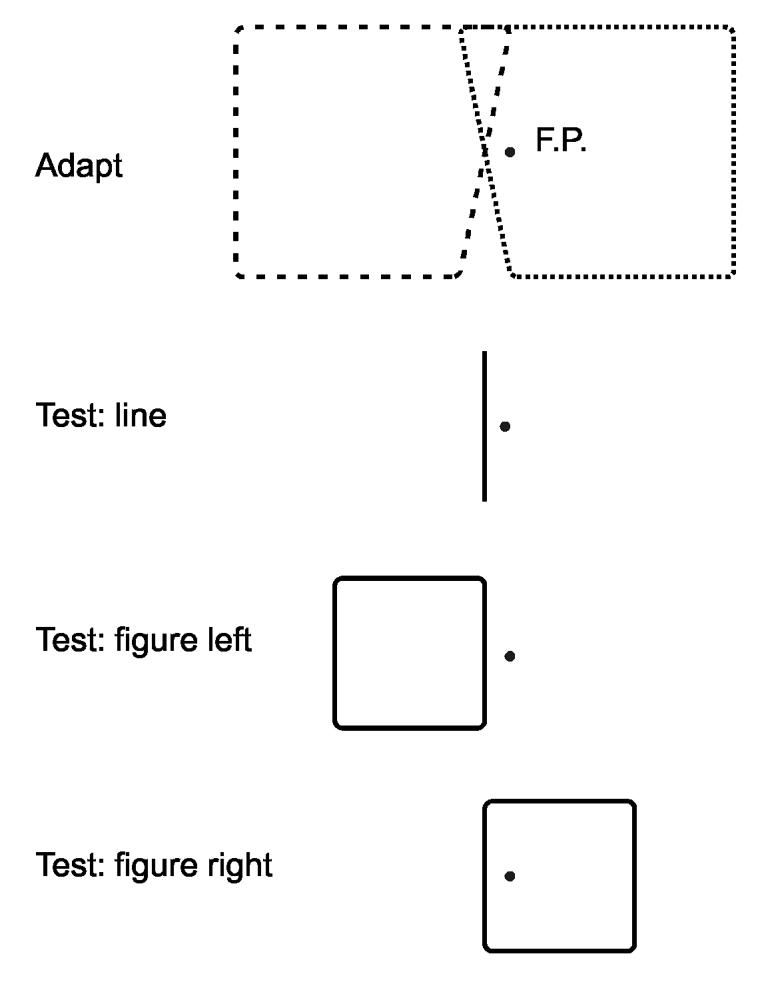
The adaptation and test figures used in Experiment 1. For adaptation, two trapezoids were presented alternatingly. F.P., fixation point. Perception of tilt was measured for an isolated line and for right and left flanks of a square. We refer to this flank or line as the ‘test line’. It was tilted randomly by angles between -3 and +3 deg, and subjects indicated the direction of tilt (method of constant stimuli). Left and right test figure locations were randomly intermixed.
Two experiments were performed to test the hypothesis of border-ownership dependence coding. In Experiment 1 we show that opposite tilt aftereffects for the two sides of border ownership can be produced simultaneously at the same location in the visual field. This demonstrates that orientation and border-ownership selective neurons exist. In a second experiment we determine whether the border-ownership contingent tilt aftereffect is specific to the adapted location in the visual field. The results show that it is sharply localized, indicating that the border-ownership selective neurons have small receptive fields and thus belong to early cortical stages.
Methods
A total of 12 subjects participated in the experiments. They were mainly undergraduate students naïve to psychophysical experiments. The subjects sat in a dimly illuminated room at a viewing distance of 1m facing a Barco CCID 121 Flat Screen color monitor on which the stimuli were displayed. A forehead and chinrest was used for head stabilization. The display had a resolution of 1280 x 1024 pixels, subtending 21 deg x 17 deg of visual angle, and a 72 Hz refresh rate. The stimuli consisted of black lines of 6 arc min width on white background. Lines, squares and trapezoids were used as shown in Fig. 3. The corners of the squares and trapezoids were rounded (outer radius 12 arc min). Anti-aliasing was used to create smooth lines of constant thickness at any orientation. A black spot of 10 arc min diameter served as fixation mark. The luminance of the black elements was about 2 cd/m2, and the luminance of the background was 49 cd/m2 in the center of the screen. Stimulus presentation and data collection were controlled by software developed in our laboratory on the basis of OpenGL and OpenInventor. The software was run on a Silicon Graphics O2 workstation.
Procedure
Subjects were adapted alternatingly with two trapezoids as shown at the top in Fig. 3. Each was presented for 1 s, with 0.2 s blank intervals, for a total of 84 s. Then, after a blank period of 1s, a test stimulus was presented for 0.2 s, and subjects had to press one of two buttons to indicate whether the test line appeared tilted to the left or right of vertical. The alternating adaptation was then resumed for another 7s (3 pairs of tilt) and after a blank period of 1s the next test stimulus was presented, and so on, until the end of the session. The test line was the left or right side of a square or trapezoid, or a single line, as shown in Fig. 3. A method of constant stimuli was used with the angle of tilt typically covering a range of 6 deg in 1 deg intervals. The location of the test figure (left or right) was varied randomly between trials, keeping the test line centered on the point of intersection of the adapting lines. In each session, 5 or 10 presentations were completed for either figure location and for each tilt angle of the test line. In total, 20 presentations were delivered for each condition. The 1 s blank period after each adaptation period was inserted to avoid a possible bias of the aftereffect by the last-presented figure. For the same reason, the starting figure of the adaptation sequence was changed between sessions so that either trapezoid was presented as the last figure in half of the trials. Prior to each adaptation run, a baseline test was performed in which subjects were presented with the same test stimuli without adaptation. Because tilt aftereffects are known to be long-lasting, only one adaptation condition (pair of trapezoids) was studied per day.
Analysis
Probit analysis (Finney 1971) was used to fit psychometric functions to the data. Each psychometric curve was based on 100 responses or more. The apparent vertical was calculated as the angle of the test line to which the subject would respond tilted left and tilted right 50% of the time. For each of the test conditions (figure left, figure right, or single line) the apparent vertical prior to adaptation (the ‘baseline’ was subtracted from the apparent vertical post adaptation. Subtraction of the baseline was important because some subjects consistently perceived the lines to be vertical when they were slightly tilted, which could be different for left and right sides of the test figure.
Results
Experiment 1: A border-ownership contingent tilt aftereffect
Adaptation was produced by alternating presentation of two trapezoids that were derived from squares measuring 5 deg on a side by tilting the right flank of one figure 12 deg clockwise and the left flank of the other figure 12 deg counterclockwise. The tilted flanks of the two figures were centered on the same point, 0.5 deg left of the fixation point, as shown at the top of Fig. 3. We call this point the adaptation position. The two adaptation figures were presented alternatingly for about a minute for initial adaptation, and subsequent shorter top-up periods between test presentations. The tilt aftereffect was measured with test figures of 3 deg size located so that either the right or the left flank was centered at the adaptation position (Fig. 3). The two figure locations were randomly alternated between trials. The tilt of this flank (the ‘test line’ was also varied randomly from trial to trial as required by the method of constant stimuli to obtain the apparent vertical. The apparent vertical was determined this way before and after adaptation (see Methods section for details of the procedure).
A size of 3 deg for the test figures was chosen to make the test line long enough to allow accurate judgment of tilt, but not too long, because pilot experiments had shown that longer lines appeared distorted after the adaptation (presumably because adaptation was not uniform over the region activated by the test line) which made tilt judgments difficult.
We used smaller figures for testing than for adaptation to avoid possible adaptation effects of features other than the tilted flanks of the trapezoids. For example, the corners at the ends of the tilted flanks might adapt different retinal positions for each adaptation figure (see Fig. 3 top). If tested with the same size of figures, this local adaptation might produce position aftereffects that might be specific for left-and right-bending corners, which would appear like a tilt aftereffect. With the larger adaptation figures, the test lines were confined to a region that was adapted only by the tilted flanks of the trapezoids, and any tilt aftereffect must be the result of adapting orientation selective neurons. This design capitalizes on the fact that the neural border ownership signals in the center of the flank of a square is rather independent of the size of the square.12,25 Thus, the prediction was that adaptation effects produced with large figures should transfer to test figures of smaller size.
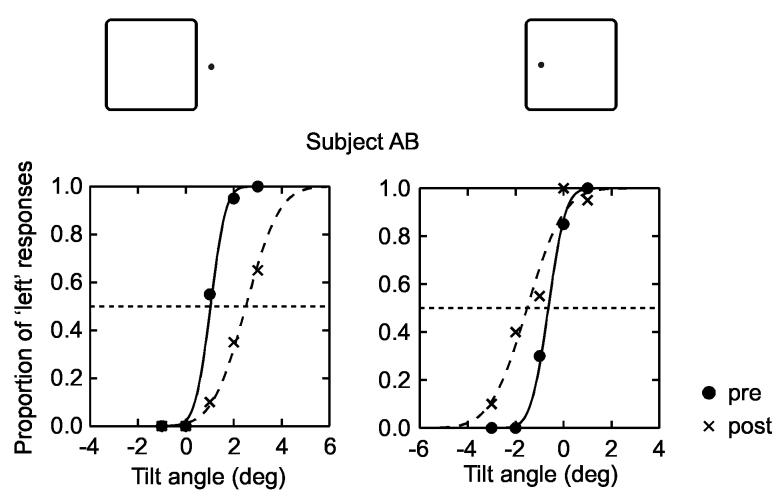
Fig. 4 shows the psychometric functions obtained from one subject. The proportions of tilt responses are plotted as a function of the angle of the test line. The two plots correspond to the two locations of test figures, as shown at the top. The curves are cumulative Gaussian distributions determined by probit analysis. Dots and solid lines represent the pre-adaptation data, crosses and dashed lines represent the post-adaptation data. It can be seen that the two post adaptation curves are displaced in opposite directions for the two locations of the test figure. When the test line was part of a figure on the left, the orientation that was perceived as vertical before the adaptation (intersection of solid curve with horizontal dashed line) produced 90% ‘right’ responses after the adaptation. But when the test line was part of a figure on the right, the previously vertical orientation produced 75% ‘left’ responses after the adaptation. Thus, the adaptation had simultaneously produced tilt aftereffects of opposite directions, depending on the side of ‘ownership’ of the test line. We also found that the size of the adaptation figure was not critical, as predicted: adaptation with a 5-deg figure produced essentially the same amount of aftereffect as adaptation with a 3-deg figure.
Fig. 4.
Demonstration of concurrent tilt aftereffects of opposite direction for the two sides of border ownership. Psychometric functions for one subject. The proportion of tilt responses is plotted as a function of the tilt of the test line for the two test figure locations (which were presented in random order). Filled dots and solid lines, pre-adaptation responses; crosses and dashed lines, post-adaptation responses. The adaptation produced a rightward shift of the psychometric function when the test figure was located on the left, and a leftward shift if the test figure was located on the right.
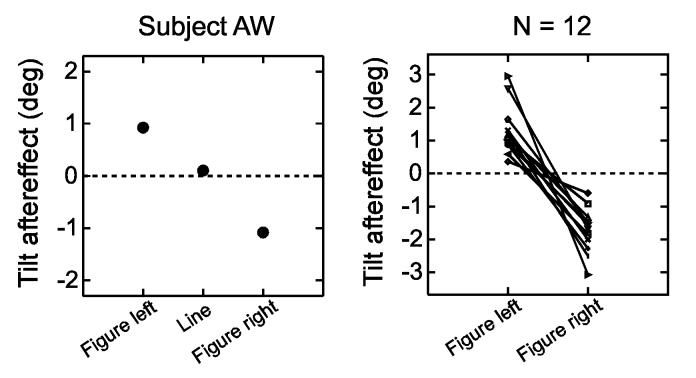
Fig. 5 shows, for 12 subjects, the magnitudes of the tilt aftereffects for the two border ownership conditions, as given by the displacements of the psychometric functions relative to the baseline functions at the 0.5-probability level. The plot on the left, for subject AW, shows also the results of testing with a single line. It can be seen that for the single test line, the adaptation effects canceled. The plot on the right shows that opposite tilt aftereffects for the two sides of test line ownership were obtained in every subject tested.
Fig. 5.
Summary of border-ownership contingent tilt aftereffects. The plots show concurrent aftereffects, as determined from the shifts of the psychometric functions. Left, results from one subject for single line and two locations of test figure. Right, results for the two test figure locations from all 12 subjects tested (N=12). Lines connect data points of same subject.
A few subjects were also tested with adaptation figures that were up-down mirror images of the trapezoids shown in Fig. 3 (right side tilted counter-clockwise, left side tilted clockwise, respectively). The results were similar. We have also measured the tilt aftereffect in the classical paradigm, adapting with a 5-deg long tilted line and testing with a 3-deg long line. This produced aftereffects that were slightly larger than either of the border-ownership contingent aftereffects.
Experiment 2: Position dependence of the border-ownership contingent aftereffect
Is the aftereffect just described a general aftereffect of shape, an aftereffect that might result from adaptation of shape selective neurons at higher cortical levels? It is conceivable, for example, that adapting with top-wide/bottom-narrow trapezoids, any square might take on the shape of a top-narrow/bottom-wide trapezoid. When a test square is then presented in the left position and the tilt of its right flank is judged, this flank would appear tilting to the left. Conversely, when a square is presented in the right test position and its left flank is judged, this flank would appear tilting to the right.
The recordings from macaque visual cortex indicated that border-ownership selective cells were frequent in area V2, where neurons have small receptive fields. Thus, if the aftereffect we are measuring is due to adaptation of those border-ownership cells, as hypothesized, it should be specific to the adapted position in visual field.
We tested this prediction by presenting the test figure at different positions relative to the adaptation position. Fig. 6 shows the results for horizontal displacement. The same location (0.5 deg left of the fixation point) was adapted as in experiment 1, and the test line was presented at the adapted position, and 1 deg to the left and right of the adaptation position, as illustrated at the top of Fig. 6. To simplify the task of focusing on the tilt of the test line, the three positions were tested in separate sessions. The border-ownership specific tilt aftereffects were determined by probit fits and by subtracting the baseline verticals from the post-adaptation verticals as in Experiment 1. The border-ownership contingent tilt aftereffect was calculated as the mean absolute value of the aftereffect for the two sides (that is, half the difference between the two values). The dots in Fig. 6 represent the aftereffects for the three test positions for the eight subjects that participated in this experiment. The lines are Gaussian curves fitted to the data points. The results show that the border-ownership contingent aftereffect is position specific. It was generally maximal at the adaptation position and dropped off sharply to both sides. The sigma values of the fitted Gaussians ranged from 0.54 to 0.73 deg, with a median of 0.69 deg.
Fig. 6.
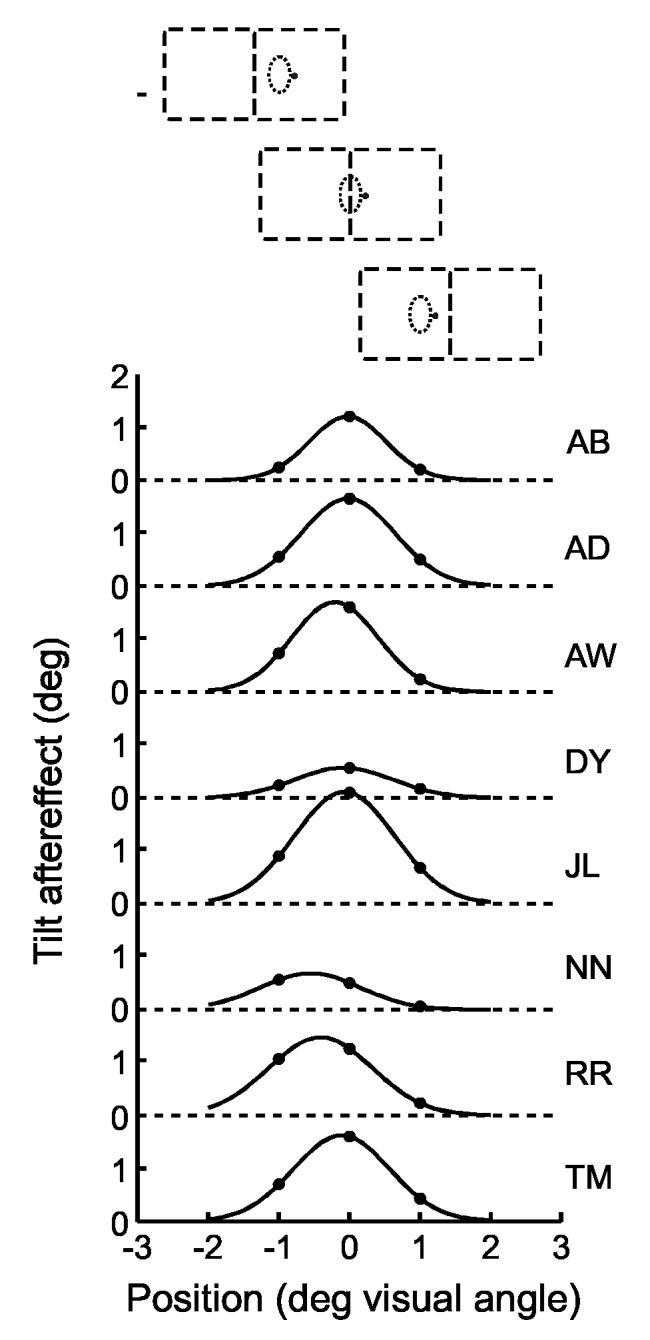
Localization of the border-ownership contingent tilt aftereffect in the visual field. One location was adapted as in Experiment 1, but three locations, displaced along the horizontal, were tested, as shown at the top (dashed lines indicate the two directions of the test figure). Dots show the absolute strength of the border-ownership contingent tilt aftereffects for the three positions of test line. Curves are Gaussian functions fitted to the data points. Data from 8 subjects. The aftereffect falls off with distance from the adapted position.
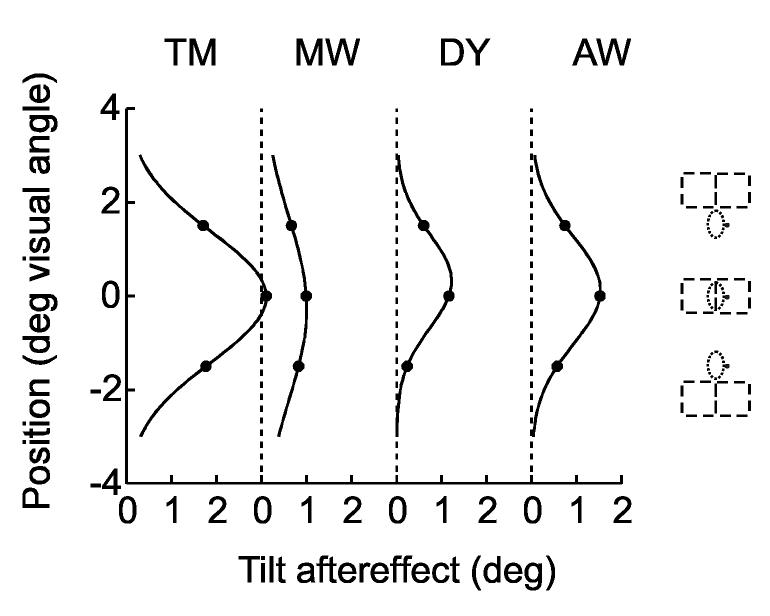
A similar experiment was performed to determine the vertical position dependence of the border-ownership contingent tilt aftereffect (Fig. 7). Because in this case the direction of displacement is along the orientation of the test line, the positions of adaptation and test lines would have overlapped for the 5-deg adaptation and 3-deg test figures. To avoid this overlap, we reduced the size of adaptation and test figures to 1.5 deg and tested three positions spaced 1.5, as illustrated on the right of Fig. 7. Curves were fitted to the data points as described above. Again the results indicated that the adaptation aftereffect was sharply localized. The sigma values of the fitted Gaussians ranged between 1.00 and 1.95 deg, with a median of 1.27 deg. The exact interpretation of these values for vertical displacements is complicated because position aftereffects from the corners might have contributed to the tilt aftereffect (which could be avoided in the case horizontal displacement by using different figure sizes for adaptation and test).
Fig. 7.
Similar experiment as in Fig. 6, but with vertical displacement. In this case, small (1.5 deg) adaptation and test figures were used to avoid overlap between adaptation and test figures in the displaced conditions.
In any case, the sharp drop of the aftereffect with distance in both tests shows that it is not a general shape aftereffect, but originates from adaptation of neurons with small receptive fields, pointing at the early cortical stages as the site of border-ownership selective adaptation.
Discussion
The nature of the neural mechanisms of figure-ground segregation is one of the old puzzles in vision research. The perceptual tendency to organize 2-dimensional displays into figure and ground regions might seem as a subtle phenomenon at first glance, but considering the importance of the task of interpreting 2D images in terms of a 3D world for any visual being, and the theoretical obstacles involved, it is clear that evolution must have developed powerful neural mechanisms that probably use all the available strategies for inferring the 3D layout of scenes.
Psychophysical studies have demonstrated the fundamental importance of border ownership in many examples, showing that the assignment of border ownership can dramatically influence the perception of 2D displays, creating amodal completion and illusory contours9 as well as transparent surfaces,26 influencing the perception of 3D shape,27 and affecting the detectability of targets in visual search,10 the recognition of objects,9 and the recognition of contour shape.11
Figure-ground mechanisms partly rely on specific depth cues such as binocular disparity, dynamic occlusion, and motion parallax. These cues directly specify the depth order of surfaces and thus border ownership. The corresponding computational strategies have been explored to some extent. However, the nature of figure-ground segregation on the basis of global shape is still enigmatic. To utilize this kind of information seems to require a comparison with contents of memory for object shape. However, such a comparison is not possible with the unstructured sensory information, but depends on the very process of figure-ground segregation.1,9,11 This chicken-and-egg problem led to the postulate of an independent stage of figure-ground organization that precedes the object recognition stage.1,4-6,28 The recent discovery of global figure-ground organization in neuronal responses of the visual cortex12,29 set the stage for studying this hypothetical stage at the neural signal level.
The present study refers to the finding of border ownership representation in macaque visual cortex12 and shows that a similar representation exists in the human visual cortex. It does this by demonstrating a border-ownership contingent tilt aftereffect: One and the same location in the visual field can be simultaneously adapted with two different orientations, resulting in different perceptions of tilt of a test line depending on the location of the figure of which the line is contour. This dual aftereffect shows the existence of neurons that are selective for border ownership. The line whose subjective tilt was measured was identical in the two ownership conditions; the only difference was the location of the three other flanks of the test square. Thus, border ownership was defined only by the image context. Note also that the adaptation figure was larger than the test figure, so that the two figures only overlapped in the test line. Therefore, the observed tilt aftereffect could not be the result of local adaptations producing distortions of other parts of the test figure.
We have further shown that the border-ownership contingent tilt aftereffect is not a generalized shape aftereffect,30,31 but results from adaptation of local feature detectors. By fitting Gaussians to the position tuning data (Fig. 6) the width of the spatial distribution of the aftereffect was estimated to have a sigma of about 0.7 deg. The average size of receptive fields at 0.5 deg eccentricity is about 1 deg in V2,32 and about 1.4 deg in V433 (these sizes refer to the “classical receptive field”). If we take four times the value of sigma as the spread of the aftereffect, this would be 2.8 deg. Since receptive field size has the effect of spreading the neural activity during the adaptation as well as the testing, half of this value, or 1.4 deg, should be compared with receptive field size. This would point to area V4. However, the comparison is skewed because, in the psychophysical experiments, residual eye movements distributed the stimulation of the adapting lines over a certain range, and the same occurred with the measured aftereffect which is the result of averaging over a range of positions of the test line. In contrast, the receptive field sizes were measured under paralysis, that is, without eye movements. Thus, the psychophysically measured position tuning overestimates the receptive field size of the adapted neurons. Therefore, we cannot draw a definite conclusion about the site of border-ownership selective neurons in human visual cortex, except that it must be an area in which neurons are selective for the orientation of lines and have relatively small receptive fields.
Can the differential tilt aftereffect be explained within the classical receptive field concept? The small estimated receptive field size contrasts with the large range of visual context integration that is evident from the differential aftereffects of the adaptation figures measuring 5 deg on a side. We did not determine the spatial limits of this influence in the present study, but the distant flanks of our adaptation figures were certainly outside the estimated receptive fields. Single-cell recordings have shown that, while stimuli just outside the small classical receptive field by themselves produce no responses at all, contours as distant as 10 deg from the receptive field can still produce border-ownership modulation of the activity evoked by the contour in the receptive field.12 In our experiment, V2 neurons (for example) that were activated by the test line could only be stimulated by the tilted flanks of the adapting trapezoids because the other flanks were outside their receptive fields. Thus, without a modulatory influence of the distant contours these neurons would have been adapted equally by the two tilts, resulting in no tilt aftereffect. It is conceivable that neurons in some higher-level area with larger receptive fields might encompass the two opposite sides of the adapting figures simultaneously, and, if such neurons were sensitive to upwards/downwards convergence of contours, they would be adapted differentially by the two trapezoids. However, the available evidence indicates that neurons with large receptive fields also show correspondingly large position invariance and thus do not produce narrow position-response functions as implicated by the curves of Fig. 6. Thus, the border-ownership contingent tilt aftereffect cannot be explained within the classical receptive field concept.
Although the tilt aftereffect has been investigated extensively in the past, we are not aware of any study of its border-ownership dependence. The aftereffects reported here are remarkably strong. The absolute values of tilt in the border-ownership contingent aftereffects ranged between 0.5 deg and 3 deg (median 1.4 deg), while about 1.5-3 deg were typically obtained with the classical paradigm.23 The magnitude of the border-ownership contingent aftereffect is surprising if one considers that only a fraction of neurons in any cortical area studied so far in monkey are influenced by border ownership. The influence was strongest in V2 where about 50% of the orientation selective neurons showed a detectable border ownership modulation, and about 30% showed a twofold or greater modulation of the firing rate.12 Thus, neither the adaptation nor the test stimuli presumably activated border ownership cells exclusively, so that the adaptation paradigm did not separate the two pools of cells completely. Thus, the observed aftereffect is stronger than what would be expected from the average border-ownership selectivity of the neurons.
The explanation we suggest is that subjects, in judging the tilt of one side of the figure, process the whole shape of the figure and thus ‘tune in’ to those neurons that participate in the representation of the figure. We assume that this representation is not the activity of all neurons that respond to the figure, but only of those that are border-ownership selective, with the proper side preference, because it is the activity of those neurons that relates the contours to a figure. In other words, we assume that the border-ownership selective neurons are part of circuits that serve to ‘bind’ contour features to larger entities. The function of these circuits is to enable top-down mechanisms to retrieve those features as a whole, so that they can be processed as required for a given task, in our case the shape discrimination. Thus, the tilt aftereffect may not reflect the average adaptation of all neurons that are activated by the figure, but only of those with the corresponding border-ownership selectivity. This explanation is in line with the basic observation of the Gestalt psychologists that only the shapes of ‘figure’ regions, that is, regions that ‘own’ their borders, are consciously processed, whereas regions that do not own their borders are relegated to the ‘ground’ and not processed further.
Footnotes
Supported by: NIH grants EY02966 and NS38034
References and Notes
- 1.Rubin E. Visuell wahrgenommene Figuren. Gyldendal; Copenhagen: 1921. [Google Scholar]
- 2.Wertheimer M. “Laws of Organization in Perceptual Forms”. In: Yantis S, editor. Visual perception: essential readings. Psychology Press; Philadelphia: 2001. [Google Scholar]
- 3.Rubin E. “Visuell wahrgenommene Figuren”. In: Yantis S, editor. Visual perception: essential readings. Psychology Press; Philadelphia: 2001. [Google Scholar]
- 4.Wertheimer M. “Untersuchungen zur Lehre von der Gestalt II,”. Psychol. Forsch. 1923;4:301–350. [Google Scholar]
- 5.Koffka K. Principles of Gestalt Psychology. Harcourt, Brace and World; New York: 1935. [Google Scholar]
- 6.Kanizsa G. Organization in Vision. Essays on Gestalt Perception. Praeger; New York: 1979. [Google Scholar]
- 7.Harris J. “Gestalt Theory”. In: Gregory RL, editor. The Oxford Companion to the Mind. Oxford University Press; Oxford: 1987. [Google Scholar]
- 8. Border ownership is a term for the phenomenon that visual borders (e.g. a light-dark border produced by a step in luminance) tend to be perceived as the boundary of a region, that is, each border appears to be ‘owned’ by the region on one side, the ‘figure’, while the region on the other side is relegated to the ‘ground’ which does not have a visible border and whose form is thus not defined. Theoretically, assigning border ownership, and labeling regions according to the depth order of surfaces are just two different ways of coding the occlusion structure in images of 3D scenes.
- 9.Nakayama K, Shimojo S, Silverman GH. “Stereoscopic depth: its relation to image segmentation, grouping, and the recognition of occluded objects,”. Perception. 1989;18:55–68. doi: 10.1068/p180055. [DOI] [PubMed] [Google Scholar]
- 10.He ZJ, Nakayama K. “Surfaces versus features in visual search,”. Nature. 1992;359:231–233. doi: 10.1038/359231a0. [DOI] [PubMed] [Google Scholar]
- 11.Driver J, Baylis GC. “Edge-assignment and figure-ground segmentation in short-term visual matching,”. Cogn. Psychol. 1996;31:248–306. doi: 10.1006/cogp.1996.0018. [DOI] [PubMed] [Google Scholar]
- 12.Zhou H, Friedman HS, von der Heydt R. “Coding of border ownership in monkey visual cortex,”. J. Neurosci. 2000;20:6594–6611. doi: 10.1523/JNEUROSCI.20-17-06594.2000. [DOI] [PMC free article] [PubMed] [Google Scholar]
- 13.von der Heydt R, Zhou H, Friedman HS. “Neural coding of border ownership: Implications for the theory of figure-ground perception”. In: Behrmann M, Kimchi R, Olson CR, editors. Perceptual Organization in Vision: Behavioral and Neural Perspectives. Lawrence Erlbaum Associates; Mahwah: 2003. [Google Scholar]
- 14.von der Heydt R. “Image parsing mechanisms of the visual cortex”. In: Werner JS, Chalupa LM, editors. The Visual Neurosciences. MIT press; Cambridge, Mass: 2003. [Google Scholar]
- 15.Gibson JJ, Radner M. “Adaptation, after-effect and contrast in the perception of tilted lines. I. Quantitative studies,”. J. Exp. Psychol. 1937;20:453–467. [Google Scholar]
- 16.Gibson JJ. “Adaptation, after-effect and contrast in the perception of curved lines,”. J. Exp. Psychol. 1933;16:1–31. [Google Scholar]
- 17.De Valois RL, Walraven J. “Monocular and binocular aftereffects of chromatic adaptation,”. Science. 1967;155:463–465. doi: 10.1126/science.155.3761.463. [DOI] [PubMed] [Google Scholar]
- 18.Blakemore C, Campbell FW. “On the existence of neurones in the human visual system selectively sensitive to the orientation and size of retinal images,”. J. Physiol. (Lond) 1969;203:237–260. doi: 10.1113/jphysiol.1969.sp008862. [DOI] [PMC free article] [PubMed] [Google Scholar]
- 19.De Valois KK. “Spatial frequency adaptation can enhance contrast sensitivity,”. Vision Res. 1977;17:1057–1065. doi: 10.1016/0042-6989(77)90010-4. [DOI] [PubMed] [Google Scholar]
- 20.Campbell FW, Maffei L. “The tilt after-effect: a fresh look,”. Vision Res. 1971;11:833–840. doi: 10.1016/0042-6989(71)90005-8. [DOI] [PubMed] [Google Scholar]
- 21.De Valois KK, der Heydt R. von , Adorjani C, De Valois RL. “A tilt aftereffect in depth,”. Assoc. Vis. Res. Opthalmol. 1975;15(90) [Google Scholar]
- 22.Smith A, Over R. “Tilt aftereffects with subjective contours,”. Nature. 1975;257:581–582. doi: 10.1038/257581a0. [DOI] [PubMed] [Google Scholar]
- 23.Paradiso MA, Shimojo S, Nakayama K. “Subjective contours, tilt aftereffects, and visual cortical organization,”. Vision Res. 1989;29:1205–1213. doi: 10.1016/0042-6989(89)90066-7. [DOI] [PubMed] [Google Scholar]
- 24.Regan D, Beverley KI. “Postadaptation orientation discrimination,”. J. Opt. Soc. Am. (A) 1985;2:147–155. doi: 10.1364/josaa.2.000147. [DOI] [PubMed] [Google Scholar]
- 25.Qiu FT, von der Heydt R. “Figure and ground in the visual cortex: V2 combines stereoscopic cues with Gestalt rules,”. Neuron. 2004 doi: 10.1016/j.neuron.2005.05.028. [DOI] [PMC free article] [PubMed] [Google Scholar]
- 26.Nakayama K, Shimojo S, Ramachandran VS. “Transparency: relation to depth, subjective contours, luminance and neon color spreading,”. Perception. 1990;19:497–513. doi: 10.1068/p190497. [DOI] [PubMed] [Google Scholar]
- 27.Nakayama K, Shimojo S. “Experiencing and perceiving visual surfaces,”. Science. 1992;257:1357–1363. doi: 10.1126/science.1529336. [DOI] [PubMed] [Google Scholar]
- 28.Neisser U. Cognitive Psychology. Appleton-Century-Crofts; New York: 1967. [Google Scholar]
- 29.Lamme VAF. “The neurophysiology of figure-ground segregation in primary visual cortex,”. J. Neurosci. 1995;15:1605–1615. doi: 10.1523/JNEUROSCI.15-02-01605.1995. [DOI] [PMC free article] [PubMed] [Google Scholar]
- 30.Regan D, Hamstra SJ. “Shape discrimination and the judgement of perfect symmetrydissociation of shape from size,”. Vision Res. 1992;32:1845–1864. doi: 10.1016/0042-6989(92)90046-l. [DOI] [PubMed] [Google Scholar]
- 31.Suzuki S, Cavanagh P. “A shape-contrast effect for briefly presented stimuli [In Process Citation],”. J. Exp. Psychol. Hum. Percept. Perform. 1998;24:1315–1341. doi: 10.1037//0096-1523.24.5.1315. [DOI] [PubMed] [Google Scholar]
- 32.Gattass R, Gross CG, Sandell JH. “Visual topography of V2 in the macaque,”. J. Comp. Neurol. 1981;201:519–539. doi: 10.1002/cne.902010405. [DOI] [PubMed] [Google Scholar]
- 33.Gattass R, Sousa APB, Gross CG. “Visuotopic organization and extent of V3 and V4 of the macaque,”. J. Neurosci. 1988;8:1831–1845. doi: 10.1523/JNEUROSCI.08-06-01831.1988. [DOI] [PMC free article] [PubMed] [Google Scholar]


