

Abstract
S1P (sphingosine 1-phosphate) receptor expression and the effects of S1P on migration were studied in one papillary (NPA), two follicular (ML-1, WRO) and two anaplastic (FRO, ARO) thyroid cancer cell lines, as well as in human thyroid cells in primary culture. Additionally, the effects of S1P on proliferation, adhesion and calcium signalling were addressed in ML-1 and FRO cells. All cell types expressed multiple S1P receptors. S1P evoked intracellular calcium signalling in primary cultures, ML-1 cells and FRO cells. Neither proliferation nor migration was affected in primary cultures, whereas S1P partly inhibited proliferation in ML-1 and FRO cells. Low nanomolar concentrations of S1P inhibited migration in FRO, WRO and ARO cells, but stimulated ML-1 cell migration. Consistently, S1P1 and S1P3, which mediate migratory responses, were strongly expressed in ML-1 cells, and S1P2, which inhibits migration, was the dominating receptor in the other cell lines. The migratory effect in ML-1 cells was mediated by Gi and phosphatidylinositol 3-kinase. Both S1P and the S1P1-specific agonist SEW-2871 induced Akt phosphorylation at Ser473. However, SEW-2871 failed to stimulate migration, whereas the S1P1/S1P3 antagonist VPC 23019 inhibited S1P-induced migration. The results suggest that aberrant S1P receptor expression may enhance thyroid cancer cell migration and thus contribute to the metastatic behaviour of some thyroid tumours.
Keywords: calcium, motility, proliferation, sphingosine 1-phosphate, thyroid, tumour
Abbreviations: AM, acetoxymethyl ester; BCA, bicinchoninic acid; [Ca2+]i, intracellular free calcium concentrations; CHO, Chinese-hamster ovary; DMEM, Dulbecco's modified Eagle's medium; FCS, foetal calf serum; HBSS, Hanks buffered saline solution; MAPK, mitogen-activated protein kinase; PBGD, porphobilinogen deaminase; PI3K, phosphatidylinositol 3-kinase; Ptx, pertussis toxin; ROCK, Rho-associated kinase; RT, reverse transcriptase; S1P, sphingosine 1-phosphate; TBS, Tris-buffered saline; TCA, trichloroacetic acid; TSH, thyrotrophin
INTRODUCTION
S1P (sphingosine 1-phosphate) is a bioactive lipid that regulates central cellular processes, such as cell growth, survival, differentiation and motility [1–4]. S1P is present in plasma and serum at high nanomolar concentrations [5,6]. Platelets store S1P and release it into the blood [5,7] where its concentration is tightly controlled by ectoenzyme activity and distribution among plasma proteins [6,8]. Extracellular S1P may also be produced locally by other cell types, e.g. glioma cells [9], mouse melanoma cells and fibroblasts [10]. The effects of extracellular S1P are mediated by G-protein coupled receptors, termed S1P1–5 [11], which regulate multiple intracellular pathways [3,12,13]. Some of the effects of S1P are mediated by intracellular S1P acting on unknown targets [14].
S1P may either inhibit or stimulate cellular motility, depending on cell type and S1P concentration [4,12]. Differences in migratory responses correlate well with differences in S1P receptor expression, both in vitro and in vivo [4,15–18]. S1P receptors regulate migration by modulating the activity of the Rho family of GTPases [4,12]. S1P1- and S1P3-induced migration involves Gi-mediated activation of PI3K (phosphatidylinositol 3-kinase), Akt and Rac [12]. S1P2 signals via G12/13 to activate Rho and to inhibit Rac-dependent signalling, which results in an inhibitory effect of S1P on migration [12,16,19]. S1P4 is mainly expressed in cells of the immune system [13] and stimulates migration of transfected CHO (Chinese-hamster ovary) cells by activating cdc42 in a Ptx (pertussis toxin)-sensitive manner [20]. The effects of S1P5 on migration have not, to our knowledge, been clarified.
S1P is implicated in several of the key cellular events in cancer growth and metastasis [21]. On the other hand, S1P has been shown to inhibit metastasis of mouse melanoma cells in vivo [16]. S1P modulates central intracellular cascades, as well as regulating proliferation of rat thyroid cells, which express S1P2, S1P3 and S1P5 [22–25]. However, a possible role for S1P in human thyroid cells has not previously been investigated, nor has the importance of S1P in thyroid tumour growth and metastasis been addressed.
We have determined the relative expression level of S1P receptors in one human papillary (NPA), two human follicular (ML-1, WRO) and two human anaplastic (FRO, ARO) thyroid cancer cell lines, as well as in primary cultures of normal human thyroid cells. Furthermore, we have investigated the cellular responses to S1P stimulation (proliferation, adhesion, migration and calcium signalling) in all of these cell types. The S1P receptor expression pattern differs significantly between the cell types investigated, which is reflected in their responses to S1P stimulation. Most notably, the follicular thyroid tumour cell line ML-1, which was originally isolated from an aggressive tumour [26], showed high expression of the migration-inducing S1P receptors S1P1 and S1P3. In line with this, nanomolar concentrations of S1P induced migration of ML-1 cells, whereas migration was inhibited by S1P in the other cell lines. Furthermore, the S1P1/3 antagonist VPC 23019 inhibited migration towards S1P in ML-1 cells. In primary cultures of thyroid cells, S1P evoked a modest calcium response, but did not affect migration or proliferation. Our results imply that aberrant S1P receptor expression may contribute to the aggressive phenotype of some thyroid tumours.
EXPERIMENTAL
Materials
DMEM (Dulbecco's modified Eagle's medium), bovine TSH (thyrotrophin), porcine insulin, fatty-acid-free BSA and Ptx were purchased from Sigma (St. Louis, MO, U.S.A.). Coon's modified Ham's F-12 medium, FCS (foetal calf serum), penicillin/streptomycin, trypsin and L-glutamine were from GIBCO® (Grand Island, NY, U.S.A.). Type 2 collagenase was from Worthington Biochemicals (Lakewood, NJ, U.S.A.). Non-essential amino acids and RPMI were obtained from Cambrex Bio Science (Verviers, Belgium). Cell culture plasticware, and human type I and type IV collagen and fibronectin were purchased from Becton Dickinson Biosciences (Bedford, MA, U.S.A.). [methyl-3H]Thymidine (82 Ci/mmol) was from Amersham Biosciences (Little Chalfont, U.K.) and CellTiter 96® AQueous One Solution cell proliferation assay from Promega Corp. (Madison, WI, U.S.A.). Transwell™ inserts for migration assays and 96-well plates for adhesion experiments were from Corning Inc (Corning, NY, U.S.A.). S1P and SEW-2871 were from Biomol (Plymouth, PA, U.S.A.). VPC 23019 was obtained from Avanti Polar Lipids (Alabaster, AL, U.S.A.), SB203580, wortmannin and Y-27632 from Calbiochem (San Diego, CA, U.S.A.) and Clostridium botulinum C3 exotoxin from List Biological Laboratories Inc. (Campbell, CA, U.S.A.). The ProJect transfection reagent and the BCA (bicinchoninic acid) protein assay reagent kit were purchased from Pierce Biotechnology (Rockford, IL, U.S.A.). The FACE™ Akt ELISA kit was from Active Motif (Carlsbad, CA, U.S.A.). The anti-Akt- and anti-(phospho-Thr308)-specific Akt antibodies used in Western blotting, as well as the positive and negative protein controls for phosphorylated Akt, were purchased from Cell Signaling Technology (Danvers, MA, U.S.A.). The horseradish-peroxidase-conjugated goat anti-rabbit antibody and the Aurum™ total RNA isolation kit were obtained from BioRad Laboratories (Hercules, CA, U.S.A.). Nitrocellulose membranes were from Schleicher & Schuell (Dassel, Germany). The RiboGreen® RNA quantification reagent and fura 2-AM (acetoxymethyl ester) were purchased from Molecular Probes (Eugene, OR, U.S.A.). SuperScript III RT (reverse transcriptase) was from Invitrogen (Carlsbad, CA, U.S.A.) and oligo(dT) primers from Promega Corp. The LightCycler FastStart DNA Master SYBR Green kit was obtained from Roche Diagnostics (Mannheim, Germany). PCR primers were synthesized by TAGC (Copenhagen, Denmark). All chemicals for RNA isolation and RT-PCR were of molecular biology grade, and all other chemicals of reagent grade.
Cell culture
ML-1 thyroid follicular cancer cells, provided kindly by Dr Johann Schönberger (University of Regensburg, Germany), were cultured essentially as described previously [26] in DMEM with 2 mM L-glutamine, 10% (v/v) FCS and 100 units/ml of penicillin and streptomycin. NPA papillary and WRO follicular thyroid cancer cells were a gift from Dr Sylvia Asa (University Health Network and Toronto Medical Laboratories, Toronto, Canada). FRO and ARO anaplastic thyroid cancer cell lines were provided generously by Dr James Fagin (University of Cincinnati, Ohio, U.S.A.). ARO, FRO, WRO and NPA cells were grown in RPMI medium with 0.1 mM non-essential amino acids, 2 mM L-glutamine, 10% (v/v) FCS and 50 units/ml of penicillin and streptomycin. Human thyroid follicular cells were prepared from surgical specimens as described previously [27]. In brief, thyroid tissue (normal and multinodular goitre) was digested using 0.2% collagenase. Follicles were plated in Coon's modified Ham's F12 medium with 0.3 units/l TSH, 1 μg/ml insulin, 100 units/ml penicillin, 100 mg/l streptomycin and 1% (v/v) FCS. After 72 h, serum was removed and the medium was changed every 3 days. All cell cultures were maintained at 37 °C in a 5% CO2 atmosphere in a humidified cell culture chamber.
Relative quantitative RT-PCR
RNA was isolated with the Aurum™ total RNA isolation kit according to the manufacturer's instructions. RNA was quantified with RiboGreen reagent, and RNA quality and integrity was checked by absorbance spectrometry and agarose gel electrophoresis. Reverse transcription reactions were performed on 0.5 μg total RNA using SuperScript III RT and oligo(dT) primers following the manufacturer's instructions.
Quantitative RT-PCR was performed on a LightCycler instrument (Roche) with LightCycler DNA Master Kit reagents, and the following cycling conditions: preincubation 95 °C 10 min, amplification 45–50 cycles (95 °C for 15 s; annealing temperature °C for 5 s; and 72 °C for 9 s). The primers (0.5 μM), and the primer-specific amplification conditions are listed in Table 1. Relative mRNA levels were calculated with the LightCycler software. Control analyses, in which RT was omitted from the cDNA synthesis reaction, were performed for each of the RNA preparations to ensure that the preparations were not contaminated with genomic DNA. A melting curve analysis was performed for each run to ensure correct amplification. The data was related to the amount of total RNA [28]. For comparison, the data was also analysed with PBGD (porphobilinogen deaminase) as a reference gene.
Table 1. PCR primers and cycling conditions for quantification of S1P-receptors in thyroid cancer cells.
The primers for S1P2-5 were designed with the EMBOSS ePrimer3. The primer sequences for S1P1 [54] and PBGD [55] are from the literature. s, sense strand; as, antisense strand; T, temperature.
| mRNA | Primer sequences | Product length (bp) | [MgCl2], mM | Annealing T °C | Product melting T °C |
|---|---|---|---|---|---|
| S1P1 | s 5′-GGCTGGAACTGCATCAGTGCG-3′ | 223 | 4 | 60 | 89–90 |
| as 5′-GAGCAGCGCCACATTCTCAGAGC-3′ | |||||
| S1P2 | s 5′-CCGAAACAGCAAGTTCCACT-3′ | 197 | 2 | 61 | 90 |
| as 5′-CCAGGAGGCTGAAGACAGAG-3′ | |||||
| S1P3 | s 5′-AAGGCTCAGTGGTTCATCGT-3′ | 201 | 2 | 61 | 92–93 |
| as 5′-GCTATTGTTGCTGCTGCTTG-3′ | |||||
| S1P4 | s 5′-CCTTCAGCCTGCTCTTCACT-3′ | 223 | 4 | 64 | 94 |
| as 5′-AAGAGGATGTAGCGCTTGGA-3′ | |||||
| S1P5 | s 5′-AGGACTTCGCTTTTGCTCTG-3′ | 201 | 3 | 59 | 87 |
| as 5′-TCTAGAATCCACGGGGTCTG-3′ | |||||
| PBGD | s 5′-TCCAAGCGGAGCCATGTCTG-3′ | 204 | 3 | 62 | 89 |
| as 5′-AGAATCTTGTCCCCTGTGGTGGA-3′ |
Measurement of [Ca2+]i (intracellular free calcium concentrations)
The cell lines were harvested with Ca2+-free HBSS (Hanks buffered saline solution; 118 mM NaCl, 4.6 mM KCl, 10 mM glucose and 20 mM Hepes, pH 7.2) containing 0.02% EDTA and 0.1% trypsin. After washing the cells three times with HBSS (containing 1 mM CaCl2), the cells were incubated with 1 μM fura 2-AM for 30 min at 37 °C. After washing twice, the cells were kept in darkness for a minimum of 10 min and washed again prior to the experiment. The cell suspension was added to a quartz cuvette, maintained at 37 °C and stirred throughout the experiment. A 125 μM stock solution of S1P was made in HBSS containing 4 mg/ml fatty-acid-free BSA. The cells were stimulated with the indicated concentrations of S1P and fura 2 emission was measured with a Hitachi 2000 fluorescence spectrophotometer. The excitation wavelengths were 340 and 380 nm, and emission was measured at 510 nm. The signal was calibrated by the addition of 0.05% Triton X-10 to lyse the cells and obtain maximal fluorescence. Tris-base was used to elevate pH above 8.3 and extracellular Ca2+ was chelated with 10 mM EGTA to obtain minimal fluorescence. [Ca2+]i was calculated as described in [29], using a program designed for the fluorimeter and a Kd value of 224 nM for fura 2.
The primary thyroid cells, cultured on poly(D-lysine)-coated coverslips, were washed and incubated with 2 μM fura 2-AM as described above, and Ca2+ signals were measured as described before [30]. Cells were placed on the stage of an upright microscope (Olympus BW501) and examined through a 60× water-immersion objective. Images were captured using an intensified GenIV camera (Universal Imaging, Marlow, U.K.) and analysed with MetaFluor software (Universal Imaging Corporation, West Chester, PA, U.S.A.). After measuring a baseline for 60 s, the cells were perfused with S1P for 60 s after which time the perfusion apparatus was turned off for 30 s. Then S1P was washed away with HBSS and the measurement was continued for a further 5 min.
Measurement of intracellular inositol phosphates
Inositol phosphates were measured essentially as described by Oldham [31]. Cells were plated onto 100 mm diameter cell culture plates at a density of 750000 cells/plate and cultured as described above for 4 days. [myo-3H]inositol (1 μCi/ml) was added and the cells were allowed to grow for an additional 48 h. Cells were detached with trypsin and washed with HBSS, after which they were incubated with 100 nM S1P for 30 s at 37 °C. The reaction was terminated by the addition of an equal volume of ice-cold 10% (v/v) perchloric acid and then centrifuged at 1937 g for 5 min at 4 °C. The supernatant was transferred to fresh tubes and neutralized with 1,1,2-trichlorofluoroethane/tri-n-octylamine (1:1, v/v). The samples were centrifuged at 1037 g for 5 min and the upper phase was passed through Amprep™ columns that had been activated with 1M KOH. After washing the columns with distilled water to remove neutral compounds, inositol phosphates were eluted by 5 ml of 0.17 M KOH. A 1 ml portion of the effluent was mixed with 4 ml of scintillation fluid and the radioactivity was measured using a Wallac 1410 scintillation counter.
Measurement of [3H]thymidine incorporation and proliferation
The thyroid cancer cell lines were grown in medium containing 10% (v/v) dextran-treated-charcoal-stripped FCS for 2 days. Primary cultures of thyroid cells were grown in serum-free medium with TSH (0.3 units/l) and insulin (1 mg/l) or untreated. The cells were stimulated with S1P for 24 h or 48 h, with 0.4–1 μCi/ml of [3H]thymidine, which was added for the last 4 h of the incubation. FCS (10%, v/v) was used as a positive control for the primary thyroid cultures. At the end of the experiment the cells were washed three times with cold PBS, and the assays were terminated by addition of ice-cold 5% (v/v) TCA (trichloroacetic acid). After 10 min on ice, the TCA was aspirated and the TCA-insoluble precipitate was dissolved in 0.1 M NaOH, and then the radioactivity was measured. The results were confirmed with the CellTiter proliferation assay, as described by the manufacturer and by cell counting.
Cell adhesion
Cell adhesion experiments were performed as described previously [32–34] with modifications. The cells were washed with PBS and grown in serum-free medium containing 0.1% fatty-acid-free BSA the day before the experiment. Then the cells were preincubated with S1P for 1 or 24 h. 96-well plates were coated with 5 μg/cm2 collagen IV, collagen I or fibronectin for 1 h, after which the wells were rinsed and blocked with 3% fatty-acid-free BSA for 30 min. Cells in serum-free medium with S1P or untreated, were added to each well and incubated at 37 °C. The cells were allowed to attach for 1 h, then fixed with 70% (v/v) ethanol for 20 min, and stained with 1 mg/ml Crystal Violet in 20% (v/v) methanol for 10 min. After washing with water the wells were allowed to dry. The Crystal Violet was dissolved in 10% (v/v) acetic acid and the absorbance measured at 570 nm.
Cell migration
Migration experiments were performed on 6.5 mm-diameter Transwell chambers with 8 μM pore size. The membranes were coated with 5 μg/cm2 collagen IV, and reconstituted with serum-free medium for 1 h at 37 °C prior to the experiment. FRO cells failed to migrate on a collagen IV matrix, therefore collagen I was used. The cell lines were grown in serum-free medium the day before the experiment. In some experiments the cells were preincubated with one of the following inhibitors: 100 ng/ml Ptx, overnight; 5 μM SB203580 for 1 h; 10 μM Y-27632 for 1 h; 100 ng/ml wortmannin for 1 h; 1 μM VPC 23019 for 1 h; or 100 ng/ml C3 exotoxin in the presence of ProJect protein transfection reagent for 4 h. A 200 μl portion of cell suspension was added to the upper wells and 800 μl serum-free medium with S1P or untreated, and/or charcoal-stripped FCS was added to the lower wells. In experiments with inhibitors, the inhibitor was present in both chambers during the experiment. With ML-1 cells, additional experiments where S1P was added to both the upper and the lower wells were performed to test whether the S1P-induced migration was due to chemotaxis or chemokinesis. The cells were allowed to migrate for 4–8 h towards S1P plus charcoal-stripped FCS, or for 20 h towards S1P alone, after which time the unmigrated cells from the top side of the membrane were wiped off with a cotton swab. The migrated cells were fixed in 2% (w/v) paraformaldehyde in PBS for 10 min and stained with 0.1% Crystal Violet in 20% (v/v) methanol for 5 min. The membranes were rinsed and allowed to dry. The cells were counted at 40× magnification in eight microscopic fields in a straight line bisecting the membrane.
Akt phosphorylation assay
ML-1 cells (10000 cells/well) were plated on 96-well plates and grown for 24 h, after which time the cells were grown in serum-free medium. The following day the cells were stimulated with S1P for 10 min. In some experiments, the cells were treated with Ptx (100 ng/ml, overnight) or wortmannin (100 ng/ml for 1 h) before and during stimulation. The cells were fixed with 4% (w/v) paraformaldehyde in PBS for 20 min. The FACE™ Akt ELISA was performed using antibodies that recognized Ser473-phosphorylated or total Akt, according to the instructions provided by the manufacturer, and the absorbance was read at 450 nm.
Western blotting
ML-1 cells were cultured in serum-free medium for 1 day and stimulated with 100 nM S1P for 10, 30 or 60 min. In some experiments, the cells were stimulated with 1 μM SEW-2871 for 10 min. At the end of the stimulation, the cells were briefly rinsed with ice-cold HBSS and collected in 200 μl ice-cold lysis buffer (10 mM Tris-base, 150 mM NaCl, 7 mM; EDTA, 0.5% Nonidet P-40 and 0.2 mM PMSF, pH 7.7) with a cell scraper. Protein concentration was determined using the BCA protein assay, following the manufacturer's instructions. The cell extracts were mixed with 0.5 vol of 3×SDS-buffer [30% (v/v) glycerol, 3% (w/v) SDS, 187.5 mM Tris/HCl, pH 6.8, 0.015% Bromophenol Blue and 3% (v/v) 2-mercaptoethanol] and boiled for 2 min. Protein samples (10–50 μg) and 15 μl of commercial control extracts were separated by SDS/PAGE (10% gels). The proteins were transferred electrophoretically to nitrocellulose membranes. The membranes were blocked with 5% (w/v) non-fat dry milk in Tris-buffered saline (TBS; 150 mM NaCl and 20 mM Tris-base, pH 7.5) with 0.1% Tween 20 for 1 h. The blots were then incubated overnight with an anti-(phospho-Thr308-Akt) specific antibody diluted 1:1000 in TBS containing 5% (w/v) non-fat dry milk and 0.1% Tween 20 at 4 °C. The following day, the membranes were washed and then incubated with horseradish-peroxide-conjugated rabbit antibodies (diluted 1:3000) for 1 h at room temperature (22 °C). The proteins were incubated in ECL® solution (1.25 mM luminol, 0.68 mM p-coumaric acid and 0.01% H2O2) for 1 min and the membranes were exposed to Hyperfilm™ (Amersham Biosciences) for 1–5 min. The membranes were stripped with 0.1 M glycine (pH 2.5), rinsed with 1M Tris/HCl (pH 7.6) and reprobed with total-Akt antibody (1:1000) as described above.
RESULTS
S1P receptor expression in human thyroid cancer cell lines and primary cultures
To find out which S1P receptors are expressed in thyroid cancer cell lines and thyroid primary cultures, we performed relative quantification of mRNA for each receptor by RT-PCR. All cell types studied expressed several S1P receptors (Figure 1). The results are presented relative to total RNA [28], with the detection limit for each gene defined as one. For comparison, data was also normalized to the expression of the reference gene PBGD, which gave similar results (results not shown). S1P2 and S1P5 mRNA were expressed in all cells and S1P2 was the dominant receptor in FRO, ARO and WRO cells (Figure 1A). FRO cells clearly expressed S1P2 at higher levels than the other cell lines. Primary cultures and ML-1 cells expressed large amounts of S1P3 compared with the other cell lines (Figure 1A). In addition, ML-1 cells showed a comparatively high expression of S1P1 and S1P5. Thus, the expression pattern in ML-1 cells was strikingly different compared with the other cell lines. S1P4 expression was absent or minimal in all cell types (Figure 1B). On the basis of these results, and of preliminary calcium measurements, proliferation and migration experiments, we chose the ML-1 and FRO cell lines for further studies.
Figure 1. S1P receptor expression in thyroid cancer cell lines and primary cultures.

(A) Relative S1P receptor mRNA expression data presented as multiples of one, with one being the detection limit of the assay. ND, not detected. Results are means±S.E.M., n=4. (B) The expression of S1P receptor mRNA visualized as PCR products separated on an agarose gel and stained with ethidium bromide. m, molecular marker; +, positive control cDNA (human brain for S1P1, S1P2 and S1P5; human heart for S1P3; and HeLa cells for S1P4).
Effects of S1P on intracellular calcium concentration
Extracellular S1P evokes release of intracellular calcium and a subsequent calcium inflow in many cell types [35]. We show that high concentrations of S1P evoked a small increase in [Ca2+]i in primary thyrocytes (EC50=654 nM; Figure 2A). ML-1 cells responded in a similar manner (EC50=986 nM; Figure 2B), whereas FRO cells were one order of magnitude more sensitive to S1P stimulation (EC50=51 nM; Figure 2C). Moreover, the maximal increase in [Ca2+]i was substantially larger in FRO cells compared with ML-1 cells and primary cultures. The calcium response in ML-1 cells was not sensitive to Ptx treatment (results not shown), but 100 nM S1P stimulated inositol phosphate production (158±23% of control levels; P<0.01). The S1P1-agonist SEW-2871 did not evoke a calcium response in ML-1 cells. Furthermore, preincubation of the cells with the S1P1/3-specific antagonist VPC 23019 showed no effect on the S1P-evoked calcium response (results not shown).
Figure 2. S1P evokes intracellular calcium signals in thyroid cells.

Calcium concentration response curves and representative traces of changes in [Ca2+]i upon stimulation with 3 μM S1P in (A) primary cultures; (B) ML-1 cells; and (C) FRO cells. Note the different scales on the y-axis. Results are means±S.E.M. In (A) the data is from at least 18 cells, and in (B) and (C) n=3–8.
Effects of S1P on proliferation
Since S1P regulates the proliferation of many cell types, including cancer cells and rat thyroid cells, we investigated whether S1P has an effect on the proliferation of normal or malignant thyroid cells. S1P had no effect on [3H]thymidine incorporation in thyroid primary cultures either in the presence of insulin or TSH, or in the untreated cells (Figure 3A). However, the primary thyrocytes proliferated in response to FCS, which was used as a control (Figure 3A).
Figure 3. The effect of S1P on thyroid cell proliferation.

(A) S1P does not affect [3H]thymidine incorporation (cpm) in thyroid primary cultures. The experiments were repeated without (left-hand panel) and in the presence (right-hand panel) of 0.3 units/l TSH and 1 mg/l insulin (ins). Without the addition of hormones, 10% (v/v) FCS was used as a positive control (C). The data represents one batch of thyroid primary cells (means±S.E.M., n=4) after a 48 h stimulation with vehicle, S1P or FCS. Similar results were obtained with two other cell batches. (B) S1P reduces ML-1 and FRO cell number, as shown by [3H]thymidine incorporation in ML-1 cells (left-hand panel, black bars), the CellTiter metabolic assay in FRO cells (right-hand panel, white bars) and cell counting for both cell lines (hatched bars). Cell counting was performed after a 48 h stimulation, the other two assays after 24 h of stimulation with S1P. *P<0.05; **P<0.01; n=3 (one-way ANOVA and Dunnett's post hoc test).
S1P inhibited [3H]thymidine incorporation in ML-1 cells (Figure 3B). The inhibitory effect on proliferation was verified by cell counting (Figure 3B). When FRO cells were stimulated with S1P, they reverted to a rounded morphology and were lost during the washing steps of the thymidine-incorporation experiment. Therefore the effect of S1P on FRO-cell proliferation was assessed with the CellTiter assay and cell counting, revealing a modest decrease in FRO viability (Figure 3B).
Effects of S1P on adhesion and migration
S1P may either stimulate or inhibit cellular adhesion and motility, depending on cell type and S1P concentration. We therefore tested the effect of S1P on the adhesion of thyroid cells. A 24 h preincubation with 100 nM or 3 μM S1P did not significantly affect cellular adhesion to fibronectin or collagen IV in ML-1 or FRO cells (Figure 4A). The adhesion properties of ML-1 cells were tested further in experiments using a short S1P incubation (1 h) and in some cases a collagen I matrix. No significant effects of S1P on ML-1 cell adhesion were found in these experiments (results not shown). By contrast, 3 μM S1P inhibited FRO cell adhesion to collagen I (Figure 4B).
Figure 4. S1P modulates the adhesion of FRO cells, but not ML-1 cells.

(A) The adhesion of ML-1 (white bars) and FRO (black bars) cells to collagen IV after a 24 h pre-incubation with vehicle control (C) or the indicated concentrations of S1P. (B) The adhesion of FRO cells to collagen I after a 1 h (hatched bars) or 24 h (black bars) pre-incubation with vehicle control (C) or S1P. Results are means±S.E.M., n=3–6. *P<0.05; **P<0.01 (one-way ANOVA and Dunnett's post hoc test).
We next tested if S1P affects the migration of thyroid cells. The migration experiments were performed across a collagen IV-coated Transwell-membrane, except for FRO cells, which failed to migrate on Matrigel, collagen IV or fibronectin matrices. Therefore, collagen I was used as a matrix in experiments with FRO cells. Without a chemoattractant, the cells showed no or a very modest basal migration. S1P did not effect basal or seruminduced migration of primary cultures (results not shown). By contrast, S1P inhibited the migration of the cell lines that expressed S1P2 predominantly (ARO, WRO and FRO; Figure 5). The effect was strongest in FRO cells, where as little as 10 nM S1P completely blocked migration towards FCS (Figure 5B).
Figure 5. S1P inhibits migration of thyroid cancer cells.

(A) Migration of WRO (white bars) and ARO (black bars) cells towards 10% (v/v) FCS in the presence of vehicle or 100 nM S1P. (B) Migration of FRO cells towards 10% (v/v) FCS and the indicated concentrations of S1P. C, vehicle control. Results are means±S.E.M., n=3–4. *P<0.05; **P<0.01 (one-way ANOVA and Dunnett's post hoc test).
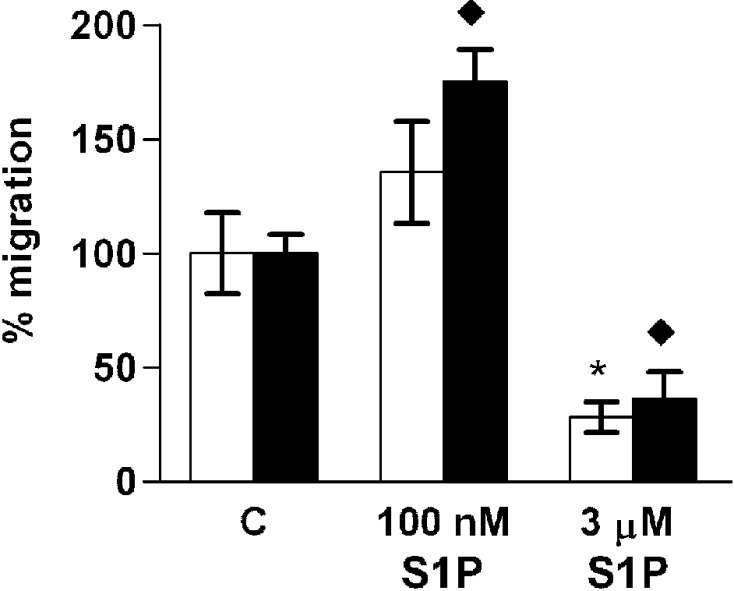
By contrast to the other cell lines, nanomolar concentrations of S1P stimulated ML-1 cell migration (Figure 6). The concentration–response curve was bell shaped and maximal migration was achieved with 100 nM S1P (Figures 6A and 6B). The migratory effects of 100 nM S1P and 10% (v/v) FCS were additive (Figures 6A and 6C). By contrast, 3 μM S1P inhibited migration towards FCS (Figures 6A and 6C). This could not be explained by the S1P-mediated inhibition of proliferation, since incubation times longer than 8 h were needed to reveal the effect of S1P on cell number (results not shown).
Figure 6. S1P regulates ML-1 cell migration.

(A) ML-1 cells allowed to migrate untreated for 20 h (a–d), or for 8 h in the presence of 10% (v/v) FCS (e–h), and stained with Crystal Violet. (a,e) control; (b,f) 100 nM S1P; (c,g) 3 μM S1P; (d,h) 100 nM S1P plus overnight pre-treatment with 100 ng/ml Ptx. Scale bar=100 μm. (B) ML-1 cell migration towards different concentrations of S1P. (C) The effect of S1P on the migration of ML-1 cells towards 10% (v/v) FCS without (white bars) or with (black bars) Ptx pre-treatment. * indicates a statistically significant effect compared with control cells and ◆ compared with Ptx-treated controls. Results are means±S.E.M., n=3–4. */◆P<0.05; **P<0.01; ***/◆◆◆P<0.001 (one-way ANOVA and Holm's post hoc test).
S1P-induced ML-1 cell migration is mediated by S1P1/3 and Gi-PI3K
Previous studies have shown that migration evoked through S1P1 and S1P3 is mediated by Gi proteins [12]. Therefore we tested the effect of overnight Ptx pre-treatment on S1P-induced migration. In Ptx-treated cells, the S1P-induced migration was totally abolished (no migrated cells compared with 171±24 cells in the S1P control; Figure 6A). Furthermore, Ptx reversed the effect of 100 nM S1P, revealing a strong inhibition on FCS-induced migration (Figures 6A and 6C). Ptx had no effect on the inhibition of migration by 3 μM S1P (Figure 6C).
To investigate which of the S1P receptors are involved in S1P-induced ML-1 migration, we used the S1P1 agonist SEW-2871 [36,37] and the S1P1/3-antagonist VPC 23019 [38]. SEW-2871 did not induce migration, whereas a 1 h pre-treatment with VPC 23019 potently inhibited S1P-induced migration (Figure 7A). In the presence of FCS, the S1P-induced migration was reduced but not abolished in VPC 23019-treated cells (Figure 7B). On the other hand, 3 μM S1P had no inhibitory effect on migration in VPC 23019-treated cells (Figure 7B). Thus, our results suggest that the effects of S1P on ML-1 cell migration are mediated by S1P1 and/or S1P3, but that activation of S1P1 alone is not sufficient to induce migration.
Figure 7. S1P-evoked ML-1 cell migration is inhibited by the S1P1/3 antagonist VPC 23019 and the PI3K-inhibitor wortmannin.

(A) Migration towards the indicated concentrations of S1P in control cells (white bars) or cells pre-treated with 1 μM VPC 23019 for 1 h (hatched bars). The S1P1-specific agonist SEW-2871 (1 μM; black bar) does not induce migration. n=3. (B) Migration towards S1P in control cells (white bars) or cells pre-treated with VPC 23019 (hatched bars) in the presence of 10% (v/v) FCS. ◆ indicates statistically significant difference compared with VPC 23019-treated control cells. Results are means±S.E.M., n=3. (C) Migration towards S1P in control cells (white bars) or cells pre-treated with 100 ng/ml wortmannin for 1 h (black bars). Results are means±S.E.M., n=4. (D) Migration towards S1P in control cells (white bars) or cells pre-treated with wortmannin (black bars) in the presence of 10% (v/v) FCS. * indicates statistical significance as indicated by parentheses. ◆ indicates statistically significant difference compared with wortmannin-treated control cells. Results are means±S.E.M., n=4. */◆P<0.05; **P<0.01; ***/◆◆◆P<0.001 (one-way ANOVA and Holm's post hoc test).
Signalling through PI3K-Akt has been shown to mediate S1P-induced migration [4,12]. In addition, S1P-evoked Akt activation is p38MAPK (mitogen-activated protein kinase)-dependent in some model systems [39]. Treatment of ML-1 cells with the potent PI3K-inhibitor Wortmannin for 1 h, inhibited S1P-induced migration, but did not affect S1P-induced inhibition of migration (Figures 7C and 7D). However, inhibiting p38MAPK with SB203580 for 1 h did not change the effects of S1P on migration (results not shown).
Next, we studied the S1P-induced phosphorylation of Akt in ML-1 cells using phosphorylation site-specific antibodies. Phosphorylation of Akt-Ser473 increased with 100 nM S1P but not 3 μM S1P (Figure 8). Consistently with its effects on migration, the S1P1/3 antagonist VPC 23019 inhibited S1P-induced Akt phosphorylation (Figure 8A). However, although SEW-2871 failed to stimulate ML-1 cell migration, it induced Akt-Ser473 phosphorylation more potently than S1P itself (Figure 8A). By contrast, we were not able to detect any phosphorylation of Akt-Thr308 with S1P or SEW-2871, or in cells cultured in the presence of 10% (v/v) FCS (results not shown).
Figure 8. S1P induces Akt phosphorylation on Ser473 in ML-1 cells.

(A) Akt-Ser473 phosphorylation in control cells (white bars) or cells pre-treated with 1 μM VPC 23019 for 1 h (black bars) after stimulation with S1P or SEW-2871 (1 μM; hatched bar). (B) Akt phosphorylation in control cells (C) or cells preincubated with wortmannin (100 ng/ml, 1 h) or Ptx (100 ng/ml, 1 h) stimulated with vehicle (white bars) or 100 nM S1P (black bars). * indicates statistically significant differences compared with vehicle control and ◆ compared with untreated cells stimulated with 100 nM S1P. Results are means±S.E.M., n=3. *P<0.05; **P<0.01; ***/◆◆◆P<0.001 (one-way ANOVA and Holm's post hoc test).
S1P was unable to increase phosphorylation of Akt-Ser473 in Ptx or wortmannin pre-treated ML-1 cells (Figure 8B). These two inhibitors also reduced the basal phosphorylation of Akt-Ser473. Thus, our results strongly suggest that, in ML-1 cells, the Gi-PI3K pathway mediates both S1P-induced migration and S1P-induced Akt phosphorylation, but that phosphorylation on Akt-Ser473 alone is not sufficient for the migratory response.
Role of the Rho–ROCK (Rho-associated kinase) pathway in S1P-induced migration of ML-1 cells
Previous investigations have indicated that the S1P2 receptor suppresses S1P-induced migration by signalling through Rho and ROCK [19]. To investigate whether Rho and ROCK are involved in S1P-induced migration in ML-1 cells, the cells were treated with the Rho inhibitor C3 exotoxin for 4 h, or the ROCKI/II inhibitor Y-27632 for 1 h. Both inhibition of ROCKI/II and Rho increased S1P-induced migration in the absence of serum, although the effect of C3 exotoxin was modest compared with that of Y-27632 (Figures 9A and 9B). Moreover, in Y-27632-treated cells, 3 μM S1P had a modest migratory effect (Figure 9B). Likewise, C3 exotoxin increased S1P-induced migration towards FCS (Figure 9C). By contrast, Y-27632 did not abrogate the inhibitory effect of 3 μM S1P on FCS-induced migration (Figure 9D). Migration towards FCS was significantly increased in Y-27632-treated cells and could not be further enhanced by S1P (Figure 9D). The results suggest that S1P and FCS regulate ML-1 cell migration by activating stimulatory and suppressor pathways simultaneously, and that the suppression of migration involves Rho and ROCK signalling. However, high concentrations of S1P may suppress migration by activating some other pathway.
Figure 9. S1P-evoked ML-1 cell migration is regulated by Rho and ROCK.

Experiments were performed in the absence (A and B) and presence (C and D) of 10% (v/v) FCS. (A and C) Cell migration in control cells (white bars) or cells preincubated with C3 exotoxin (100 ng/ml, 4 h, hatched bars). (B and D) Cell migration in control cells (white bars) or cells preincubated with Y-27632 (10 μM, 1 h; black bars). * indicates statistically significant differences as indicated by parentheses. ◆ indicates statistically significant differences compared with control cells treated with Y-27632 or C3 exotoxin. Results are means±S.E.M., n=3. *P<0.05; **P<0.01; ***/◆◆◆P<0.001 (one-way ANOVA and Holm's post hoc test).
Stimulatory effect of S1P on ML-1 cells is due to both chemotaxis and chemokinesis
To test whether S1P-induced ML-1 cell migration is chemotactic or chemokinetic, experiments where 100 nM S1P was added to both the upper and the lower well of the migration chamber (chemokinesis) were compared with experiments where S1P was present only in the lower well (chemotaxis). S1P stimulated migration in both experimental settings, but migration was less prominent in the absence of a concentration gradient (49±7 cells compared with 89±17 cells in the presence of a S1P concentration gradient, n=3). When the experiment was repeated in the presence of 10% (v/v) FCS in the lower well, 100 nM S1P was not able to significantly stimulate migration when added to both compartments of the Transwell chamber (Figure 10). On the other hand, the inhibition of FCS-induced migration by 3 μM S1P was similar in both experimental settings. These data indicate that S1P has both chemotactic and chemokinetic stimulatory effects on ML-1 cell migration, but that the inhibition of migration is independent of a concentration gradient.
Figure 10. S1P has both chemotactic and chemokinetic effects on ML-1 cell migration.
ML-1 cell migration induced by 10% (v/v) FCS and S1P in the absence (white bars) or presence (black bars) of an S1P concentration gradient. * indicates statistically significant differences compared with control cells in the absence of an S1P concentration gradient and ◆ in the presence of an S1P concentration gradient. Results are means±SEM, n=3. */◆P<0.05 (one-way ANOVA and Dunnett's post hoc test).
DISCUSSION
In the present report, we have addressed the role of S1P in thyroid cell proliferation, adhesion, migration and calcium signalling. We show that human thyroid cells, as well as human thyroid cancer cell lines, express several S1P receptors at the mRNA level. In primary cultures of human thyroid cells, S1P evokes intracellular calcium signalling but neither stimulates proliferation nor affects motility. This is an important finding, indicating that under normal physiological conditions, S1P is not a major factor regulating growth and migration of thyroid cells. However, our results imply that S1P may be of importance in thyroid cancer biology. We show that S1P can regulate the proliferation and adhesion of some types of thyroid cancer cells. Most importantly, S1P potently modulates the migration of thyroid cancer cells.
S1P receptor activation regulates proliferation in many cell types [1]. Since S1P stimulates DNA synthesis in FRTL-5 rat thyroid cells [22], but inhibits DNA synthesis in PC Cl3 rat thyroid cells [25], it was of interest to test the effect of S1P on human thyroid cell proliferation. However, our results show that S1P does not induce proliferation of human thyroid cells in primary culture. By contrast, S1P reduces cell number in some thyroid cancer cell lines, but we did not detect apoptosis (S. Balthasar and K. Törnquist, unpublished work). Furthermore, S1P modulates cellular adhesion to extracellular matrix proteins in some cell types [34,40]. We did not observe any significant effects of S1P on the adhesion to fibronectin, collagen I or collagen IV in ML-1 cells. By contrast, the adhesion to collagen I was attenuated in FRO cells preincubated with S1P.
There are many implications of S1P-receptor-mediated regulation of tumour cell invasiveness. S1P affects the migration of many tumour cell lines [10,15,16,40,41]. It is well established that S1P1 and S1P3 mediate stimulation of migration by coupling to Gi, whereas S1P2 mediates inhibition of migration via G12/13 [4,12]. The S1P receptor expression pattern, and consequently the migratory response to S1P, may change upon cellular transformation [15]. Furthermore, overexpression of S1P1 enhances in vivo metastasis of B16F10 mouse melanoma cells, whereas overexpression of S1P2 inhibits it [16]. In our hands, S1P did not affect the migration of normal human thyroid cells, although the cells express mRNA species for several S1P receptors. However, at physiological concentrations S1P may either inhibit or activate migration of thyroid tumour cell lines. In three out of the five cell lines studied (WRO, FRO and ARO cells), the dominant S1P receptor expressed was S1P2. In line with this, nanomolar concentrations of S1P attenuated migration in all of these cell lines. The FRO cells were the most sensitive to S1P, and as little as 10 nM S1P completely inhibited serum-induced migration. Consistently, the FRO cells expressed the S1P2 receptor abundantly, compared with the other cell lines.
The migratory response of ML-1 cells was strikingly different from the other cell lines: low nanomolar concentrations of S1P stimulated ML-1 cell migration, whereas it was inhibited by micromolar concentrations. The ML-1 cell line was originally derived from a follicular thyroid carcinoma that was locally invasive and had metastasized to the lymph nodes [26]. Given that the active concentration of S1P in human plasma is in the low nanomolar range [6], this suggests that S1P may have contributed to the aggressive and metastasizing behaviour of the original tumour. ML-1 cells strongly expressed S1P receptors known to stimulate migration (S1P1 and S1P3), as well as the inhibitory receptor S1P2.
According to previous investigations, S1P-evoked migration is mediated by Gi-dependent activation of PI3K and Akt kinase, resulting in the activation of Rac [4,12]. This also seems to be the case in ML-1 cells, on the basis of the following observations: inhibition of Gi with Ptx completely abolished S1P-induced migration; and inhibition of PI3K with wortmannin attenuated the migratory effect of S1P. Furthermore, S1P phosphorylated Akt kinase on Ser473 through a Ptx- and wortmannin-sensitive mechanism. Akt activity is regulated by phosphorylation on Ser473 and Thr308, but the mechanisms of these phosphorylation events are poorly understood and controversial [42]. In ML-1 cells, Thr308 phosphorylation does not appear to be required for migration, since neither FCS nor S1P were able to induce it. The mechanism by which S1P phosphorylates Akt-Ser473 in ML-1 cells remains to be investigated. Akt activation by S1P is p38MAPK-dependent in many cell lines, including ovarian cancer cells [39], and p38MAPK activity is involved in S1P-induced migration of endothelial and smooth muscle cells [43–45]. However, inhibition of p38MAPK with SB 203580 did not affect S1P-induced ML-1 cell migration. This is similar to the situation in S1P1- or S1P3-transfected CHO cells where PI3K, but not p38MAPK activity, is needed for S1P-induced migration [46].
We used the S1P1-specific agonist SEW-2871 to mimic signalling through S1P1. SEW-2871 has been reported to induce migration in S1P1-transfected CHO cells [36]. However SEW-2871 did not stimulate migration of ML-1 cells, although it potently phosphorylated Akt. Antagonizing S1P1 and S1P3 with VPC 23019 inhibited S1P-induced migration substantially. These results suggest that S1P1 and/or S1P3 are involved in S1P-induced migration in ML-1 cells, but that S1P1 alone is unable to induce migration. However the S1P-evoked inhibition of migration towards FCS was abolished by VPC 23019, suggesting that S1P3 may mediate different effects on migration at different agonist concentrations. This might be possible by switching G protein coupling from Gi to G12/13 [47]. Indeed, inhibiting Gi with Ptx reversed the effect of 100 nM S1P, resulting in a strong inhibition of ML-1 cell migration. The same effect of Ptx-treatment has been reported in S1P3-transfected CHO cells [47]. Whether the inhibitory effect on migration is mediated by S1P3, S1P2 or both receptors in ML-1 cells remains to be tested.
S1P-receptors mediate inhibition of migration by G12/13-evoked stimulation of Rho and inactivation of Rac [12,16,19,46–48]. However, Rho activity is also important for carcinoma cell motility in general [49], as well as S1P-induced endothelial and smooth muscle cell migration [44,50]. The downstream effects of Rho are partly mediated by ROCKI/II, whose effect on S1P-modulated migration is controversial. Inhibition of ROCK abolishes S1P-induced inhibition of migration in glioblastoma cells [19], but has no effect in S1P2-transfected CHO cells or B16 melanoma cells [47,48]. On the other hand, inhibiting ROCK blocks S1P-induced migration in endothelial cells [44]. In ML-1 cells, inhibition of Rho or the Rho kinases ROCKI/II further enhanced the stimulatory effect of 100 nM S1P. This suggests that S1P activates Rho–ROCK-dependent inhibitory signalling pathways simultaneously with the stimulatory Gi-PI3K pathway and that the balance between these signals determines the final migratory response. The ROCKI/II inhibitor Y-27632 clearly had a stronger effect on S1P-induced migration than the Rho inhibitor C3 exotoxin. In the presence of C3 exotoxin, the ML-1 cells had a rounded morphology, indicating that the cells responded to C3 exotoxin. It is, however, possible that the inhibition of Rho was incomplete.
Inhibition of ROCK increased the migration towards serum alone and S1P could not enhance the migratory response further. A possible explanation for this could be that, in the presence of the ROCK inhibitor and serum, maximal migration had already been achieved and a further migration in response to S1P was not possible. Surprisingly, inhibition of ROCKI/II did not reverse the inhibitory effect of 3 μM S1P on ML-1 cell migration. This implies that the inhibition of migration by high concentrations of S1P is mediated via a ROCK-independent mechanism.
S1P-induced activation of Rac requires calcium mobilization in endothelial cells [51] and calcium is involved in the regulation of motility [52]. All known S1P receptors can mediate increases in [Ca2+]i [3]. Furthermore, overexpression of S1P1 mediates inhibition of calcium signals evoked by S1P or other substances [35]. In thyroid cells in primary culture and in ML-1 cells, the S1P-evoked increase in [Ca2+]i was similar in sensitivity and magnitude to that observed in rat thyroid cell lines [22,25]. FRO cells were much more sensitive, both regarding the concentration of the ligand and the amplitude of the response. Similar to what has been observed in rat thyroid cells [24,25], S1P stimulated inositol phosphate production in both ML-1 cells and FRO cells [53], indicating that the PLC-IP3 pathway is involved. Neither Ptx nor VPC 23019 affected S1P-evoked calcium signalling in ML-1 cells. Moreover, SEW-2871 failed to evoke an increase in [Ca2+]i, although it has been shown to evoke calcium responses in S1P1-transfected CHO cells [36]. These results, together with the high expression of S1P2 in FRO cells, suggest that S1P2 receptor expression is central in regulating calcium signalling in thyroid cancer cells. Whether or not the S1P-evoked calcium signalling is involved in the regulation of ML-1 or FRO cell migration remains to be investigated.
Tumour growth and metastasis is dependent on adhesion, migration, invasion, angiogenesis and proliferation. S1P has been shown, in several investigations, to affect all of these steps and is therefore a candidate molecule for regulating metastatic behaviour. Our investigation is the first to show that S1P may be of importance in the metastatic behaviour of aggressive thyroid tumours. As the five receptors mediating S1P responses have partly different signalling mechanisms, the receptor combination and level of expression is important for the effect of S1P. Our results indicate that S1P receptors, which mediate migratory responses, may be up-regulated in some thyroid tumours and that S1P is important for the aggressive phenotype of these tumours. The co-expression of several S1P receptors differentially regulating migration in a tumour opens possibilities for therapeutic intervention.
Acknowledgments
This work was supported by the K Albin Johansson foundation, Svenska Kulturfonden, the Magnus Ehrnrooth foundation, Stiftelsens för Åbo Akademi forskningsinstitut, the Liv och Hälsa Foundation and the Centre of Excellence in Cell Stress (Åbo Akademi University).
References
- 1.Radeff-Huang J., Seasholtz T. M., Matteo R. G., Brown J. H. G protein mediated signaling pathways in lysophospholipid induced cell proliferation and survival. J. Cell. Biochem. 2004;92:949–966. doi: 10.1002/jcb.20094. [DOI] [PubMed] [Google Scholar]
- 2.Chalfant C. E., Spiegel S. Sphingosine 1-phosphate and ceramide 1-phosphate: expanding roles in cell signaling. J. Cell Sci. 2005;118:4605–4612. doi: 10.1242/jcs.02637. [DOI] [PubMed] [Google Scholar]
- 3.Ishii I., Fukushima N., Ye X., Chun J. Lysophospholipid receptors: signaling and biology. Annu. Rev. Biochem. 2004;73:321–354. doi: 10.1146/annurev.biochem.73.011303.073731. [DOI] [PubMed] [Google Scholar]
- 4.Takuwa Y. Subtype-specific differential regulation of Rho family G proteins and cell migration by the Edg family sphingosine-1-phosphate receptors. Biochim. Biophys. Acta. 2002;1582:112–120. doi: 10.1016/s1388-1981(02)00145-2. [DOI] [PubMed] [Google Scholar]
- 5.Yatomi Y., Igarashi Y., Yang L., Hisano N., Qi R., Asazuma N., Satoh K., Ozaki Y., Kume S. Sphingosine 1-phosphate, a bioactive sphingolipid abundantly stored in platelets, is a normal constituent of human plasma and serum. J. Biochem. (Tokyo) 1997;121:969–973. doi: 10.1093/oxfordjournals.jbchem.a021681. [DOI] [PubMed] [Google Scholar]
- 6.Murata N., Sato K., Kon J., Tomura H., Yanagita M., Kuwabara A., Ui M., Okajima F. Interaction of sphingosine 1-phosphate with plasma components, including lipoproteins, regulates the lipid receptor-mediated actions. Biochem. J. 2000;352:809–815. [PMC free article] [PubMed] [Google Scholar]
- 7.Yatomi Y., Ozaki Y., Ohmori T., Igarashi Y. Sphingosine 1-phosphate: synthesis and release. Prostag. Oth. Lipid M. 2001;64:107–122. doi: 10.1016/s0090-6980(01)00103-4. [DOI] [PubMed] [Google Scholar]
- 8.Aoki S., Yatomi Y., Ohta M., Osada M., Kazama F., Satoh K., Nakahara K., Ozaki Y. Sphingosine 1-phosphate-related metabolism in the blood vessel. J. Biochem. (Tokyo) 2005;138:47–55. doi: 10.1093/jb/mvi100. [DOI] [PubMed] [Google Scholar]
- 9.Edsall L. C., Cuvillier O., Twitty S., Spiegel S., Milstien S. Sphingosine kinase expression regulates apoptosis and caspase activation in PC12 cells. J. Neurochem. 2001;76:1573–1584. doi: 10.1046/j.1471-4159.2001.00164.x. [DOI] [PubMed] [Google Scholar]
- 10.Yamamura S., Yatomi Y., Ruan F., Sweeney E. A., Hakomori S.-I., Igarashi Y. Sphingosine 1-phosphate regulates melanoma cell motility through a receptor-coupled extracellular action and in a pertussis toxin-insensitive manner. Biochemistry. 1997;36:10751–10759. doi: 10.1021/bi970926s. [DOI] [PubMed] [Google Scholar]
- 11.Chun J., Goetzl E. J., Hla T., Igarashi Y., Lynch K. R., Moolenaar W., Pyne S., Tigyi G. International Union of Pharmacology. XXXIV. Lysophospholipid receptor nomenclature. Pharmacol. Rev. 2002;54:265–269. doi: 10.1124/pr.54.2.265. [DOI] [PubMed] [Google Scholar]
- 12.Taha T. A., Argraves K. M., Obeid L. M. Sphingosine-1-phosphate receptors: receptor specificity versus functional redundancy. Biochim. Biophys. Acta. 2004;1682:48–55. doi: 10.1016/j.bbalip.2004.01.006. [DOI] [PubMed] [Google Scholar]
- 13.Anliker B., Chun J. Cell surface receptors in lysophospholipid signaling. Sem. Cell Dev. Biol. 2004;15:457–465. doi: 10.1016/j.semcdb.2004.05.005. [DOI] [PubMed] [Google Scholar]
- 14.Spiegel S., Milstien S. Exogenous and intracellularly generated sphingosine 1-phosphate can regulate cellular processes by divergent pathways. Biochem. Soc. Trans. 2003;31:1216–1219. doi: 10.1042/bst0311216. [DOI] [PubMed] [Google Scholar]
- 15.Malchinkhuu E., Sato K., Horiuchi Y., Mogi C., Ohwada S., Ishiuchi S., Saito N., Kurose H., Tomura H, Okajima F. Role of p38 mitogen-activated kinase and c-Jun terminal kinase in migration response to lysophosphatidic acid and sphingosine-1-phosphate in glioma cells. Oncogene. 2005;24:6676–6688. doi: 10.1038/sj.onc.1208805. [DOI] [PubMed] [Google Scholar]
- 16.Yamaguchi H., Kitayama J., Takuwa N., Arikawa K., Inoki I., Takehara K., Nagawa H., Takuwa Y. Sphingosine-1-phosphate receptor subtype-specific positive and negative regulation of Rac and haematogenous metastasis of melanoma cells. Biochem. J. 2003;374:715–722. doi: 10.1042/BJ20030381. [DOI] [PMC free article] [PubMed] [Google Scholar]
- 17.Dolezalova H., Shankar G., Huang M.-C., Bikle D. D., Gotezl E. Biochemical regulation of breast cancer cell expression of S1P2 (Edg-5) and S1P3 (Edg-3) G protein-coupled receptors for sphingosine 1-phosphate. J. Cell. Biochem. 2003;88:732–743. doi: 10.1002/jcb.10394. [DOI] [PubMed] [Google Scholar]
- 18.Czeloth N., Bernhardt G., Hofmann F., Genth H., Förster R. Sphingosine-1-phosphate mediates migration of mature dendritic cells. J. Immunol. 2005;175:2960–2967. doi: 10.4049/jimmunol.175.5.2960. [DOI] [PubMed] [Google Scholar]
- 19.Lepley D., Paik J.-H., Hla T., Ferrer F. The G protein-coupled receptor S1P2 regulates Rho/Rho kinase pathway to inhibit tumour cell migration. Cancer Res. 2005;65:3788–3795. doi: 10.1158/0008-5472.CAN-04-2311. [DOI] [PubMed] [Google Scholar]
- 20.Kohno T., Matsuyuki H., Inagaki Y., Igarashi Y. Sphingosine 1-phosphate promotes cell migration through the activation of Cdc42 in Edg-6/S1P4-expressing cells. Genes Cells. 2003;8:685–697. doi: 10.1046/j.1365-2443.2003.00667.x. [DOI] [PubMed] [Google Scholar]
- 21.Ogretmen B., Hannun Y. A. Biologically active sphingolipids in cancer pathogenesis and treatment. Nat. Rev. Cancer. 2004;4:604–616. doi: 10.1038/nrc1411. [DOI] [PubMed] [Google Scholar]
- 22.Törnquist K., Saarinen P., Vainio M., Ahlström M. Sphingosine 1-phosphate mobilizes sequestered calcium, activates calcium entry, and stimulates deoxyribonucleic acid synthesis in thyroid FRTL-5 cells. Endocrinology. 1997;138:4049–4057. doi: 10.1210/endo.138.10.5422. [DOI] [PubMed] [Google Scholar]
- 23.Törnquist K. Sphingosine 1-phosphate stimulates Na+/H+ exchange in thyroid FRTL-5 cells. Am. J. Physiol. Cell Physiol. 1997;272:C1052–C1057. doi: 10.1152/ajpcell.1997.272.3.C1052. [DOI] [PubMed] [Google Scholar]
- 24.Okajima F., Tomura H., Sho K., Kimura T., Sato K., Im D. S., Akbar M., Kondo Y. Sphingosine-1-phosphate stimulates hydrogen peroxide generation through activation of phospholipase C-Ca2+ system in FRTL-5 thyroid cells: possible involvement of guanosine triphosphate-binding proteins in the lipid signaling. Endocrinology. 1997;138:220–229. doi: 10.1210/endo.138.1.4883. [DOI] [PubMed] [Google Scholar]
- 25.Björklund S., Palmberg S., Rask S., Westerdahl A.-C., Törnquist K. Effects of sphingosine 1-phosphate on calcium signalling, proliferation and S1P2 receptor expression in PC Cl3 rat thyroid cells. Mol. Cell. Endocrinol. 2005;231:65–74. doi: 10.1016/j.mce.2004.12.001. [DOI] [PubMed] [Google Scholar]
- 26.Schönberger J., Bauer J., Spruβ T., Weber G., Chahoud I., Eilles C., Grimm D. Establishment and characterization of the follicular thyroid carcinoma cell line ML-1. J. Mol. Med. 2000;78:102–110. doi: 10.1007/s001090000085. [DOI] [PubMed] [Google Scholar]
- 27.Eggo M. C., King W. J., Black E. G., Sheppard M. C. Functional human thyroid cells and their insulin-like growth factor-binding proteins: regulation by thyrotropin, cyclic 3′,5′ adenosine monophosphate, and growth factors. J. Clin. Endocrinol. Metab. 1996;81:3056–3062. doi: 10.1210/jcem.81.8.8768874. [DOI] [PubMed] [Google Scholar]
- 28.Bustin S. A. Absolute quantification of mRNA using real-time reverse transcription polymerase chain reaction assays. J. Mol. Endocrinol. 2000;25:169–193. doi: 10.1677/jme.0.0250169. [DOI] [PubMed] [Google Scholar]
- 29.Grynkiewicz G., Poenie M., Tsien R. Y. A new generation of Ca2+ indicators with greatly improved fluorescence properties. J. Biol. Chem. 1985;260:3440–3450. [PubMed] [Google Scholar]
- 30.Xiong J., Verkhratsky A., Toescu E. C. Changes in mitochondrial status associated with altered Ca2+ homeostasis in aged cerebellar granule neurons in brain slices. J. Neurosci. 2002;22:10761–10771. doi: 10.1523/JNEUROSCI.22-24-10761.2002. [DOI] [PMC free article] [PubMed] [Google Scholar]
- 31.Oldham K. G. Polyphosphoinositide turnover. Receptor-Effector Coupling. In: Home E. C., editor. A Practical Approach. Oxford University Press; 1990. pp. 99–116. [Google Scholar]
- 32.Wang F., Nohara K., Olivera A., Thompson E. W., Spiegel S. Involvement of focal adhesion kinase in inhibition of motility of human breast cancer cells by sphingosine 1-phosphate. Exp. Cell Res. 1999;247:17–28. doi: 10.1006/excr.1998.4327. [DOI] [PubMed] [Google Scholar]
- 33.Paik J. H., Chae S.-S., Lee M.-J., Thangada S., Hla T. Sphingosine 1-phosphate-induced endothelial cell migration requires the expression of EDG-1 and EDG-3 receptors and Rho-dependent activation of αvβ3- and β1-containing integrins. J. Biol. Chem. 2001;276:11830–11837. doi: 10.1074/jbc.M009422200. [DOI] [PubMed] [Google Scholar]
- 34.Hong G., Baudhuin L. M., Xu Y. Sphingosine-1-phosphate modulates growth and adhesion of ovarian cancer cells. FEBS Lett. 1999;460:513–518. doi: 10.1016/s0014-5793(99)01400-3. [DOI] [PubMed] [Google Scholar]
- 35.Meyer zu Heringdorf D. Lysophospholipid receptor-dependent and -independent calcium signaling. J. Cell. Biochem. 2004;92:937–948. doi: 10.1002/jcb.20107. [DOI] [PubMed] [Google Scholar]
- 36.Sanna M. G., Liao J., Jo E., Alfonso C., Ahn M.-Y., Peterson M. S., Webb B., Lefebvre S., Chun J., Gray N., Rosen H. Sphingosine 1-phosphate (S1P) receptor subtypes S1P1 and S1P3, respectively, regulate lymphocyte recirculation and heart rate. J. Biol. Chem. 2004;279:13839–13848. doi: 10.1074/jbc.M311743200. [DOI] [PubMed] [Google Scholar]
- 37.Jo E., Sanna M. G., Gonzalez-Cabrera P. J., Thangada S., Tigyi G., Osborne D. A., Hla T., Parrill A. L., Rosen H. S1P1-selective in vivo-active agonists from high-throughput screening: off-the-shelf chemical probes of receptor interactions, signaling, and fate. Chem. Biol. 2005;12:703–715. doi: 10.1016/j.chembiol.2005.04.019. [DOI] [PubMed] [Google Scholar]
- 38.Davis M. D., Clemens J. J., Macdonald T. L., Lynch K. R. Sphingosine 1-phosphate analogs as receptor antagonists. J. Biol. Chem. 2005;280:9833–9841. doi: 10.1074/jbc.M412356200. [DOI] [PubMed] [Google Scholar]
- 39.Baudhuin L. M., Cristina K. L., Lu J., Xu Y. Akt activation induced by lysophosphatidic acid and sphingosine-1-phosphate requires both mitogen-activated protein kinase kinase and p38 mitogen activated protein kinase and is cell-line specific. Mol. Pharmacol. 2002;62:660–671. doi: 10.1124/mol.62.3.660. [DOI] [PubMed] [Google Scholar]
- 40.Van Brocklyn J. R., Young N., Roof R. Sphingosine-1-phosphate stimulates motility and invasiveness of human glioblastoma multiforme cells. Cancer Lett. 2003;199:53–60. doi: 10.1016/s0304-3835(03)00334-3. [DOI] [PubMed] [Google Scholar]
- 41.Sadahira Y., Ruan F., Hakomori S.-I., Igarashi Y. Sphingosine 1-phosphate, a specific endogenous signaling molecule controlling cell motility and tumor cell invasiveness. Proc. Natl. Acad. Sci. U.S.A. 1992;89:9686–9690. doi: 10.1073/pnas.89.20.9686. [DOI] [PMC free article] [PubMed] [Google Scholar]
- 42.Hresko R., Mueckler M. mTOR-RICTOR is the Ser473 kinase for Akt/protein kinase B in 3T3-L1 adipocytes. J. Biol. Chem. 2005;280:40406–40416. doi: 10.1074/jbc.M508361200. [DOI] [PubMed] [Google Scholar]
- 43.Fegley A. J., Tanski W. J., Roztocil E., Davies M. G. Sphingosine-1-phosphate stimulates smooth muscle cell migration through gαi- and PI3-kinase-dependent P38mapk activation. J. Surg. Res. 2003;113:32–41. doi: 10.1016/s0022-4804(03)00120-3. [DOI] [PubMed] [Google Scholar]
- 44.Liu F., Verin A. D., Wang P., Day R., Wersto R. P., Chrest F. J., English D. K., Garcia J. G. N. Differential regulation of sphingosine-1-phosphate- and VEGF-induced endothelial cell chemotaxis: involvement of Giα2-linked Rho kinase activity. Am. J. Respir. Cell. Mol. Biol. 2001;24:711–719. doi: 10.1165/ajrcmb.24.6.4323. [DOI] [PubMed] [Google Scholar]
- 45.Kimura T., Watanabe T., Sato K., Kon J., Tomura H., Tamama K., Kuwabara A., Kanda T., Kobayashi I., Ohta H., et al. Sphingosine 1-phosphate stimulates proliferation and migration of human endothelial cells possibly through the lipid receptors, Edg-1 and Edg-3. Biochem. J. 2000;348:71–76. [PMC free article] [PubMed] [Google Scholar]
- 46.Okamoto H., Takuwa N., Yokomizo T., Sugimoto N., Sakurada S., Shigematsu H., Takuwa Y. Inhibitory regulation of Rac activation, membrane ruffling, and cell migration by the G protein-coupled sphingosine-1-phosphate receptor EDG5 but not EDG1 or EDG3. Mol. Cell. Biol. 2000;20:9247–9261. doi: 10.1128/mcb.20.24.9247-9261.2000. [DOI] [PMC free article] [PubMed] [Google Scholar]
- 47.Sugimoto N., Takuwa N., Okamoto H., Sakurada S., Takuwa Y. Inhibitory and stimulatory regulation of Rac and cell motility by G12/13-Rho and Gi pathways integrated downstream of a single G protein-coupled sphingosine-1-phosphate receptor isoform. Mol. Cell. Biol. 2003;23:1534–1545. doi: 10.1128/MCB.23.5.1534-1545.2003. [DOI] [PMC free article] [PubMed] [Google Scholar]
- 48.Arikawa K., Takuwa N., Yamaguchi H., Sugimoto N., Kitayama J., Nagawa H., Takehara K., Takuwa Y. Ligand-dependent inhibition of B16 melanoma cell migration and invasion via endogenous S1P2 G protein-coupled receptor. J. Biol. Chem. 2003;278:32841–32851. doi: 10.1074/jbc.M305024200. [DOI] [PubMed] [Google Scholar]
- 49.Oxford G., Theodorescu D. Ras superfamily monomeric G proteins in carcinoma cell motility. Cancer Lett. 2003;189:117–128. doi: 10.1016/s0304-3835(02)00510-4. [DOI] [PubMed] [Google Scholar]
- 50.Galaria I. I., Fegley A. J., Nicholl S. N., Roztocil E., Davies M. G. Differential regulation of ERK1/2 and p38MAPK by components of the Rho signaling pathway during sphingosine-1-phosphate-induced smooth muscle cell migration. J. Surg. Res. 2004;122:173–179. doi: 10.1016/j.jss.2004.05.012. [DOI] [PubMed] [Google Scholar]
- 51.Mehta D., Konstantoulaki M., Ahmmed G. U., Malik A. B. Sphingosine 1-phosphate-induced mobilization of intracellular Ca2+ mediates Rac activation and adherens junction assembly in endothelial cells. J. Biol. Chem. 2005;280:17320–17328. doi: 10.1074/jbc.M411674200. [DOI] [PubMed] [Google Scholar]
- 52.Huang J.-B., Lindzelskii A. L., Clark A. J., Petty H. R. Identification of channels promoting calcium spikes and waves in HT1080 tumour cells: their apparent roles in cell motility and invasion. Cancer Res. 2004;64:2482–2489. doi: 10.1158/0008-5472.can-03-3501. [DOI] [PubMed] [Google Scholar]
- 53.Afrasiabi E., Blom T., Ekokoski E., Tuominen R. K., Törnquist K. Sphingosylphosphorylcholine enhances calcium entry in thyroid FRO cells by a mechanism dependent on protein kinase C. Cell. Signal. 2006 doi: 10.1016/j.cellsig.2006.01.005. in the press. [DOI] [PubMed] [Google Scholar]
- 54.Davaille J., Gallois C., Habib A., Li L., Mallat A., Tao J., Levade T., Lotersztajn S. Antiproliferative properties of sphingosine 1-phosphate in human hepatic myofibroblasts. J. Biol. Chem. 2000;275:34628–34633. doi: 10.1074/jbc.M006393200. [DOI] [PubMed] [Google Scholar]
- 55.Westerman B. A., Neijenhuis S., Poutsma A., Steenbergen R. D., Breuer R. H., Egging M., van Wijk I. J., Oudejans C. B. Quantitative reverse transcription-polymerase chain reaction measurement of HASH1 (ASCL1), a marker for small cell lung carcinomas with neuroendocrine features. Clin. Cancer Res. 2002;8:1082–1086. [PubMed] [Google Scholar]