

Abstract
A significant proportion of the variation between individuals in gene expression levels is genetic, and it is likely that these differences correlate with phenotypic differences or with risk of disease. Cis-acting polymorphisms are important in determining interindividual differences in gene expression that lead to allelic expression imbalance, which is the unequal expression of homologous alleles in individuals heterozygous for such a polymorphism. This expression imbalance can be detected using a transcribed polymorphism, and, once it is established, the next step is to identify the polymorphisms that are responsible for or predictive of allelic expression levels. We present an expectation-maximization algorithm for such analyses, providing a formal statistical framework to test whether a candidate polymorphism is associated with allelic expression differences.
Over the past few years, there has been increasing interest in the genetic basis of interindividual differences in gene expression. Particular attention has been paid to the identification of genetic variation affecting expression in cis.1–3 In individuals heterozygous for a polymorphism affecting expression in cis, the amounts of mRNA originating from each allele are not equal. Such allelic expression imbalance (AEI) can be measured in individuals heterozygous for a transcribed polymorphism. The relative transcript levels of one allele with respect to the other are often easier to measure than absolute levels, since each allele acts as a parallel internal control for the other. The use of AEI for detecting cis-acting genetic variation is also attractive because many sources of expression variability, such as environmental influences, are likely to act in trans and to affect both alleles.
Once a gene showing differences in allelic expression has been identified, interest may turn to the causes and the potential consequences of these differences. Discovering the latter may require the identification of the causative polymorphism(s) or, at least, the polymorphisms that are predictive for allelic expression levels. This information can help to identify factors that modify disease risk or that modulate interindividual differences in the response to drugs or to other environmental challenges. Although it is to be expected that causative polymorphisms will often be located in the promoter region, we should bear in mind that elements affecting transcription in cis can be widely distributed throughout a locus and can even be located in neighboring loci, an extreme example of this being the action of Xist.4 Thus, locating cis-acting variation with the use of functional assays can be a laborious task that may be simplified if information about the location of the sequences of interest is available.
A second reason for the interest in allelic expression differences is that they can provide evidence in vivo of the relevance of polymorphisms that have been shown to be able to affect transcription in vitro. The assays used rely often on cell lines and reporter constructs, which are model systems that may not always accurately reproduce the cellular environment or the local chromatin structure found under physiological conditions.
Here, we present a procedure to test whether AEI data are consistent with a particular polymorphism influencing expression in cis. It should be noted that AEI is characterized not only by its presence or its absence but also by which of the alleles is overexpressed with respect to the other and by the extent of the differential expression. Where a polymorphism influences expression in cis, the presence and extent of AEI in an individual will depend on whether or not the individual is heterozygous for the cis-acting polymorphism and on the phase between cis-acting and transcribed polymorphisms. For example, in cases where the cis-acting polymorphism and the transcribed marker are in complete linkage disequilibrium and where no other factors modulate allelic expression, we would expect that AEI would always be observed in individuals heterozygous for the cis-acting polymorphism and that the same transcribed marker allele would always be overexpressed. Therefore, if we observe consistent overexpression of the same marker allele across different individuals, we can infer that this allele is part of a haplotype that contains a cis-acting sequence variant that causes overexpression.5
However, such an approach will be insufficient when the causative and expressed polymorphisms are not in complete disequilibrium and when AEI is influenced by other factors—for example, by additional polymorphisms. In a study reported elsewhere, we used a Markov chain–Monte Carlo procedure to ascertain allele frequencies of the cis-acting polymorphism and the extent of disequilibrium between it and the candidate polymorphism(s).6 In that analysis, AEI was recorded as a qualitative trait (i.e., if it was present or absent and, if present, which allele was overexpressed), and we assumed that it was due to a single biallelic cis-acting change.
Here, we present a procedure that regards AEI as a quantitative trait and aims to ascertain if the data are consistent with a particular polymorphism influencing expression in cis. There are two benefits to this approach. First, it enables the use of the allelic expression ratio (AER) directly, without the loss of information incurred by classifying AEI into discrete classes. Second, it allows for the transcribed polymorphism to account for some, but not necessarily all, of the allele-specific expression differences. The variance-components formulation leads to a likelihood-ratio framework for statistical analysis. The procedure is demonstrated using data published elsewhere.6
We ask if a biallelic polymorphism with alleles C and c is associated with allelic expression differences. Allelic expression is assessed at an expressed biallelic marker with alleles M and m. We designate the phase-known genotype of an individual as “G” and the phase-unknown genotype as “T” (see fig. 1). The latter is ascertained by genotyping the two markers. We assume that eH, the amount of mRNA originating from an allele carrying the haplotype H, follows a log-normal distribution, with 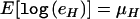 and
and 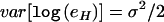 , where σ does not vary between different alleles. The model is parameterized in this way so that the AERs can be analyzed on a logarithmic scale.7 There are four possible haplotypes—MC, Mc, mC, and mc—and we designate the set of all possible genotypes that these haplotypes can form as “Γ.” The log of the ratio I between the expression levels of both alleles can, therefore, be assumed to be normally distributed, as
  , where μG is parameterized as
 |
and the hypothesis to be tested is μ=0. Figure 1 illustrates the configuration of the model, in terms of the four phase-known genotypes. As configured here, this model can be seen as equivalent to a constrained analysis of variance. The analysis is further complicated, since only three genotype groups are observed. The relative frequency of the two phase-known genotypes (i.e., MC/mc and Mc/mC) must be estimated. The figure also illustrates that the parameter μ0 allows the transcribed allele to be associated with an effect on AER, independently of the putative cis-acting polymorphism under investigation.
Figure 1. .

Representation of the assumptions made by the proposed method. All individuals are heterozygous M/m for the transcribed marker, through the experimental design. The four phase-known genotypes and the corresponding three phase-unknown genotypes are represented on the horizontal axis. The vertical diamonds represent the distribution of log AERs for each genotype. The figure illustrates that the variances of the values within each genotype group are assumed to be equal. Cis-acting differences will be seen only in those individuals heterozygous at the cis-acting locus; hence, the mean log expression ratio is assumed to be the same in both homozygote groups. The cis-acting effect is allowed as a deviation from the homozygote mean. This parameterization follows from the initial assumptions of haplotype-specific expression and of constraining the means in the two homozygote groups to be equal.
Up to a multiplicative constant, the likelihood for a set of individuals heterozygous for the transcribed marker can be described as
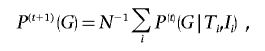
where  designates the density for an individual with the phase-unknown genotype Ti and an expression ratio Ii and where the index i runs through all individuals in the sample. L depends on μ0, μ, σ, and the genotype frequencies denoted by P(G). There are four underlying categories of genotype, but two of these cannot be distinguished at the observation level because of uncertain haplotype phase. In such situations where observations are treated as incomplete data, it is common to use the expectation-maximization (EM)8 iterative procedure to find the maximum-likelihood solution. Historically, this type of algorithm has been commonly used in genetics, designated as a “gene-counting” algorithm.
For an individual,  can be written as
 |
where 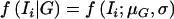 . Here,
  denotes the density of a normal distribution, with the individual expression ratio Ii as variate, a genotype-dependent mean μG, and a variance σ2; and P(Ti|G) is the probability of individual I having phase-unknown genotype Ti, conditional on phase-known genotype G (values presented in table 1). The likelihood is a function of six independent parameters.
Table 1. .
Values Taken by Function P(T/G)
| Phase-UnknownGenotype T |
|||
| Phase-Known Genotype G | Mm/cc | Mm/Cc | Mm/CC |
| Mc/mc | 1 | 0 | 0 |
| Mc/mC | 0 | 1 | 0 |
| MC/mc | 0 | 1 | 0 |
| MC/mC | 0 | 0 | 1 |
The EM procedure consists of two steps: (1) In the “E” step (i.e., expectation of the missing data), previous estimates of the genotype frequencies ( ) and of the variance and expected values (
 ,
,  , and
, and  ) are used to estimate the probabilities that each individual has a particular phase-known genotype that is conditional on his or her observed phase-unknown genotype and expression ratio.
 |
where  and
and  . (2) In the “M” step (i.e., computation of maximum-likelihood estimates, with the assumption of complete data), with
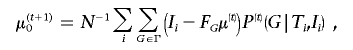
 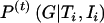 as the probability that the ith individual carries the genotype G, new estimates for the genotype frequencies, the variance, and the expected values are obtained.
 |
 |
 |
and
 |
where N is the number of individuals in the sample and FG characterizes the phase of the cis-acting effect, with respect to the expressed polymorphism:
 |
We alternate these two steps until the relative increase of log(L) is smaller than a threshold (10−10 in our calculations). A likelihood-ratio test is then used to compare the model that allows optimization for μ0, μ, and σ with the model in which μ is fixed to be zero. The algorithm is implemented as an S-plus/R script and is freely available from the AEI Web page.
We illustrate the application of this statistical method, using data recently published elsewhere,6 on matrix metalloproteinase 1 (MMP1 [MIM 120353]) expression in lung tissues, as an example. We test if rs11292517 is associated with allelic expression differences in lung tissue. This polymorphism, often designated as “−1607G/GG,” arises from the insertion/deletion of a guanine residue in the promoter of the gene and has been shown to be able to influence transcription in reporter assays.9 Allelic expression of MMP1 was assessed using a transcribed marker in the 3′ UTR of the gene (rs5854). This polymorphism affects an XbaI restriction site. The site is present in the T allele and is absent in the C allele. A cDNA fragment spanning the polymorphic site was amplified by PCR and was restricted, and the digest was analyzed by capillary electrophoresis. Each sample was analyzed once. Experimental details can be found in the original report.6
Figure 2 shows the data for lung samples from 38 individuals grouped by promoter genotype. Represented is the ratio of the intensities of the fragment corresponding to the C allele to those of the larger restriction product of the band corresponding to the T allele. For figure 2, we have recoded the allele with a single G as “1” and the allele with the insertion (GG) as “2.”
Figure 2. .

Expression ratio between the intensities of the band corresponding to the T allele and of the band corresponding to the C allele, in individuals heterozygous for rs5854. Represented are the results for 24 gDNA samples and for 38 cDNA samples. The latter are grouped according to the genotype at the promoter polymorphism (rs1129251). The right Y-axis shows the range of the observations before normalization by the gDNA mean. As can be seen from the diagram, the normalization procedure effectively shifts the axis by the log of the geometric mean of the gDNA values.
Usually, ascertaining AER requires a reference where both alleles are present in equimolar amounts for normalization. Genomic DNA (gDNA) is often used for this purpose.10 This reference should control for differences in the ability of the detection system to quantify both alleles. For example, if an intercalating dye is used to quantify the amount of DNA present in a restriction fragment, the intensity of the fluorescence will depend on the size and, perhaps, on the composition of that fragment. This situation is illustrated in figure 2. It shows the ratios for a set of 24 gDNA samples that were used as equimolar controls. The ratios are <1—that is, they show a bias towards the uncut allele (the C allele). In this example, the range of the uncorrected ratios for the gDNA was 0.35–0.69, and the mean was 0.55. Such influences must be corrected when comparing band intensities in an AER analysis. Here, normalization was performed by dividing the ratio of each of the cDNA samples by the geometric mean of the ratios from the gDNA samples.6
The limitations of the EM algorithm, with respect to converging to local maxima, are well established.8 As for any algorithm of this kind, a range of different starting values should be used. For this particular application, we found that the EM procedure was not sensitive to starting values for μ0, σ, or for the genotype frequencies. However, two equivalent solutions corresponding to the same maximum likelihood were found, with respect to the sign of the parameter μ. This situation reflects the fact that, because of the experimental design that considers only individuals heterozygous at the transcribed marker, it is not possible to identify which allele is associated with the overexpression. The existence of two equivalent solutions has no impact on the interpretation of the statistical significance of the association.
Table 2 shows the results of the likelihood analysis of the normalized values. The influence of the promoter polymorphism (in this example, rs11292517) is represented by the parameter μ (see eq. [1]). We detect a significant association between the genotype for the promoter polymorphism and allelic expression, since fixing μ at 0 results in a significantly worse fit (P=5×10⁻³). The parameter μ0 represents the influence of the genotype at the transcribed polymorphism on expression ratio. The effect of fixing μ0 at 0 is not significant (P=.65). This result suggests that the normalization used here was adequate and, perhaps of more interest, that there is no significant association between the transcribed polymorphism and AER.
Table 2. .
Analysis of MMP1 AER Data
| Model | Unrestricted | μ0=0 | μ=0 |
 |
−.19 | … | .24 |
 |
1.13 | 1.00 | … |
 |
.86 | .87 | 1.12 |
 |
−117.5 | −118.1 | −122.6 |
| Pa | … | .30 | 1.5×10⁻³ |
With respect to the unrestricted model.
In our example, there was no significant disequilibrium between transcribed and promoter polymorphisms (P>.05, according to the data in the original report6). However, disequilibrium between causative and transcribed polymorphisms seems to be quite common. In a survey using microarrays,11 preferential overexpression of the same transcribed allele was reported, across samples from different individuals, in 83% of the transcripts showing AEI. The parameterization used allows a separation of the contribution from the transcribed polymorphism, characterized by μ0, from that of the putative cis-acting polymorphism, characterized by μ. This distinction could be particularly useful in exploring the effects of additional polymorphisms, even when one of the alleles of the transcribed marker is consistently overexpressed.
It should be noted that, although this analysis confirms that the promoter polymorphism is associated with the variation in allele-specific expression levels of MMP1, it does not explain all of the observed variability. This fact can be deduced simply from the wide range of AERs for a given promoter genotype. Other factors that might modulate the additional variability could include host-cell variation in transcription-factor efficacy for a given MMP1 genotype, the differential activity of alternative promoter elements that may dilute allele-specific expression effects, interindividual differences in the degree of epigenetic modification for a given promoter genotype, or the presence of additional functional SNPs. The procedure described and applied in this report treats allelic expression as a quantitative trait and can be used to ascertain if a candidate polymorphism contributes to the regulation of expression in cis, even in cases where allelic expression is influenced by other factors.
Web Resources
The URLs for data presented herein are as follows:
- AEI Web page, http://www.dawn-teare.staff.shef.ac.uk/software.html (for R code implementing the proposed method)
- Online Mendelian Inheritance in Man (OMIM), http://www.ncbi.nlm.nih.gov/Omim (for MMP1) [PubMed]
References
- 1.Cheung VG, Spielman RS, Ewens KG, Weber TM, Morley M, Burdick JT (2005) Mapping determinants of human gene expression by regional and genome-wide association. Nature 437:1365–1369 10.1038/nature04244 [DOI] [PMC free article] [PubMed] [Google Scholar]
- 2.Knight JC, Keating BJ, Rockett KA, Kwiatkowski DP (2003) In vivo characterization of regulatory polymorphisms by allele-specific quantification of RNA polymerase loading. Nat Genet 33:469–475 10.1038/ng1124 [DOI] [PubMed] [Google Scholar]
- 3.Yan H, Yuan W, Velculescu VE, Vogelstein B, Kinzler KW (2002) Allelic variation in human gene expression. Science 297:1143–1143 10.1126/science.1072545 [DOI] [PubMed] [Google Scholar]
- 4.Brockdorff N (2002) X-chromosome inactivation: closing in on proteins that bind Xist RNA. Trends Genet 18:352–358 10.1016/S0168-9525(02)02717-8 [DOI] [PubMed] [Google Scholar]
- 5.Bray NJ, Buckland PR, Williams NM, Williams HJ, Norton N, Owen MJ, O’Donovan MC (2003) A haplotype implicated in schizophrenia susceptibility is associated with reduced COMT expression in human brain. Am J Hum Genet 73:152–161 [DOI] [PMC free article] [PubMed] [Google Scholar]
- 6.Heighway J, Bowers NL, Smith S, Betticher DC, Koref MF (2005) The use of allelic expression differences to ascertain functional polymorphisms acting in cis: analysis of MMP1 transcripts in normal lung tissue. Ann Hum Genet 69:127–133 10.1046/j.1529-8817.2004.00135.x [DOI] [PubMed] [Google Scholar]
- 7.Wit E, McClure J (2004) Statistics for microarrays. Wiley, Chichester, United Kingdom, pp 63–64 [Google Scholar]
- 8.Dempster AP, Laird NM, Rubin DB (1977) Maximum likelihood from incomplete data via the EM algorithm. J R Stat Soc B 39:1–38 [Google Scholar]
- 9.Rutter JL, Mitchell TI, Buttice G, Meyers J, Gusella JF, Ozelius LJ, Brinckerhoff CE (1998) A single nucleotide polymorphism in the matrix metalloproteinase-1 promoter creates an ETS binding site and augments transcription. Cancer Res 58:5321–5325 [PubMed] [Google Scholar]
- 10.Buckland PR (2004) Allele-specific gene expression differences in humans. Hum Mol Genet 13:R255–R260 10.1093/hmg/ddh227 [DOI] [PubMed] [Google Scholar]
- 11.Lo HS, Wang Z, Hu Y, Yang HH, Gere S, Buetow KH, Lee MP (2003) Allelic variation in gene expression is common in the human genome. Genome Res 13:1855–1862 [DOI] [PMC free article] [PubMed] [Google Scholar]