Abstract
Cognitive impairment has recently been found to correlate with changes in peripheral inflammatory signals such as TNF-α and IL-1β. PKC isozymes regulate levels of TNF-α and IL-6 and the release of other cytokines and also show deficits in Alzheimer’s disease (AD) brains and skin fibroblasts. Here, we investigate MAPK Erk1 and Erk2 phosphorylation in response to the inflammatory agonist bradykinin, which activates PKC pathways. An internally controlled comparison of Erk1 and Erk2 produced an AD index that accurately distinguished fibroblasts of AD from those of normal controls and of non-AD dementias. This accuracy was demonstrated for Coriell Cell Repository (Coriell Institute of Medical Research, Camden, NJ) samples, as well as for samples analyzed on gels with autopsy diagnostic confirmation. AD Erk1 and Erk2 index values were inversely correlated with disease duration, suggesting maximal efficacy for early diagnosis. Finally, the results also demonstrate that, when the AD index agreed with the clinical diagnosis on the presence of AD, there was a high probability of accuracy based on autopsy validation. Thus, this peripheral molecular biomarker, based on differential Erk1 and Erk2 phosphorylation, could have important clinical utility for providing increased certainty in the positive diagnosis of AD, particularly in the early phase of disease progression.
Keywords: diagnostic, MAPK, Alzheimer’s index, PKC, human fibroblasts
Recent evidence in human patients and animal models supports the hypothesis that early dysfunction in the brains of Alzheimer’s disease (AD) patients involves inflammatory signaling pathways. For example, in several studies the cognitive impairment of AD patients increased with changes in two inflammatory signals: lower plasma TNF-α levels and higher levels of IL-1β (1–7). PKC-mediated α-secretase activation is responsible for TNF-α generation. Furthermore, deficits of PKC isozymes have been found in AD brain tissues (8) and skin fibroblasts (9–11), as have deficits of PKC-mediated phosphorylation of MAPK (12). Therefore, we investigated a molecular biomarker that assays both MAPK Erk1 and Erk2 phosphorylation in response to the inflammatory signaling molecule bradykinin (BK), which activates PKC pathways.
The neurodegenerative processes responsible for AD may begin well before the disease can be detected by current clinical and/or imaging diagnostic criteria. Therefore, a biological marker to predict or confirm AD would be invaluable for initiating early therapeutic regimens (13, 14). Although definitive diagnosis of AD requires both clinically demonstrated dementia and amyloid plaques and tangles at autopsy, a molecular marker in peripheral tissue (e.g., skin, blood, and saliva) with high sensitivity and specificity, detectable soon after the onset of symptoms, could be important for enhancing the accuracy of clinical diagnosis and screening AD drug therapies.
Recently, several studies have suggested that AD may indeed have systemic manifestations caused by molecular/biophysical changes early in disease progression (15–17). AD skin fibroblast cell lines, for example, may offer a cellular environment in which the effects of AD-specific differences in amyloid β (Aβ)(1–42) have altered signal transduction. Such studies have identified AD-specific changes in K+ channels that are also sensitive to Aβ(1–42) interaction (15), changes in BK-mediated calcium mobilization via the IP3 receptor (16), and changes in MAPK phosphorylation (12). Still another report documented differences in Aβ secretion from skin fibroblasts of family members with familial AD genes (17).
BK is a potent inflammatory mediator that is produced in both brain and peripheral cells (e.g., skin fibroblasts) under pathophysiological conditions such as trauma, stroke, ischemia, and asthma. Via the G-protein-coupled B2 BK receptor (BK2bR), BK activates the phospholipase C/phospholipid-Ca2+/PKC cascade that, in turn, interacts with the Ras/Raf/MAPK kinase/MAPK signaling pathway, ultimately causing Erk1/2 phosphorylation (18). Erk1 and Erk2 were previously reported to be activated in response to Aβ stimulation of the MAPK signaling pathways (19). Here, we introduce an Alzheimer’s Erk1 and Erk2 index that differentially compares Erk1 and Erk2 phosphorylation induced by BK application within the media bathing human skin fibroblasts. The results, obtained by using both fibroblasts from cultured cell tissue banks and gels obtained from autopsy-confirmed patients, show promising specificity and sensitivity that could offer reliable confirmation of the clinical diagnosis of AD vs. other dementias.
Results
Intrinsic Erk1 and Erk2 Phosphorylation.
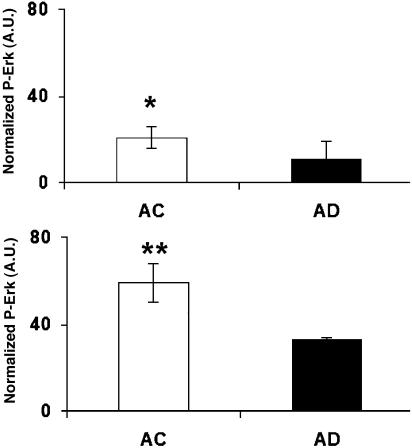
Phosphorylation of Erk1/2 was measured in 90–100% confluent AD and age-matched control cell lines (Fig. 1). The basal level of phosphorylation of Erk1/2 in control cell lines was, on average, higher than in AD cell lines, which suggests that the intrinsic phosphorylation of Erk was dysfunctional in AD patients.
Fig. 1.
Basal phosphorylation of Erk1/2. P-Erk was measured with Western blots from the cell lysates of 90–100% confluent skin fibroblast cells from the Coriell Cell Repository. Basal levels of P-Erk1 (Upper) and P-Erk2 (Lower) of AD cells (n = 3) were lower than for age-matched control (AC) cells (n = 4). ∗, P < 0.04; ∗∗, P < 0.01.
BK-Induced Phosphorylation of Erk1 and Erk2.
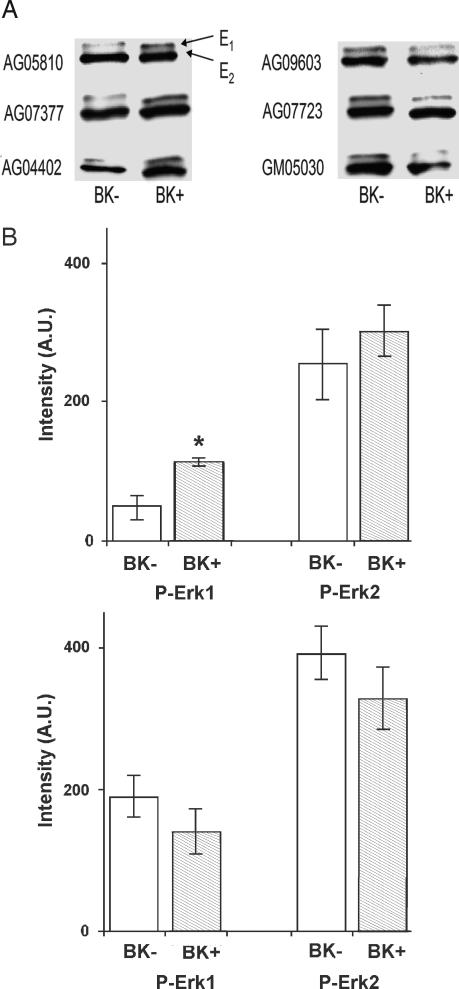
Phosphorylated Erk1 and Erk2 (P-Erk1 and P-Erk2), after treatment with BK (BK+) vs. treatment with vehicle (DMSO, without BK; BK−) for AD and control cell lines, were measured by Western blotting using a phospho-Erk antibody (Fig. 2A). P-Erk1 and P-Erk2 are presented separately for AD and control cell lines (Fig. 2B). For BK+ treatment, cells were treated with 10 nM BK for 10 min at 37°C. For the corresponding BK− treatment, cells were treated with same amount of vehicle for 10 min at 37°C. After 10 min, the P-Erk1 bands were darker for the BK+ than for the BK− treatment for AD but not for control cell lines. The data also indicate that BK-induced activation of Erk2 on average was higher for AD cell lines than for controls.
Fig. 2.
BK effects on Erk phosphorylation. (A) Typical Western blot data of P-Erk1/2 after treatment with BK (BK+) or with DMSO vehicle (BK−) for AD (Left) and control (Right) cell lines. For BK+ treatment, serum-free (for 24 hr) cells were treated with 10 nM BK for 10 min at 37°C. For BK− treatment, serum-free (for 24 hr) cells were treated with the same amount of DMSO (without BK) for 10 min at 37°C. After 10 min, the P-Erk1/2 bands were darker for BK+ than for BK− treatment for the AD but not the control cell lines. (B) P-Erk1 and P-Erk2 are plotted separately for AD (Upper) and control (Lower) patients. For AD but not control skin fibroblasts, P-Erk1 was higher after BK+ treatment than after BK− treatment. P-Erk1 values were, on average, higher for control than for AD cell lines. ∗, P < 0.006.
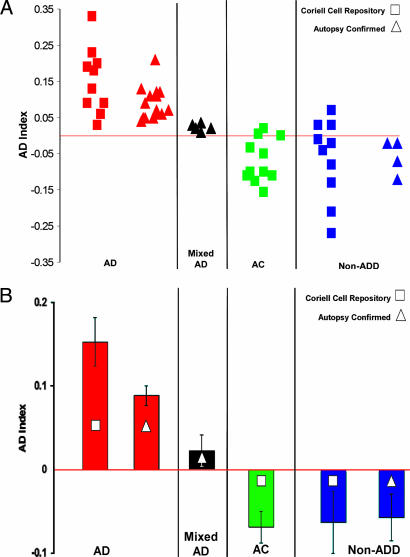
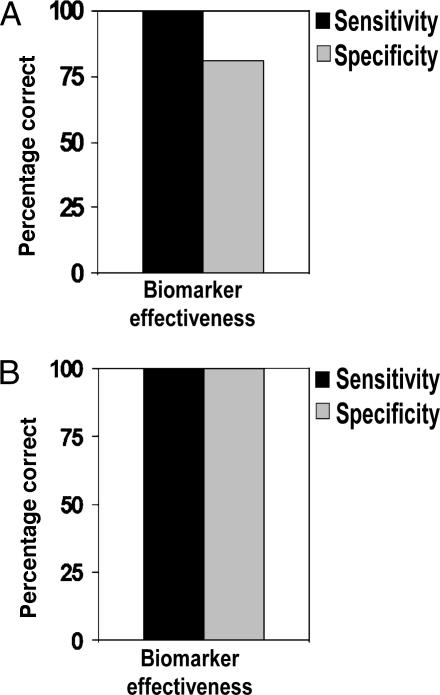
We then measured phosphorylation of Erk1 and Erk2 in every patient sample before and after BK stimulation (see Materials and Methods). A direct comparison of Erk1 and Erk2 phosphorylation, providing an AD index (see Materials and Methods), completely distinguished all nondemented control fibroblasts from all AD fibroblast cells obtained from the Coriell Cell Repository (Coriell Institute of Medical Research, Camden, NJ) (Fig. 3). A few cases of non-AD dementia were not distinguished, although this might be due to the lack of autopsy confirmation of the clinical diagnoses for the Coriell cells (see Discussion below). This interpretation was supported by the results of the AD index measurements obtained from gels for fibroblasts from patients with autopsy-confirmed diagnoses. For these gels, AD cases were accurately distinguished from all non-AD dementias and even from cases of “mixed” dementia resulting from both AD and other non-AD etiologies such as Parkinson’s disease, Huntington’s disease, and Lewy body disease (Fig. 3A). A corresponding bar graph (Fig. 3B) shows that for both categories (Coriell Cell Repository and autopsy-confirmed) AD patients had higher and positive AD index values compared with values for controls and for non-AD dementias. The five mixed-diagnosis cases confirmed by autopsy had positive AD index values that were lower than the pure AD values but still higher than non-AD dementia values (Fig. 3). This high accuracy in distinguishing AD from both non-AD dementia and nondemented control patients is reflected in the high sensitivity and specificity of the AD index for the Coriell cell samples and for gels from autopsy-confirmed cases (Fig. 4). Similar values reflecting high sensitivity and specificity were also obtained by using a ROC (receiver operating characteristic) analysis, a web-based calculator from the National Library of Medicine (www.rad.jhmi.edu/jeng/javarad/roc/JROCFITi.html).
Fig. 3.
AD index values for Erk1/2 phosphorylation in human fibroblasts. (A) The AD index was plotted for cells of patients from four different categories: (i) AD, (ii) mixed AD/PD/DLV (mixed diagnosis of AD, Parkinson’s disease, and Lewy body disease) as confirmed by autopsy, (iii) age-matched control (AC), and (iv) non-AD dementia (non-ADD; i.e., Parkinson’s disease and Huntington’s disease) for Coriell Cell Repository and autopsy-confirmed cell lines. For all AD diagnoses, the AD index had positive values. (B) The mean indices for AD cases were positive and higher than those for ACs and non-ADD patients. Mixed (AD/PD/DLV) autopsy patients had lower but still positive AD index values. Significance levels between groups were as follows: P < 0.00001 for AD vs. AC cells from the Coriell Cell Repository, P < 0.0001 for AD vs. non-ADD cells from autopsy-confirmed cases, and P < 0.002 for AD vs. mixed AD diagnosis cases.
Fig. 4.
Decision matrix analysis of the biomarker. Sensitivity and specificity of the biomarker are plotted to show the efficacy of disease detection for the Coriell Cell Repository (A) and autopsy-confirmed (B) cases. Sensitivity = true positive/(true positive + false negative); specificity = true negative/(true negative + false positive).
Alzheimer’s Erk1 and Erk2 Varies with Disease Duration.
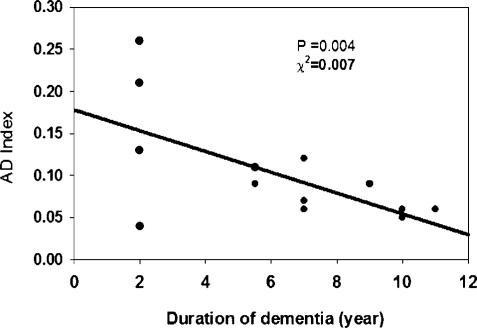
For a sample of those patients for whom information on disease duration was available, we examined the relationship of AD index magnitude to disease duration. As illustrated in Fig. 5, there was a significant inverse correlation of index magnitude with disease duration. These results suggest that the MAPK phosphorylation index is larger the earlier in the course of the disease it is measured.
Fig. 5.
Linear regression analysis of the AD-specific molecular biomarker as a function of disease duration for autopsy-confirmed cases. Values of the AD index increased with decreasing duration of dementia.
AD Erk1 and Erk2 Index Validates Clinical Diagnosis.
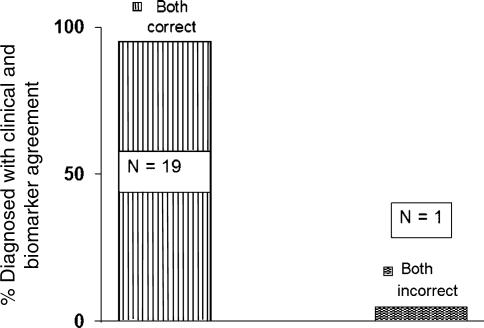
Gels from autopsy-confirmed clinical diagnoses indicated that there is considerable inaccuracy for clinical diagnoses made within 4 years of the onset of symptoms (unpublished data). This inaccuracy, as confirmed by autopsy, was previously observed for clinical diagnoses made earlier in disease progression (20). We, therefore, examined the gels of those autopsy-confirmed cases for which the clinical diagnosis of AD was in agreement with the AD Erk1/2 index diagnosis of AD. For the total of 20 such cases that also had come to autopsy, 19 were positively confirmed by autopsy, independent of the time elapsed from the onset of symptoms (Fig. 6). These results demonstrate that when the AD index agrees with the clinical diagnosis on the presence of AD, there is a high probability of an accurate diagnosis. This agreement indicates that the molecular biomarker described here could have important clinical utility for providing more certainty in the positive diagnosis of AD.
Fig. 6.
Diagnostic accuracy was confirmed by autopsy when the clinical diagnosis agreed with the biomarker on the presence of AD. With agreement, 19 of 20 cases were confirmed to have AD by autopsy criteria.
Discussion
To date, autopsy confirmation of clinically diagnosed dementia is usually available only for patients with long-standing disease. Considering that AD can last for 8–15 years, clinical diagnosis for AD of brief duration has been found to show high inaccuracy when compared with clinical diagnosis obtained later in the disease progression and then subjected to autopsy validation (20). Autopsy validation confirms the uncertainty associated with clinical diagnosis of dementia of 4 years or less duration (unpublished results). When clinical diagnosis and biomarker diagnosis agreed on AD (in 19 of 20 cases studied), there was high likelihood of autopsy confirmation (Fig. 6). Furthermore, the agreement between clinical diagnosis and the biomarker diagnosis for well established dementia (>4 years) has subsequently been confirmed with a much larger number of patients (unpublished results).
Further confirmation of the present results with Erk1 and Erk2 phosphorylation measurements using independent antibodies for P-Erk1 and P-Erk2 on separate gels would be of interest. However, the high diagnostic accuracy that was obtained here depended on the “internally controlled” measurement of band densities on the same Western gel. On the same lane of the same gel with the same antibody, distinct P-Erk1 and P-Erk2 bands that correspond exactly to electrophoretic mobility in relationship to known molecular weights could be evaluated before and after stimulation with BK. When comparable measures were tested without this internally controlled design, diagnostic accuracy was reduced. Furthermore, we found that reproducibility was also compromised when this internally controlled feature was not incorporated into the Erk1 and Erk2 measurements.
It should be mentioned that differences in Aβ secretion were found for skin fibroblasts of familial AD patients vs. controls (17). Those results, and previous measurements of K+ channels in skin fibroblasts (15), are consistent with the present findings. The results reported here, therefore, would also be interesting to pursue in skin fibroblasts from AD transgenic mice.
One implication of this and past studies of peripheral biomarkers for AD is that the pathophysiology of AD involves not only the brain but also a variety of other organ systems. This systemic pathophysiologic view of AD is consistent with recent observations that amyloid and tau metabolic pathways are ubiquitous in the human body and are manifest in blood, saliva, skin, and extra-brain tissues (21). Among the peripheral tissues, the superiority of skin fibroblasts over peripheral blood lymphocytes was recently discussed in a gene expression study for familial AD cases (22). Blood lymphocytes were found to be more susceptible to variation introduced by external stimuli such as fever, infections, and drug treatment.
The close correlation shown here of the Erk1/Erk2 index with AD also focuses attention on these substrates as a “read-out” of AD signaling abnormalities of APP processing (23) and increased levels of soluble Aβ(1–42). This is not surprising when we consider that the PKC–MAPK pathway interacts at multiple steps with the APP processing pathway. These interactions include the following:
PKC activates MAPK Erk1/2 and also activates α-secretase(s) that cleave APP.
Aβ inhibits PKC (11).
Aβ activates glycogen synthase kinase-3β (GSK-3β) that increases tau phosphorylation and decreases MAPK Erk1/2 phosphorylation.
PKC inhibits GSK-3β.
Toxic cholesterol metabolites (e.g., 7-OH cholesterol) inhibit PKC-α (24), indirectly increasing Aβ.
Evidence that dysfunction of PKC isozymes themselves may contribute to the earliest initiation of the AD process is reflected, by means of all of the above signaling events, in abnormality of the Erk1/2 phosphorylation ratio.
Finally, it is also a mystery how the specificity of AD phosphorylation abnormality may be maintained through the successive passages of the human fibroblast cell lines. This phenomenon might be explained by an interaction of PKC/MAPK levels with the fibroblast genome. It is well known that PKC and MAPK regulate gene expression. It may be possible, therefore, that interference with an ongoing cycle of PKC/MAPK stimulation of their own synthesis could perpetuate the abnormalities of PKC levels and MAPK phosphorylation from one generation of human fibroblasts to the next.
Materials and Methods
BK (molecular weight, 1,060.2) was purchased from Calbiochem (San Diego, CA). Anti-phosphopho-p44/p42 MAPK from rabbit was obtained from Cell Signaling Technology (Danvers, MA). Anti-regular Erk1/2 was purchased from Upstate Cell Signaling Solutions (Lake Placid, NY). Anti-rabbit secondary antibody was purchased from The Jackson Laboratory (Bar Harbor, ME).
Skin Fibroblast Cell Culture.
Human skin fibroblast cell culture systems were used for these studies. Banked skin fibroblasts cells with the diagnoses AD, non-AD dementia (e.g., Huntington’s disease and Parkinson’s disease, and schizophrenia), and age-matched control from the Coriell Institute of Medical Research were cultured (supplemented with 10% serum and penicillin/streptomycin) at 37°C with 5% CO2 to the 90–100% confluence stage in 25-ml cell culture flasks. Cells were “starved” in serum-free medium (DMEM) for 24 h. A solution of 10 nM BK (in DMSO) was prepared in DMEM with 10% serum. Seven milliliters of the 10 nM BK solution was added to the culture flasks and incubated at 37°C for 10 min. For the controls, the same amount of DMSO was added in DMEM with 10% serum. Seven milliliters of this medium with DMSO (<0.01%) was added to the culture flasks and incubated at 37°C for 10 min. After washing four times with cold (4°C) 1× PBS, flasks were kept in a dry ice/ethanol mixture for 15 min. Flasks were then removed from the dry ice/ethanol mixture, and 100 μl of lysis buffer (10 mM Tris, pH 7.4/150 mM NaCl/1 mM EDTA/1 mM EGTA/0.5% Nonidet P-40/1% Triton X-100/1% protease inhibitor mixture/1% ser/thr/tyrosine phosphatase inhibitor cocktails) was added into each flask. Flasks were placed on an end-to-end shaker in a cold room (4°C) for 30 min, and cells were collected from each flask with a cell scraper. Cells were sonicated and then centrifuged at 14,000 rpm (Eppendorf Centrifuge 5417R; Brinkmann Instruments, Westbury, NY) for 15 min, and the supernatant was used for Western blotting after total protein assay. Cells with a passage number ≤16 were used in this study.
Western Blot Analysis.
Equal volumes of 2× SDS sample buffer were added to each cell lysate and boiled for 10 min in a boiling water bath. Electrophoresis was conducted on an 8–16% minigradient gel, and samples were transferred onto a nitrocellulose membrane. Total Erk1, Erk2, P-Erk1, and P-Erk2 were determined by using specific antibodies that react with either the unphosphorylated or phosphorylated forms of Erk1 and Erk2 (Upstate Cell Signaling Solutions). Erk1 was distinguished from Erk2 only on the basis of gel mobility.
Data Analysis.
Signals of the Western blot protein bands were scanned with a Fuji LAS-1000 Plus scanner (Fuji Photo Film, Tokyo, Japan). The intensities of Erk1, Erk2, P-Erk1, and P-Erk2 were measured from scanned protein bands by using custom-designed software developed by Thomas Nelson of our institute (Blanchette Rockefeller Neurosciences Institute). The intensity was measured by strip densitometry. The protein bands were selected by strip, and each pixel density was calculated after background subtraction by the software. The ratios of P-Erk1 to P-Erk2 were calculated from sample (BK+) and control (BK−), respectively. The following formula was used to create an index that distinguishes between AD and non-AD cases:
Acknowledgments
We thank Dr. Thomas Nelson (Blanchette Rockefeller Neurosciences Institute) for design and development of the software used to differentiate P-Erk1 and P-Erk2 band intensities on the Western blots.
Abbreviations
- AD
Alzheimer’s disease
- Aβ
amyloid β
- APP
amyloid precursor protein
- BK
bradykinin
- P-Erk
phosphorylated Erk.
Footnotes
Conflict of interest statement: No conflicts declared.
References
- 1.Alvarez X. A., Franco A., Fernandez-Novoa L., Cacabelos R. Mol. Chem. Neuropathol. 1996;29:237–252. doi: 10.1007/BF02815005. [DOI] [PubMed] [Google Scholar]
- 2.Solerte S. B., Cravello L., Ferrari E., Fioravanti M. Ann. N.Y. Acad. Sci. 2006;917:331–340. doi: 10.1111/j.1749-6632.2000.tb05399.x. [DOI] [PubMed] [Google Scholar]
- 3.Tarkowski E., Andreasen N., Tarkowski A., Blennow K. J. Neurol. Neurosurg. Psychiatry. 2003;74:1200–1205. doi: 10.1136/jnnp.74.9.1200. [DOI] [PMC free article] [PubMed] [Google Scholar]
- 4.Tarkowski E., Blennow K., Wallin A., Tarkowski A. J. Clin. Immunol. 1999;19:223–230. doi: 10.1023/a:1020568013953. [DOI] [PubMed] [Google Scholar]
- 5.Tarkowski E., Liljeroth A. M., Nilsson A., Ricksten A., Davidsson P., Minthon L., Blennow K. Neurology. 2000;54:2077–2081. doi: 10.1212/wnl.54.11.2077. [DOI] [PubMed] [Google Scholar]
- 6.Tarkowski E., Wallin A., Regland B., Blennow K., Tarkowski A. Acta Neurol. Scand. 2001;103:166–174. doi: 10.1034/j.1600-0404.2001.103003166.x. [DOI] [PubMed] [Google Scholar]
- 7.Galimberti D., Schoonenboom N., Scheltens P., Fenoglio C., Bouwman F., Venturelli E., Guidi I., Blankenstein M. A., Bresolin N., Scarpini E. Arch. Neurol. 2006;63:538–543. doi: 10.1001/archneur.63.4.538. [DOI] [PubMed] [Google Scholar]
- 8.Masliah E., Cole G. M., Hansen L. A., Mallory M., Albright T., Terry R. D., Saitoh T. J. Neurosci. 1991;11:2759–2767. doi: 10.1523/JNEUROSCI.11-09-02759.1991. [DOI] [PMC free article] [PubMed] [Google Scholar]
- 9.Van Huynh T., Cole G., Katzman R., Huang K. P., Saitoh T. Arch. Neurol. 1989;46:1195–1199. doi: 10.1001/archneur.1989.00520470049026. [DOI] [PubMed] [Google Scholar]
- 10.Govoni S., Bergamaschi S., Racchi M., Battaini F., Binetti G., Bianchetti A., Trabucchi M. Neurology. 1993;43:2581–2586. doi: 10.1212/wnl.43.12.2581. [DOI] [PubMed] [Google Scholar]
- 11.Favit A., Grimaldi M., Nelson T. J., Alkon D. L. Proc. Natl. Acad. Sci. USA. 1998;95:5562–5567. doi: 10.1073/pnas.95.10.5562. [DOI] [PMC free article] [PubMed] [Google Scholar]
- 12.Zhao W. Q., Ravindranath L., Mohamed A. S., Zohar O., Chen C. H., Lyketsos C. G., Etcheberrigaray R., Alkon D. L. Neurobiol. Dis. 2002;11:166–183. doi: 10.1006/nbdi.2002.0520. [DOI] [PubMed] [Google Scholar]
- 13.Frey H. J., Mattila K. M., Korolainen M. A., Pirttila T. Neurochem. Res. 2005;30:1501–1510. doi: 10.1007/s11064-005-8827-7. [DOI] [PubMed] [Google Scholar]
- 14.Irizarry M. C. NeuroRx. 2004;1:226–234. doi: 10.1602/neurorx.1.2.226. [DOI] [PMC free article] [PubMed] [Google Scholar]
- 15.Etcheberrigaray R., Ito E., Kim C. S., Alkon D. L. Science. 1994;264:276–279. doi: 10.1126/science.8146663. [DOI] [PubMed] [Google Scholar]
- 16.Ito E., Oka K., Etcheberrigaray R., Nelson T. J., McPhie D. L., Tofel-Grehl B., Gibson G. E., Alkon D. L. Proc. Natl. Acad. Sci. USA. 1994;91:534–538. doi: 10.1073/pnas.91.2.534. [DOI] [PMC free article] [PubMed] [Google Scholar]
- 17.Scheuner D., Eckman C., Jensen M., Song X., Citron M., Suzuki N., Bird T. D., Hardy J., Hutton M., Kukull W., et al. Nat. Med. 1996;2:864–870. doi: 10.1038/nm0896-864. [DOI] [PubMed] [Google Scholar]
- 18.Yang C. M., Lin M. I., Hsieh H. L., Sun C. C., Ma Y. H., Hsiao L. D. J. Cell. Physiol. 2005;203:538–546. doi: 10.1002/jcp.20250. [DOI] [PubMed] [Google Scholar]
- 19.McDonald D. R., Bamberger M. E., Combs C. K., Landreth G. E. J. Neurosci. 1998;18:4451–4460. doi: 10.1523/JNEUROSCI.18-12-04451.1998. [DOI] [PMC free article] [PubMed] [Google Scholar]
- 20.Hagervorst E., Bandelow S., Combrinck M., Irani S. R., Smith A. D. Dement. Geriatr. Cogn. Disord. 2003;16:170–180. doi: 10.1159/000071006. [DOI] [PubMed] [Google Scholar]
- 21.Gasparini L., Racchi M., Binetti G., Trabucchi M., Solerte S. B., Alkon D., Etcheberrigaray R., Gibson G., Blass J., Paoletti R., Govoni S. FASEB J. 1998;12:17–34. doi: 10.1096/fasebj.12.1.17. [DOI] [PubMed] [Google Scholar]
- 22.Nagasaka Y., Dillner K., Ebise H., Teramoto R., Nakagawa H., Lilius L., Axelman K., Forsell C., Ito A., Winblad, et al. Proc. Natl. Acad. Sci. USA. 2005;102:14854–14859. doi: 10.1073/pnas.0504178102. [DOI] [PMC free article] [PubMed] [Google Scholar]
- 23.Neve R. L., McPhie D. L., Chen Y. Biochem. Soc. Symp. 2001:37–50. doi: 10.1042/bss0670037. [DOI] [PubMed] [Google Scholar]
- 24.Nelson T. J., Alkon D. L. J. Biol. Chem. 2005;280:7377–7387. doi: 10.1074/jbc.M409071200. [DOI] [PubMed] [Google Scholar]


