Abstract
Objective: To investigate the dynamics of vascular volume and the plasma dilution of lactated Ringer’s solution in patients during the induction of general and epidural anesthesia. Methods: The hemodilution of i.v. infusion of 1000 ml of lactated Ringer’s solution over 60 min was studied in patients undergoing general (n=31) and epidural (n=22) anesthesia. Heart rate, arterial blood pressure and hemoglobin (Hb) concentration were measured every 5 min during the study. Surgery was not started until the study period had been completed. Results: General anesthesia caused the greater decrease of mean arterial blood pressure (MAP) (mean 15% versus 9%; P<0.01) and thereby followed by a more pronounced plasma dilution, blood volume expansion (VE) and blood volume expansion efficiency (VEE). A strong linear correlation between hemodilution and the reduction in MAP (r=−0.50; P<0.01) was found. At the end of infusion, patients undergoing general anesthesia retained 47% (SD 19%) of the infused fluid in the circulation, while epidural anesthesia retained 29% (SD 13%) (P<0.001). Correspondingly, a fewer urine output (mean 89 ml versus 156 ml; P<0.05) and extravascular expansion (454 ml versus 551 ml; P<0.05) were found during general anesthesia. Conclusion: We concluded that the induction of general anesthesia caused more hemodilution, volume expansion and volume expansion efficiency than epidural anesthesia, which was triggered only by the lower MAP.
Keywords: Hemodilution, Volume expansion, Ringer’s solution, General anesthesia, Epidural anesthesia
INTRODUCTION
Relative hypovolemia is generally considered to be the cause of the reduction of the blood pressure during epidural anesthesia but more rarely after general anesthesia. Although the mechanisms accounting for any arterial hypotension are probably different, hemodilution is frequently induced by volume loading with Ringer’s solution before induction of general or epidural anesthesia to prevent decrease in arterial pressure (AP). Previous studies have reported that the body’s handing of crystalloid solutions is altered during epidural anesthesia. Drobin and Hahn (1996) administered 15 ml/kg body weight of lactated Ringer’s solution to 22 elderly patients undergoing short urological operations. They found that volume loading with crystalloid solution results in more pronounced hemodilution in patients who develop arterial hypotension during induction of epidural anesthesia than in those who remain normotensive. Marked hemodilution has also been described in parturients who develop hypotension during onset of these blocks before Cesarean section (Kempen and Tick, 1990). After being given volume loading, patients who show a decrease in AP retain about 30% of the solution, which is twice as large in those who maintain a normal AP (Hahn, 1992; 1993a; 1993b). Since the induction of arterial hypotension during general anesthesia is different from epidural anesthesia, which might mean the body handles infused fluid differently.
In the present study, we want to describe the dynamics of vascular volume and the plasma dilution of lactated Ringer’s solution given intravenously in patients during the induction of general or epidural anesthesia. And furthermore we want to explore whether there were some differences between the two forms of anesthesia in the dynamics and the hemodilution and what is the determinant factor that triggers hemodilution of lactated Ringer’s solution.
MATERIALS AND METHODS
Fifty-three ASA I-II patients scheduled for elective surgery requiring general or epidural anesthesia were recruited. The study was approved by the Hospital Research Ethics Committee and written informed consent was obtained from all patients before the start of the study. Exclusion criteria included serious impairment of respiratory, cardiovascular, hepatic, renal, or endocrine function. The choice of anesthesia was made on clinical grounds by the anesthetist and not by the research team.
Procedure
All patients were premedicated with diazepam 5 mg (<65 year) or 2.5 mg (≥65 year) orally 30 min before the induction of anesthesia. No patient was given enteric lavage. After fasting overnight, all patients underwent surgery, which started about 9 a.m. When entering the operating theatre, a cannula was placed in the cubital vein of one arm for purpose of infusing fluid. A radial artery catheter was inserted for sampling and continuous measurement of arterial blood pressure. Patients in epidural group was placed in the left lateral decubitus position, an epidural catheter was inserted through a 17-gauge Tuohy needle at L2-3 and advanced 3~4 cm, and a catheter was aspirated to excluded intrathecal or i.v. placement and then secured. The patient was then returned to the supine position. After all the monitoring devices were connected, an i.v. fluid load of 1000 ml of lactated Ringer’s solution (Pharmacia, Baxter, Shanghai, China) was given at a constant rate over 60 min via an infusion pump (IEC 601-1, Class 1, Abbott Laboratories, North Chicago, IL). The lactated Ringer’s solution had the following ionic content: Na 130, K 4, Cl 109, and lactate 28 mmol/L.
Epidural anesthesia was induced 10 min after starting the i.v. infusion. At first 3 ml of 2% lidocaine was injected through epidural catheter as a test dose. Five minutes later, the patient was given an anesthetic solution of 0.5% ropivacaine (Pharmacia, AstraZeneca, Germany) without epinephrine in increments of 3~5 ml every 5 min until the total dose had been given. The other patients received general anesthesia 20 min after starting the i.v. infusion. Induction was performed with propofol 1.5 mg/kg, midazolam 0.05 mg/kg, sufentanil 0.6 μg/kg and vecuronium bromide 0.6 mg/kg, and it was maintained with propofol 3 mg/(kg·h) and vecuronium bromide 4 mg/h.
Monitoring included pulse oximetry, electrocardiography, invasive arterial blood pressure and heart rate by a multi-function monitor (Datex-Ohmeda, Hoevelaken, the Netherlands). Hypotension was defined as a decrease in systolic blood pressure by more than 30% of the pre-anesthetic value, or a systolic blood pressure <90 mmHg. Patients who did not fulfill this criterion were considered normotensive. Hypotension was treated by injecting ephedrine 6 mg i.v. Bradycardia (<55 beat per minute) was treated by administering 0.5 mg of atropine i.v. Surgery was not started until the study period had been completed.
Measurement
Arterial blood (1.0 ml) was collected every 5 min during the study period of 60 min. A small discard sample was drawn before each blood collection to preclude any admixture of rinsed with 2.0 ml of saline after each sample collection to prevent clotting. Before each infusion of crystalloid, one sample was drawn in duplicate and the mean value was used in the calculations. The mean of the later of these duplicate samples was used as a “baseline”, but both pairs were used to calculate the coefficient of variation for the analyses performed. The urine was collected via an indwelling catheter, which had been inserted into the bladder under topical anesthesia before the study started. Urine output was measured at the time of induction of anesthesia and also at the end of the study.
At each time point, Hb concentration, hematocrit (Hct), and plasma Na+, K+, and Cl− of sampled blood were measured by i-stat analyzer (i-stat Corp., East Windsor, NJ) with a coefficient of variation of 1%. Meanwhile we measured hemodynamic variables: systolic arterial pressure (SAP), diastolic arterial pressure (DAP), mean arterial pressure (MAP) and heart rate (HR).
Calculation
The plasma dilution as measured in the radial artery was used to quantitate the water load. We obtain the following hemodilution at time t:
| Hemodilution=([Hb]0/[Hb]t−1)/(1−Hct0). | (1) |
The amount of infused volume remaining in the circulation was calculated from the following equation (Hahn, 1992; 1993a; 1993b):
| Fluid remained (%)=(BVt−BV0)/infused volume, | (2) |
where BVt=BV 0×[Hb]0/[Hb]t and BV 0=blood volume before treatment, as estimated from the height and weight of the patient (Retzlaff et al., 1969):
| BV0 (L)=0.03308 weight (kg)+0.3561 length3 (m)+0.1833. | (3) |
The change in blood volume divided by the volume of test fluid infused (fluid remained) was calculated as an indicator of the volume expansion efficiency (VEE) of the infused fluid, while infused volume minus vascular expansion and urine loss was used as an indicator of extravascular expansion. VE was expressed in ml/kg.
Demographic data were presented as mean (SD) and count (n) as appropriate. The methods of statistical evaluation were simple and multiple linear regression analysis, Fisher’s exact test, one-way ANOVA, two-way ANOVA, and the group t test. P<0.05 was considered statistically significant.
RESULTS
There were no significant differences between two groups in baseline DAP, MAP or HR. Weight and concentration of Hb were higher before epidural anesthesia than before general anesthesia (P=0.03, 0.01) (Table 1).
Table 1.
Patient data, urine output, amount of fluid infused that was retained in the blood and the extravascular expansion during 60 min of experiment
| Demographic characteristics | General anesthesia (n=31) | Epidural anesthesia (n=22) | P |
| Age (year) | 60 (14) | 61 (15) | 0.90 |
| Weight (kg) | 58 (11) | 66 (14) | 0.03 |
| M/F | 17/14 | 17/4 | 0.09 |
| SAP (mmHg) | 140 (24) | 149 (26) | 0.20 |
| DAP (mmHg) | 71 (11) | 75 (13) | 0.30 |
| MAP (mmHg) | 97 (15) | 103 (15) | 0.15 |
| HR (beats/min) | 80 (15) | 76 (11) | 0.22 |
| Hb (g/L) | 11.8 (1.8) | 13 (1.3) | 0.01 |
| Number of patients receiving ephedrine | 8 | 1 | 0.09 |
| Urine output (ml) | 89 (62) | 156 (87) | 0.02 |
| Amount of fluids retained (%) 0~60 min | 47 (19) | 29 (13) | 0.0003 |
| Extravascular expansion (ml) 0~60 min | 454 (184) | 551 (144) | 0.04 |
Data are expressed as mean (SD) and count as appropriate
Hemodilution and blood volume expansion
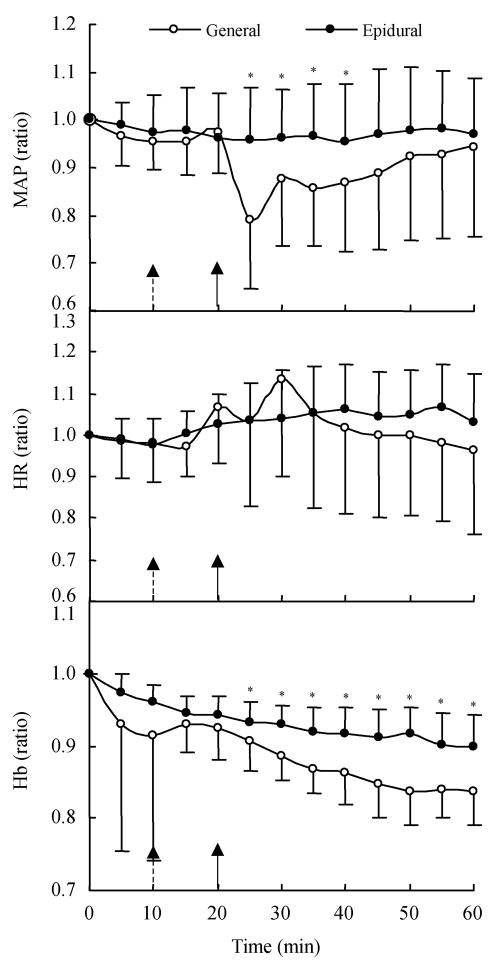
During the two forms of anesthesia, lactated Ringer’s solution induced similar hemodilution with an average decrease in Hb of more than 1 g/L (P<0.05) hat did not return to the preinfusion level during the observation period (Fig.1, bottom). In general anesthesia group, the lowest Hb level was reached at 50 min, i.e., 10 min before the end of infusion, whereas in epidural group, lactated Ringer’s solution induced the lowest Hb value at 60 min, i.e., just at the end of infusion.
Fig. 1.
The relative changes in mean arterial blood pressure (MAP) (top), heart rate (HR) (middle), and hemoglobin (Hb) concentration (bottom) during volume loading with lactated Ringer’s solution and induction of general (10 min, dashed arrows) and epidural anesthesia (20 min, real line arrow) in 53 patients (mean (SD))
* General different than epidural P<0.05
Fig.1 (bottom) described the relative change of Hb concentration during volume loading with lactated Ringer’s solution in each group. After 25 min of infusion, i.e., 15 min after induction of epidural and 5 min after induction of general anesthesia, till the end of infusion, there was significant difference between the two anesthesia groups.
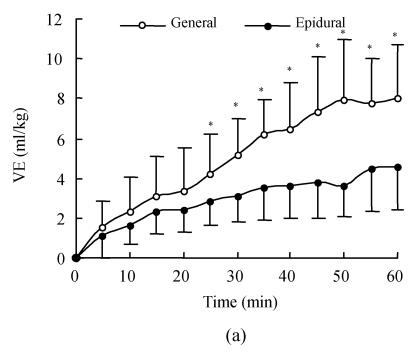
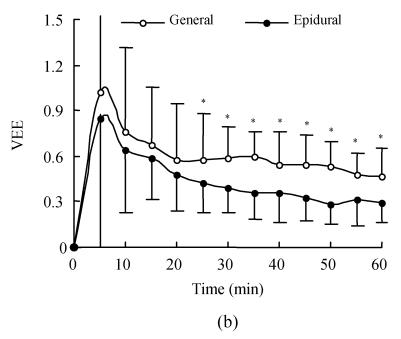
Fig.2 shows the time course of VE and VEE produced by lactated Ringer’s solution in the two groups. During the first 5 min of infusion, the VEE was more than 1.0 mg/kg in the general anesthesia group, which meant that lactated Ringer’s solution increased vascular volume by an amount more than infused volume; whereas the VEE was 0.85 in epidural anesthesia group. Thereafter, it declined (Fig.2b) in each group. Volume expansion peaked at the end of infusion in both groups; at that time, the cumulative volume expansion was 8.0 ml/kg and 4.5 ml/kg (Fig.2a), whereas VEE was 0.47 and 0.29 in general and epidural anesthesia group respectively. In addition, at all time points during the 60-min infusion period, the VE and VEE were all higher in general anesthesia group than in the epidural group, but these differences were not statistically significant before 25 min of infusion; thereafter, they became greater significantly in general anesthesia group (Fig.2).
Fig. 2.
(a) Blood volume expansion (VE) expressed as ml/kg during 60-min of 1000 lactated Ringer’s solution; (b) Volume expansion efficiency (VEE) calculated as volume expansion (ml) divided by infused volume (ml) for lactated Ringer’s solution
The infusion started as time 0. Zero on the ordinate (y axis) represents blood volume expansion at baseline. Each data point represents the mean (SD); *General different than epidural P<0.05
At the end of infusion, extravascular volume expansion was 454 (184) ml in general group and 551 (144) ml in epidural group (P<0.05). This contraction of the extravascular volume was roughly equivalent to the intravascular expansion at the end of infusion.
Hemodynamics
MAP decreased significantly from 25 min to 40 min after infusion in patients undergoing general anesthesia (two-way ANOVA test; P<0.05) but remained unchanged in those undergoing epidural anesthesia (Fig.1, top). There were nearly no changes in heart rate of the two groups, irrespective of the magnitude of the hypotension reaction (Fig.1, middle). General anesthesia caused greater reduction of the mean arterial pressure (MAP, average 15%) than epidural anesthesia did (average 9%; paired t test, P<0.001). Eight patients in the general anaesthesia and one in the epidural group received an i.v. injection of ephedrine to combat hypotension (Table 1).
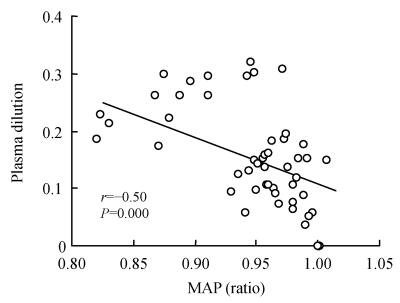
A search was made for factors correlating with hemodilution and the result showed a statistically significant linear relationship between the reduction in MAP (ratio of MAP at 5~60 min by MAP at 0~5 min) and the plasma dilution (Fig.3; P<0.001). Multiple regression analysis confirmed that no other factors, including the change in HR (P=0.46) and baseline MAP (P=0.47), correlated with hemodilution. There was no correlation between body weight and hemodilution (P=0.22).
Fig. 3.
The decrease in mean arterial blood pressure (MAP) vs plasma dilution from volume loading with lactated Ringer’s solution to after general and epidural anesthesia had been induced 40 min and 50 min later
DISCUSSION
Some aspects of the study methods require further explanation. We started the induction of epidural anesthesia 10 min earlier than general anesthesia considering the slower onset time of epidural anesthesia, on average, about 15 min (Brown, 2000), while most drugs used in general anesthesia have onset time of about 5 min. In order to reduce the effect of baseline values on the results of hemodilution and hemodynamics, we used ratios rather than the differences for analysis. VE was expressed as ml/kg to reduce the influence of body weight of patients.
Previous studies showed that relatively inadequate circulating blood volume resulting from sympathetic block is one of the main mechanisms responsible for hypotension during the onset of epidural anesthesia (Mark and Steele, 1989). Blood is pooled in the capillary vessels of legs at the expense of cardiac filling (Arndt et al., 1985). General anesthesia also results in arterial hypotension, although its induction is associated with a generalized peripheral vasodilatation rather than a sympathetic block. With the regimen described, our results showed that at 25 min after infusion, the MAP decreased more rapidly in the patients undergoing general anesthesia than epidural anesthesia (Fig.1, top). At the same time, the hemodilution, volume expansion and volume expansion efficiency become greater accordingly in general anesthesia group (Fig.1, bottom and Fig.2). The increased hemodilution in patients undergoing general anesthesia probably indicates an altered relationship in compliance with the volume expansion between the intravascular fluid compartment and the interstitial fluid, to the advantage of the dilated intravascular fluid compartment. Induction of general anesthesia results in an excess of plasma dilution that is likely dependent on the greater decrease in MAP that is confirmed by the relationship between the reduction of MAP and hemodilution (Fig.3), which is consistent with those found by other investigators (Drobin and Hahn, 1996; Hahn, 1992).
In the present study we also found that the fluid retained in circulation was more than 100% during the first 5 min of lactated Ringer’s solution infused in general anesthesia. “Autotransfusion” with interstitial fluid, is a rapid process if the capillary pressure is lowered (Lanne and Lundvall, 1989). However, at the end of infusion, the intravascular VEE was still >28% of the infused solution, which is more than the values suggested by current anesthesia and surgical textbooks quoting a “4:1 rule”, implying that about 20% of infused crystalloid should be retained in the intravascular space (Kaye and Grogono, 2000). Previous study of Drobin and Hahn (1996) on Ringer’s solution in patients under condition of epidural anesthesia indicated that more than 35% of infused volume was retained in the circulation. Other studies also showed that volume expansion can be somewhat larger and more sustained in animals and humans under conditions of hypovolemia in which VEE as high as 0.18 to 0.30 are reported immediately after infusion (Tølløfsrud et al., 1998; Brauer et al., 1999). On the contrary when Ringer’s solution was infused into normovolemic sheep, the VEE became as low as 10% (Tølløfsrud et al., 2001). The hypovolemia increases antidiuretic hormone and aldosterone and reduces renal blood flow, all of which decrease urine output. During hypovolemia, capillary pressure and lymphatic return are lower than normovolemia, tending to favor intravascular volume expansion and increasing the effective volume of infused fluid. In the present study, all of the patients underwent about 8 h fasting before elective operation, and patients received 166 ml in epidural group and 333 ml in general group before induction of anesthesia. It is therefore believed that the hypotention resulting from anesthesia is due to absolute and relative hypovolemia. During the induction of general anesthesia, there was recruitment of fluid to the plasma, possibly triggered by the volume of injected anesthetics, but it was fairly modest and occurred slowly (Olsson et al., 2004; Ewaldsson and Hahn, 2005). Further studies are required to determine whether anesthesia has similar effects with hypovolemia or is due to some other mechanisms.
After infusion of the test fluids, Svensén and Hahn (1997) and Ewaldsson and Hahn (2005) used nonlinear regression of fluid-induced changes in Hb concentration to separate mathematically a clearance curve into one-volume and two-volume-of-fluid-space models. In our peer article (Li et al., 2006), we also used volume kinetics analysis to compare the distribution and elimination of lactated Ringer’s solution during the induction of epidural and general anesthesia.
In summary, we found that the induction of general anesthesia caused more hemodilution, volume expansion and volume expansion efficiency than epidural anesthesia, which was triggered only by the lower MAP.
Acknowledgments
Special thanks go to Prof. Shengmei Zhu for her suggestions and guidance of this research.
Footnotes
Project (No. 20051899) supported by Office of Education of Zhejiang Province, China
References
- 1.Arndt JO, Höck AS, Stanton-Hicks M, Stühmeier KD. Peridural anesthesia and the distribution of blood in supine humans. Anesthesiology. 1985;63:616–623. doi: 10.1097/00000542-198512000-00011. [DOI] [PubMed] [Google Scholar]
- 2.Brauer KI, Prough DS, Traber LD. Antecedent hemorrhage increases plasma volume expansion (PVE) in response to 0.9% saline infusion in sheep. Anesth Analg. 1999;88:S135. doi: 10.1097/00000539-199902001-00135. [DOI] [Google Scholar]
- 3.Brown DL. Spinal, Epidural, and Gaudal Anesthesia. In: Miller RD, editor. Anesthesia. 5th Ed. New York: Churchill Livingstone; 2000. pp. 1491–1515. [Google Scholar]
- 4.Drobin D, Hahn RG. Time course of increased hemodilution in hypotension induced by extradural anaesthesia. Br J Anaesth. 1996;77:223–226. doi: 10.1093/bja/77.2.223. [DOI] [PubMed] [Google Scholar]
- 5.Ewaldsson CA, Hahn RG. Kinetics and extravascular retention of acetated Ringer’s solution during isoflurane and propofol anesthesia for thyroid surgery. Anesthesiology. 2005;103(3):460–469. doi: 10.1097/00000542-200509000-00006. [DOI] [PubMed] [Google Scholar]
- 6.Hahn RG. Haemoglobin dilution from epidural-induced hypotention with and without fluid loading. Acta Anaesthesiologica Scandinavica. 1992;36:241–244. doi: 10.1111/j.1399-6576.1992.tb03457.x. [DOI] [PubMed] [Google Scholar]
- 7.Hahn RG. Blood volume at the onset of hypotension in TURP performed during epidural anaesthesia. Eur J Anaesthesiol. 1993;10:219–225. [PubMed] [Google Scholar]
- 8.Hahn RG. Increased haemodilution in hypotension induced by epidural anaesthesia. Acta Anaesthesiologica Scandinavica. 1993;37:357–360. doi: 10.1111/j.1399-6576.1993.tb03728.x. [DOI] [PubMed] [Google Scholar]
- 9.Kaye AD, Grogono AW. Fluid and Electrolyte Physiology. In: Miller RD, editor. Anesthesia. 5th Ed. New York: Churchill Livingstone; 2000. pp. 1586–1603. [Google Scholar]
- 10.Kempen PM, Tick C. Hemodilution, regional block and Cesarean section. Regional Anesthesia. 1990;15(1S):9. [Google Scholar]
- 11.Lanne T, Lundvall J. Very rapid net transcapillary fluid absorption from skeletal muscle and skin in man during pronounced hypovolaemia circulatory stress. Acta Physiologica Scandinavica. 1989;136:1–6. doi: 10.1111/j.1748-1716.1989.tb08623.x. [DOI] [PubMed] [Google Scholar]
- 12.Li YH, Zhu SM, Hahn RG. The kinetics of Ringer’s solution in young and elderly patients during induction of general and epidural anesthesia. Anesth Analg. 2006 doi: 10.1213/01.ane.0000204254.87933.f6. in press. [DOI] [PubMed] [Google Scholar]
- 13.Mark JB, Steele SM. Cardiovascular effects of spinal anesthesia. International Anesthesiology Clinics. 1989;27:31–53. doi: 10.1097/00004311-198902710-00007. [DOI] [PubMed] [Google Scholar]
- 14.Olsson J, Svensén CH, Hahn RG. The volume kinetics of acetated Ringer’s solution during laparoscopic cholecystectomy. Anesth Analg. 2004;99(6):1854–1860. doi: 10.1213/01.ANE.0000134809.07605.3C. [DOI] [PubMed] [Google Scholar]
- 15.Retzlaff JA, Tauxe WN, Kiely JM. Erythrocyte volume, plasma volume, and lean body mass in adult men and women. Blood. 1969;33:649–667. [PubMed] [Google Scholar]
- 16.Svensén C, Hahn RG. Volume kinetics of ringer solution, Dextran 70, and hypertonic saline in male volunteers. Anesthesiology. 1997;87:204–212. doi: 10.1097/00000542-199708000-00006. [DOI] [PubMed] [Google Scholar]
- 17.Tølløfsrud S, Tonnessen T, Skraastad O. Hypertonic saline and dextran in normovolaemic and hypovolaemic healthy volunteers increases interstitial and intravascular fluid volumes. Acta Anaesthesiologica Scandinavica. 1998;42:145–153. doi: 10.1111/j.1399-6576.1998.tb05100.x. [DOI] [PubMed] [Google Scholar]
- 18.Tølløfsrud S, Elgjo GI, Prough DS. The dynamics of vascular volume and fluid shifts of lactated Ringer’s solution and hypertonic-saline-dextran solutions infused in normovolemic sheep. Anesth Analg. 2001;93:823–831. doi: 10.1097/00000539-200110000-00005. [DOI] [PubMed] [Google Scholar]


