

Abstract
Understanding the processes that shape the genetic structure of parasite populations and the functional consequences of different parasite genotypes is critical for our ability to predict how an infection can spread through a host population and for the design of effective vaccines to combat infection and disease. Here, we examine how the genetic structure of parasite populations responds to host genetic heterogeneity. We consider the well-characterized molecular specificity of major histocompatibility complex binding of antigenic peptides to derive deterministic and stochastic models. We use these models to ask, firstly, what conditions favour the evolution of generalist parasite genotypes versus specialist parasite genotypes? Secondly, can parasite genotypes coexist in a population? We find that intragenomic interactions between parasite loci encoding antigenic peptides are pivotal in determining the outcome of evolution. Where parasite loci interact synergistically (i.e. the recognition of additional antigenic peptides has a disproportionately large effect on parasite fitness), generalist parasite genotypes are favoured. Where parasite loci act multiplicatively (have independent effects on fitness) or antagonistically (have diminishing effects on parasite fitness), specialist parasite genotypes are favoured. A key finding is that polymorphism is not stable and that, with respect to functionally important antigenic peptides, parasite populations are dominated by a single genotype.
Keywords: major histocompatibility complex, agretopes, antigenic peptides, antagony, synergy, strain evolution
1. Introduction
Models of the relationship between hosts and parasites have been a major driver of evolutionary theory, especially, for example, to explain the evolution of sex and sexual selection in host populations (Jaenike 1978). It is well established theoretically that dynamic coevolution may maintain genetic diversity in both host and parasite populations (Anderson & May 1982). In particular, there is considerable interest in the selective force that hosts exert on parasites (Anderson & May 1982). Understanding the processes that shape genetic diversity in parasite populations is important, because it is likely to have consequences for the spread of parasites through host populations (Curtis et al. 2002; Springbett et al. 2003; Grenfell et al. 2004), the mortality and morbidity that they cause (Baumler et al. 2000), the design of effective vaccines (Yates and Mumford 2000) and drug treatments (Mackinnon & Hastings 1998) and the prediction of the evolutionary response of a parasite population to these drugs and vaccines (Anderson 1998).
The dynamic coevolution between hosts and parasites is often predicated on specificity between host and parasite genotypes; that is, in the resistance of host genotypes to particular parasite genotypes and the infectivity of parasite genotypes for particular host genotypes (Haldane 1949). A key question is, given a genetically heterogeneous host population, how will a parasite adapt? When might a parasite population evolve to consist of a single genotype that is able to infect all hosts with moderate efficiency (i.e. to be a generalist)? Conversely, when will a parasite population evolve to consist of one or more specialist genotypes that are able to infect some hosts with high efficiency but others at low efficiency? Understanding the processes that lead to these two alternatives (among other possible outcomes) is crucial to our understanding of strain structure within parasite populations. There are a number of extrinsic and intrinsic factors that are likely to impinge on parasite strain structure. Here, we examine how the host–parasite recognition systems may drive parasite evolution. In order to impose as few external assumptions as possible on the factors driving parasite adaptation and genetic diversity, we will examine this question based on a simple but realistic mechanistic model of the well-characterized molecular recognition of parasite-derived peptides by the vertebrate immune system.
On the surface of all nucleated cells in higher vertebrates, we find transmembrane proteins encoded by genes of the major histocompatibility complex (MHC). MHC molecules bind short (8–17 mer) peptides, which are derived from either endogenous or exogenous proteins that have been degraded, processed and loaded on to the antigen presentation site (APS) of the MHC. The MHC–peptide complex is then transported to the cell surface to allow presentation to circulating lymphocytes, which have the capacity to recognize specific MHC–peptide complexes. Where these peptides are foreign (i.e. of parasite origin), an immune response is initiated that is directed specifically at parasites, or at parasite infected cells, to clear the host of infection. Crucially, this recognition system exhibits extensive genetic diversity within a host population. Several MHC loci have more than 100 alleles in humans, with the majority of coding substitutions occurring within the APS. Each MHC allele has distinct binding requirements for the amino acids at the anchor residues (agretopes), and hence a limitation to the range of potential antigenic peptides it is capable of binding.
We use this molecular recognition system as the basis for deterministic and stochastic models of parasite adaptation and diversity in response to host genetic heterogeneity at the MHC. Focusing especially on the emergence of specialist and generalist infection strategies, we examine the importance of parasite genome size (the number of parasite loci presented by the MHC), the number of MHC alleles present within a host population and the nature of epistasis between parasite loci.
2. Modelling
A simple deterministic model is derived to describe the dynamics of a host–parasite system with genetic heterogeneity in host immune recognition loci and parasite antigenic loci. The host is described by its diploid genotype, where an A1A1 is a host homozygous for immune recognition allele A at locus 1. The host can be infected by a directly transmitted parasite bearing antigens determined by its haploid multi-locus genome. Each parasite allele is defined by: (i) its agretope, reflecting its ability to bind to the MHC variant encoded by a particular host allele and (ii) the loci at which it is found. For example, parasite alleles a1 and a2 are found at loci 1 and 2, respectively, but the immuno-dominant antigenic peptides produced by both alleles share similar anchor residues (agretopes) such that they are presented by the same MHC molecule, coded by host allele, A (summarized in figure 1). We assume that naive hosts have a T-cell repertoire capable of recognizing all MHC–agretope complexes. We assume the effects of antagonistic pleiotropy prevent the complete loss of recognizable peptides from the parasite; this also restricts the inclusion of new alleles resulting in a system with the same number of host alleles as parasite agretopes. This model is analogous to an inverse matching allele model (Agrawal & Lively 2002) with the distinction that alleles at multiple parasite loci can be recognized by a single host locus.
Figure 1.
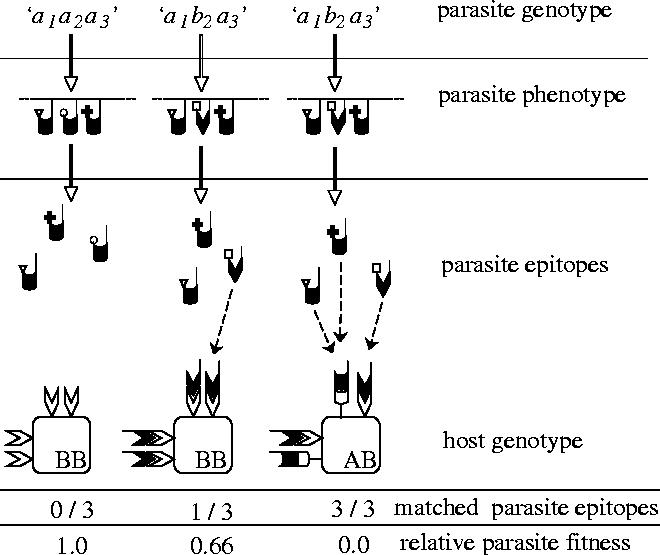
Schematic of host–parasite genetic interaction. Three possible interactions between a single-locus diploid host and a three-locus haploid parasite are shown. In the first case, the parasite has a homogeneous genotype and produces three antigens bearing the same agretope, none of which are recognized by the homozygous host, resulting in maximal fitness for the parasite genotype in that host genotype. The second case shows a heterogeneous parasite genotype interacting with the same homozygous host. In this instance, the parasite has two antigens bearing the same agretope and a further one with a different agretope. In this case, the third agretope is recognized by a host molecule, resulting in reduced fitness for the heterogeneous parasite in the homozygous host. The final case shows the same heterogeneous parasite in a heterozygous host. Here, although two different agretopes are expressed, the heterozygous host is able to recognize both agretopes, resulting in minimal fitness for the heterogeneous parasite in the heterozygous host.
Initiation of the host immune response is triggered by the recognition of an agretope by the host and affects parasite load (infectivity), but not the duration of infection. We ignore within-host parasite dynamics and assume that infectivity is constant throughout the course of infection. It is assumed that, for a primary infection or in the absence of memory, the functional effects of recognition on parasite fitness do not depend on which parasite locus is recognized, only on the number of loci recognized; that is, on the number of parasite loci that exhibit an agretope able to be recognized by an MHC molecule within the host. Thus, where the number of loci recognized is high, parasite growth is reduced and transmission rates from the host are lowered.
The elements of the host–parasite genetic interaction can be incorporated into a simple susceptible–infectious–susceptible (SIS) infection model with no host dynamics (Anderson & May 1991; Foley et al. 1999) as outlined in figure 2a. For a system with H host and P parasite genotypes, the change in numbers of susceptible hosts of genotype m, Sm, is given by
| 2.1 |
The dynamics of infected hosts, I, of each genotype, m, infected by each parasite genotype, j is given by
| 2.2 |
The parameter βph represents the parasite transmission rate from a host of genotype h infected with parasite genotype p and is related to the number of parasite alleles that are ‘matched’ by a host allele. α is the rate at which infected hosts recover and corresponds to an infectious period of 1/α. Figure 2b shows the match matrix between a bi-allelic single locus host and a two-locus parasite with two possible antigenic types. Maximal parasite fitness occurs when no parasite antigens are recognized by the host (i.e. match=0). Conversely, minimal parasite fitness occurs where both parasite antigens are recognized (match=1). From this matrix, we can see that homogeneous parasites are specialists in that they have maximal fitness in only one host genotype and minimal fitness in the other two genotypes. In contrast, the heterogeneous parasites can be described as generalists since both heterogeneous genotypes (a1b2 and b1a2) have minimal fitness in the heterozygous host (AB) but intermediate fitness in both homozygous hosts (AA and BB).
Figure 2.

(a) Schematic of the model. This simple example shows two possible host genotypes (1 and 2) infected with one of two possible parasite genotypes (designated A and B). The degree of transmission from an infected host to a susceptible one is dependent on a ‘match’ parameter determined by the interaction of the infected host genotype and that of the infecting parasite. (b) Table showing the match parameter generated between the three genotypes of a single locus diploid host with two alleles and the four genotypes of a two-locus haploid parasite with two alleles, where the match parameter is generated as the proportion of parasite alleles recognized by a host allele where A recognizes a, and so on. (c) Graph showing possible relationships between parasite genotype relative fitness and match parameter. Under the null interaction, multiplicative model (solid line), each additional parasite allele recognized has the same deleterious affect on parasite fitness. The dotted line represents negative epistasis (synergy) where each additionally recognized allele has an increasingly negative effect on fitness. Under positive epistasis (antagony), a single recognized allele has a disproportionate negative effect on fitness (dashed line) but additionally recognized alleles have a diminishing affect on the reduction in fitness.
The relationship between the number of agretopes (parasite antigens) matched and parasite genotype fitness (reflected in the β term) can be of several forms. If each additional agretope recognized has an equivalent effect on fitness (i.e. they are independent of each other), then the total fitness of a parasite genotype is equal to the product of the fitness reduction caused by each recognized agretope; henceforth, this will be referred to as the ‘multiplicative model’ (Burch et al. 2003). However, the effects of having additional recognized agretopes may not be independent. Under synergy (negative epistasis), each additional recognized agretope causes a disproportionately large reduction in fitness; conversely, under antagony (positive epistasis), additionally recognized agretopes have a diminishing effect on fitness reduction. The shape of the relationship between fitness (Wi) and number of agretopes recognized (i) can be described by the following equation
| 2.3 |
The parameters ϕ and λ govern the shape and sign of the interaction; λ determines the sign of epistasis indicating synergy when positive (λ>0) and antagony when negative (λ<0), and, for a negative relationship between fitness and the number of agretopes recognized, ϕ>0. The shape of the possible relationships between the number of recognized peptides and β, representing parasite genotype fitness is illustrated in figure 2c; ϕ and λ values were chosen to ensure maximal and minimal fitness values were equivalent for all epistasis models and that the strength of both negative and positive epistasis were broadly comparable.
Our aim is to develop a very general model to act as a baseline from which to make comparisons to more specific situations. To achieve this end, we made additional assumptions for the purposes of this paper; there is no co- or super-infection, infection is sub-lethal and does not affect the dynamics of the host population and, most significantly, there is no immune memory. We aim to include factors such as complex transmission routes, within host dynamics, pathogen virulence, immune memory and epidemiological dynamics once we have developed the present baseline theory. Nevertheless, the model presented here is applicable to a range of infectious pathogens, such as those for which a single exposure is insufficient to confer immunity to reinfection in a host.
The model was initially solved deterministically using a numerical solver (Matlab) for the three different epistasis rules and assuming no mutation, a large (2000) fixed-host population and a duration of infection of 10 ‘days’ irrespective of host or parasite genotype. The model was initially solved over 2000 days equating to approximately 200 parasite generations. Host alleles were present in the host population in equal frequencies resulting in Hardy–Weinberg genotype frequencies. Parasite alleles were present in equal frequencies at each loci and across the genome. Initially, 500 representative hosts, whose genotype frequencies reflected those in the total population, were infected. Each host was infected with a single-parasite genotype such that each parasite genotype was represented in each host genotype in proportion to the frequency of occurrence of that parasite genotype.
An individually based stochastic model of the same system was also created. Host genotypes were generated by choosing two random alleles at each loci. From these hosts, 500 randomly selected hosts were infected with a parasite whose genotype was determined by selecting an allele at random for each parasite loci. In order to reduce synchrony in infection dynamics, each infected host was randomly assigned an ‘age’ of infection between 0 and 9 days, the maximum duration of infection. The model was iterated over 2000 time-steps. Complete random mixing of hosts was assumed such that during each time period, every host encountered every other host; parasite transmission occurred with a probability dependent on the fitness of the parasite in the donor host, determined as described above and only occurred from an infected to a non-infected host. At each time period, the age of current infections was incremented and those with an age greater than 9 days were assumed to be recovered and susceptible once again. At each transmission event, there is a probability, m, that a parasite allele undergoes mutation to an alternative allele. Each loci has the same value of m.
3. Results
The behaviour of both deterministic (black lines) and stochastic (coloured lines) models are shown in figure 3 under the different assumptions of epistatic interaction. For each case, the top panel shows the dynamics of hosts infected with heterogeneous genotypes (ab and ba) over time, while the bottom two panels show the numbers of hosts infected with each homogeneous genotype (aa and bb).
Figure 3.

Behaviour of deterministic and stochastic individual based models over time under different models of epistasis. The total number of hosts infected with heterogeneous parasite genotypes (ab and ba) are shown in (a–c), while (d–i) shows the number of hosts infected with homogeneous genotypes aa and bb, respectively. Each subplot shows: the deterministic solution (heavy black line); five simulations of the IBM (blue and red diamonds for heterogeneous and homogeneous genotypes, respectively); and the mean of those simulations (heavy blue and red lines, respectively). Parameter values: β/Wi=9.5×10−5; ϕant=0.7; λant=−0.17; ϕmulti=0.346; λmulti=0; ϕsyn=0.05; λsyn=0.14.
Under the synergistic model (figure 3; left hand panels), heterogeneous parasite genotypes dominate host infections to the exclusion of homogeneous parasite genotypes. In contrast, when parasite loci interact antagonistically or not at all (figure 3; central and right hand panels), homogenous parasite genotypes out-compete heterogeneous ones. This is true for the deterministic model (solid black line) and for the mean over 100 simulations of the stochastic model (heavy red and blue lines). Note, however, that the deterministic model, when compared with the stochastic model, underestimates both the total number of hosts infected with each parasite genotype and the eradication time of unfavoured genotypes. Most significantly, however, it becomes evident that, when the results of single stochastic simulations under multiplicity or antagony are considered (figure 3), one of the two favoured generalist genotypes is able to exclude the other; this contrasts to the deterministic model that predicts coexistence of both generalist genotypes.
Figure 4 shows the frequency of each genotype group after 3000 time-steps for different levels of parasite genotype complexity and under different epistatic assumptions. The outcome of the simple two-locus, two-allele model is shown in the top row under synergy, multiplicity and antagony, respectively. The middle row shows the effect of increasing the number of parasite loci involved while maintaining the number of possible alleles at each locus. The effect of increasing the number of possible alleles at each locus for a two-locus parasite genotype is shown in the bottom row.
Figure 4.

Frequency of parasite genotypes after 300 parasite generations under different epistasis models and for different genotype complexities. The frequency of different parasite genotypes are shown for a random sample of 20 simulations (ordered by frequency of a agretope) for: (a–c) a two-parasite loci and a two-aregetopes/host alleles system; (d–f) a six-parasite loci and a two-agretopes system; and (g–i) a two-parasite loci and a six-agretopes system. For each system, results are shown under synergy, multiplicity and antagony. Presence of a genotype is marked by a filled circle whose colour is determined by the variety of agretopes expressed on a scale from red (homogeneous) to blue (heterogeneous), while absence of that genotype is indicated by a coloured dot. Parameter values for (a–c) and (g–i): β/Wi=9.5×10−5; ϕant=0.7; λant=−0.17; ϕmulti=0.346; λmulti=0.0; ϕsyn=0.05; λsyn=0.14. Parameters for (g–i): β/Wi=9.5×10−5; ϕant=0.23; λant=−0.019; ϕmulti=0.1155; λmulti=0; ϕsyn=0.0125; λsyn=0.017.
In both cases, the general pattern seen in the simple model is maintained. Parasites with longer genomes (figure 4d–f) or more antigenic diversity (figure 4g–i) show the same behaviour in the face of host heterogeneity as the simple genotypes (figure 4a–c). Under negative epistasis, generalist parasites (blue circles) dominate, while under neutral and positive epistasis, there is a tendency for specialist parasites (red circles) to dominate.
As might be expected, altering host allele frequencies in both the deterministic and stochastic individual-based model strongly favoured parasite genotypes bearing agretopes recognized by the rarer host alleles (results not shown). In a bi-allelic system, this resulted in a homogeneous, specialist parasite genome being selected under all conditions of epistasis. In systems with more alleles or larger parasite genomes, however, generalist parasite genotypes were again favoured under synergistic interactions, although they were biased towards genotypes bearing the less frequently recognized agretope.
4. Discussion
We have presented a novel approach that investigates the impact of host heterogeneity on parasite genetic structure. Starting from a mechanistic model of the genetic interaction between host MHC molecules and parasite peptides, we simulated the outcome of epidemics of diverse parasite genotypes in genetically heterogeneous host populations. Homogeneous parasite genotypes were specialists, performing very well in some host genotypes but very poorly in the majority. In contrast, the more heterogeneous parasite genomes reflected a generalist strategy, being able to infect a wider range of host genotypes but with an intermediate efficiency. The model allowed flexibility in the size of parasite genome, the number of host MHC alleles and the nature of interactions between parasite loci. Initial analysis using a deterministic model showed that the sign and strength of epistasis had a key impact on the outcome of the model. Further analysis with a stochastic model demonstrated that these processes could be strongly affected by demographic stochasticity, which greatly reduced the probability of coexistence of different parasite genotypes.
The model clearly showed the tendency of a single-parasite genotype to dominate in any host population. The successful genotype was primarily determined by the sign of epistatic interactions acting on the parasite loci; strong synergistic interactions favoured generalist genotypes while multiplicative and antagonistic interactions favoured specialists. Which of the favoured genotypes then dominated was a result of random demographic events and depended heavily on the chance of being in an optimal host genotype early in the epidemic resulting in high initial transmission. These results were insensitive to including more alleles in the host population or increased parasite genome sizes (figure 4). In the latter case, the spectrum of degree of specialization in parasite genotype conferred by the longer genome allowed theoretically sub-optimal genotypes to dominate as the fitness difference between optimal and less optimal genotypes was reduced.
Our results compare with those of Regoes et al. (2000), who linked convex trade-offs between virulence in two hosts to the favouring of specialist parasite strains. However, in contrast to their results, we found generalist strains being favoured only with a concave relationship between recognition and fitness; neutral, multiplicative relationships also favoured specialist strains in our model. The key development in the model presented here was that our results were obtained without fixing a trade-off explicitly, but rather by including a biologically realistic mechanism through which such trade-offs might arise.
Theory suggests parasites will evolve to express as narrow an array of antigens as possible to evade common host MHC genotypes (Nuismer & Otto 2004). Our results support this with specialist, highly efficient parasite genotypes, expressing identical agretopes, being favoured in most conditions. However, we identify an exception to this prediction: where parasite loci are interacting under negative epistasis (synergy), broader antigen expression, reflecting greater generality but lower efficiency in infection, may be favoured. For very simple systems, these patterns can be predicted analytically by deriving basic reproductive ratios (Gupta & Galvani 1999); however, as shown above, deterministically derived solutions may be misleading. Further, such analyses become exponentially more complex with larger systems.
A key result of the model is that the sign and strength of epistatic interactions in the parasite loci has a profound effect on the trajectory of parasite adaptation; that is, that synergistic interactions lead to generalist parasite genotypes, and that multiplicative and antagonistic interactions lead to specialist genotypes. Which type of epistatic interaction is likely to predominate in parasite genomes? A priori, the smaller genome and simpler structure of viruses suggests that they should have less genetic redundancy (i.e. be more vulnerable to mutations) than more complex organisms such as bacteria. A single mutation in a viral genome will probably cause a significant loss of fitness owing to the small size of its genome, but, after the initial loss of functionality, further mutations may then have a comparatively lesser impact on fitness suggesting an antagonistic interaction. In contrast, a single mutation in the more complex genome of a larger organism may have little impact on fitness, as other loci are able to compensate. However, as further mutations accrue, compensatory mechanisms are disrupted and the impact on fitness increases indicating synergistic interactions between loci. Further, it is also possible that the sign of epistatic interactions is not constant in time; such fluctuations in epistasis have been implicated in the maintenance of sexual reproduction in a model of coevolution between parasites and hosts as a consequence of acquired immunity and reinfection (Lythgoe 2000).
The role of epistasis in natural systems is a developing field and there is still a lack of experimental evidence. Measuring epistasis in natural populations is problematic and frequently inconclusive (Lenski et al. 1999; Wilke & Adami 2001; Burch et al. 2003). There are some suggestions that eukaryotes tend to be under weak synergy (Wilke & Adami 2001), and a study in bacteria found both antagonistic and synergistic interactions to be common (Elena & Lenski 1997). Burch et al. (2003) found indications of significant antagonistic epistasis in dengue and respiratory syncytial virus, though no consistent overall tendency was observable in their survey of 14 RNA viruses. More recently, however, Bonhoeffer et al. (2004) found evidence for positive, antagonistic interactions in HIV. Sanjuan et al. (2004) used site-directed mutagenesis to generate pairs of deleterious mutations in vesicular stomatitis ribovirus and found evidence for both antagonistic and synergistic interactions. The significant impact of the sign and strength of epistatic interactions on parasite population structure described in this study highlights the need for more in-depth understanding of these effects in experimental systems; it also indicates a role for models in identifying population level patterns that might arise through epistatic interactions, thus providing more easily measurable indicators for natural systems.
Another key issue is the paucity of studies addressing parasite–host interactions at a genetic level for both interactors, since this greatly hinders identifying the underlying mechanisms that structure and define parasite populations. A major assumption of our model is that different host alleles are able to respond to a different set of parasite epitopes, where this requires genetic information on both the host and parasite genotypes. There are many examples of MHC alleles that specifically confer resistance or susceptibility to known infections (Hill et al. 1992; Carrington et al. 1999; Quinnell et al. 2003); however, only a few studies also provide information on the fate of different parasite genotypes within specific host types (Gilbert et al. 1998; Moore et al. 2002; Gog et al. 2003). Ideally, we need epitope maps for each parasite in each host MHC genotype, coupled with parasite fitness measures in those host genotypes, such as viral titre or viral shedding. Specialist parasite genotypes, favoured under antagony, should be apparent as exhibiting large differences in the numbers of epitopes they present in different host MHC genotypes, which result in large fitness differences between these host genotypes. Generalist parasites, favoured under synergy, should have a similar number of epitopes and similar fitness in different host MHC genotypes. These results have some further applied implications. Vaccination programmes, especially if targeted, may be initially more successful against antagonistically interacting parasites that are highly infectious to only a subsection of the population.
Our results show that recognition systems alone are not sufficient to maintain polymorphism in parasite populations. Instead, one parasite genotype dominates the population to the exclusion of all others. Within a parasite genome, the range of agretopes expressed across multiple loci is determined by the nature of epistatic interactions between loci, with antagony favouring a limited range of agretopes and synergy a broad range of agretopes. This work highlights the fact that simple assumptions about genetic interactions combined with mechanistic models can structure parasite populations in the absence of implicit assumptions about fitness. These considerations must be acknowledged in future experimental design and theory.
Acknowledgments
This work was supported by award F/00025M from the Leverhulme Trust.
References
- Agrawal A, Lively C.M. Infection genetics: gene-for-gene versus matching-alleles models and all points in between. Evol. Ecol. Res. 2002;4:79–90. [Google Scholar]
- Anderson R.M. Complex dynamic behaviours in the interaction between parasite populations and the host's immune system. Int. J. Parasitol. 1998;28:551–566. doi: 10.1016/s0020-7519(97)00207-5. [DOI] [PubMed] [Google Scholar]
- Anderson R.M, May R.M. Coevolution of hosts and parasites. Parasitology. 1982;85:411–426. doi: 10.1017/s0031182000055360. [DOI] [PubMed] [Google Scholar]
- Anderson R.M, May R.M. Oxford University Press; Oxford: 1991. Infectious diseases of humans. [Google Scholar]
- Baumler A.J, Hargis B.M, Tsolis R.M. Tracing the origins of Salmonella outbreaks. Science. 2000;287:50–52. doi: 10.1126/science.287.5450.50. [DOI] [PubMed] [Google Scholar]
- Bonhoeffer S, Chappey C, Parkin N.T, Whitcomb J.M, Petropoulos C.J. Evidence for positive epistasis in HIV-1. Science. 2004;306:1547–1550. doi: 10.1126/science.1101786. [DOI] [PubMed] [Google Scholar]
- Burch C.L, Turner P.E, Hanley K.A. Patterns of epistasis in RNA viruses: a review of the evidence from vaccine design. J. Evol. Biol. 2003;16:1223–1235. doi: 10.1046/j.1420-9101.2003.00632.x. [DOI] [PubMed] [Google Scholar]
- Carrington M, et al. HLA and HIV-1: Heterozygote Advantage and B*35-Cw*04 Disadvantage. Science. 1999;283:1748–1752. doi: 10.1126/science.283.5408.1748. [DOI] [PubMed] [Google Scholar]
- Curtis J, Sorensen R.E, Minchella D.J. Schistosome genetic diversity: the implications of population structure as detected with microsatellite markers. Parasitology. 2002;125(Suppl.):S51–S59. doi: 10.1017/s0031182002002020. [DOI] [PubMed] [Google Scholar]
- Elena S.F, Lenski R.E. Test of synergistic interactions among deleterious mutations in bacteria. Nature. 1997;390:395–398. doi: 10.1038/37108. [DOI] [PubMed] [Google Scholar]
- Foley J.E, Foley P, Pedersen N.C. The persistence of a SIS disease in a metapopulation. J. Appl. Ecol. 1999;36:555–563. [Google Scholar]
- Gilbert S.C, et al. Association of malaria parasite population structure, HLA, and immunological antagonism. Science. 1998;279:1173–1177. doi: 10.1126/science.279.5354.1173. [DOI] [PubMed] [Google Scholar]
- Gog J.R, Rimmelzwaan G.F, Osterhaus A, Grenfell B.T. Population dynamics of rapid fixation in cytotoxic T lymphocyte escape mutants of influenza A. Proc. Natl Acad. Sci. USA. 2003;100:11 143–11 147. doi: 10.1073/pnas.1830296100. [DOI] [PMC free article] [PubMed] [Google Scholar]
- Grenfell B.T, Pybus O.G, Gog J.R, Wood J.L.N, Daly J.M, Mumford J.A, Holmes E.C. Unifying the epidemiological and evolutionary dynamics of pathogens. Science. 2004;303:327–332. doi: 10.1126/science.1090727. [DOI] [PubMed] [Google Scholar]
- Gupta S, Galvani A. The effects of host heterogeneity on pathogen population structure. Phil. Trans. R. Soc. B. 1999;354:711–719. doi: 10.1098/rstb.1999.0424. 10.1098/rstb.1999.0424 [DOI] [PMC free article] [PubMed] [Google Scholar]
- Haldane J.B.S. Disease and evolution. Ric. Sci. 1949;19(Suppl. A):168–174. [Google Scholar]
- Hill A.V.S, et al. Molecular analysis of the association of Hla-B53 and resistance to severe malaria. Nature. 1992;360:434–439. doi: 10.1038/360434a0. [DOI] [PubMed] [Google Scholar]
- Jaenike J. An hypothesis to account for the maintenance of sex within populations. Evol. Theor. 1978;3:191–194. [Google Scholar]
- Lenski R.E, Ofria C, Collier T.C, Adami C. Genome complexity, robustness and genetic interactions in digital organisms. Nature. 1999;400:661–664. doi: 10.1038/23245. [DOI] [PubMed] [Google Scholar]
- Lythgoe K.A. The coevolution of parasites with host-acquired immunity and the evolution of sex. Evolution. 2000;54:1142–1156. doi: 10.1111/j.0014-3820.2000.tb00550.x. [DOI] [PubMed] [Google Scholar]
- Mackinnon M.J, Hastings I.M. The evolution of multiple drug resistance in malaria parasites. Trans. R. Soc. Trop. Med. Hyg. 1998;92:188–195. doi: 10.1016/s0035-9203(98)90745-3. [DOI] [PubMed] [Google Scholar]
- Moore C.B, John M, James I.R, Christiansen F.T, Witt C.S, Mallal S.A. Evidence of HIV-1 adaptation to HLA-restricted immune responses at a population level. Science. 2002;296:1439–1443. doi: 10.1126/science.1069660. [DOI] [PubMed] [Google Scholar]
- Nuismer S.L, Otto S.P. Host–parasite interactions and the evolution of ploidy. Proc. Natl Acad. Sci. USA. 2004;101:11 036–11 039. doi: 10.1073/pnas.0403151101. [DOI] [PMC free article] [PubMed] [Google Scholar]
- Quinnell R.J. Susceptibility to visceral leishmaniasis in the domestic dog is associated with MHC class II polymorphism. Immunogenetics. 2003;55:23–28. doi: 10.1007/s00251-003-0545-1. [DOI] [PubMed] [Google Scholar]
- Regoes R.R, Nowak M.A, Bonhoeffer S. Evolution of virulence in a heterogeneous host population. Evolution. 2000;54:64–71. doi: 10.1111/j.0014-3820.2000.tb00008.x. [DOI] [PubMed] [Google Scholar]
- Sanjuan R, Moya A, Elena S.F. The contribution of epistasis to the architecture of fitness in an RNA virus. Proc. Natl Acad. Sci. USA. 2004;101:15 376–15 379. doi: 10.1073/pnas.0404125101. [DOI] [PMC free article] [PubMed] [Google Scholar]
- Springbett A.J, MacKenzie K, Woolliams J.A, Bishop S.C. The contribution of genetic diversity to the spread of infectious diseases in livestock populations. Genetics. 2003;165:1465–1474. doi: 10.1093/genetics/165.3.1465. [DOI] [PMC free article] [PubMed] [Google Scholar]
- Wilke C.O, Adami C. Interaction between directional epistasis and average mutational effects. Proc. R. Soc. B. 2001;268:1469–1474. doi: 10.1098/rspb.2001.1690. 10.1098/rspb.2001.1690 [DOI] [PMC free article] [PubMed] [Google Scholar]
- Yates P, Mumford J.A. Equine influenza vaccine efficacy: the significance of antigenic variation. Vet. Microbiol. 2000;74:173–177. doi: 10.1016/s0378-1135(00)00177-2. [DOI] [PubMed] [Google Scholar]