

Abstract
Northern voles and lemmings are famous for their spectacular multiannual population cycles with high amplitudes. Such cyclic vole populations in Scandinavia have shown an unexpected and marked long-term decline in density since the early 1970s, particularly with a marked shift to lower spring densities in the early 1980s. The vole decline, mainly characterized by a strongly decreased rate of change in numbers over winter, is associated with an increased occurrence of mild and wet winters brought about by a recent change in the North Atlantic Oscillation. This has led to a decrease in winter stability and has shortened the period with protective snow cover, the latter considered as an important prerequisite for the occurrence of multiannual, high-amplitude cycles in vole populations. Although the vole decline is predicted to be negative for predators' reproduction and abundance, empirical data showing this are rare. Here we show that the dynamics of a predator–prey system (Tengmalm's owl, Aegolius funereus, and voles), have in recent years gradually changed from 3–4 yr, high-amplitude cycles towards more or less annual fluctuations only.
Keywords: predator–prey cycles, phase diagrams, North Atlantic Oscillation change, long-term decline, changing dynamics
1. Introduction
In Scandinavia, the density of northern vole populations displays multiannual (often 3–4 yr) cycles, whereas the southernmost ones are non-cyclic, showing only seasonal fluctuations (Hansson & Henttonen 1985). This gradient in cyclicity has been ascribed mainly to a gradual increase in snow cover from south to north (Hansson & Henttonen 1985). Despite intense research, the mechanisms causing these multiannual cycles remain unclear (Stenseth 1999). However, predation is currently frequently advocated as the favourite explanation (Hanski & Henttonen 1996; Hanski et al. 2001; Gilg et al. 2003), although the generality of its applicability to different vole and lemming populations has to be examined (Hudson & Bjørnstad 2003), and it should also be noted that the possible role of disease has so far been poorly explored (Hansson & Henttonen 1988; Stenseth 1999; Niklasson et al. 2003; Cavanagh et al. 2004; Hörnfeldt 2004).
In addition to the cycles in northern Scandinavia, there has been a long-term decline in the density of different vole populations in this area (Hörnfeldt 1994; Hanski & Henttonen 1996; Hansen et al. 1999). Thanks to the early establishment of the Swedish National Environmental Monitoring Programme, we now have data from one of the longest and geographically most extensive vole monitoring programmes, from boreal Sweden in northern Scandinavia (Hörnfeldt 1994, 2004). An analysis of these long-term population density data from 1971–2003 was recently undertaken to highlight important characteristics of the current long-term decline of the sympatric voles Clethrionomys glareolus, Clethrionomys rufocanus and Microtus agrestis (Hörnfeldt 2004). One of the most striking features of the decline was a decrease in rate of change in numbers over winter (hereafter termed wintering success) for all species, from the 1970s and onwards. Since the mid-1980s, the winter decrease in density in the second year of cycles more or less neutralized or even overrode the density increase in the preceding summer reproductive season (the cycle being defined as starting in the spring of the year with the highest rate of increase in the subsequent summer; Hörnfeldt 1994, 2004). The build-up of typical 3–4 yr, high-amplitude cycles in two large annual steps in the 1970s was usually then replaced by a build-up in one smaller annual step, leading to low-amplitude cycles, which in the most recent years has approached seasonal density variations only (Hörnfeldt 2004). Because of the larger winter declines, the long-term decline in vole numbers is most evident for spring densities, with a major shift from higher densities in the 1970s, to lower, but still decreasing, densities in the 1980s and onwards (Hörnfeldt 2004 and figure 1a,c).
Figure 1.
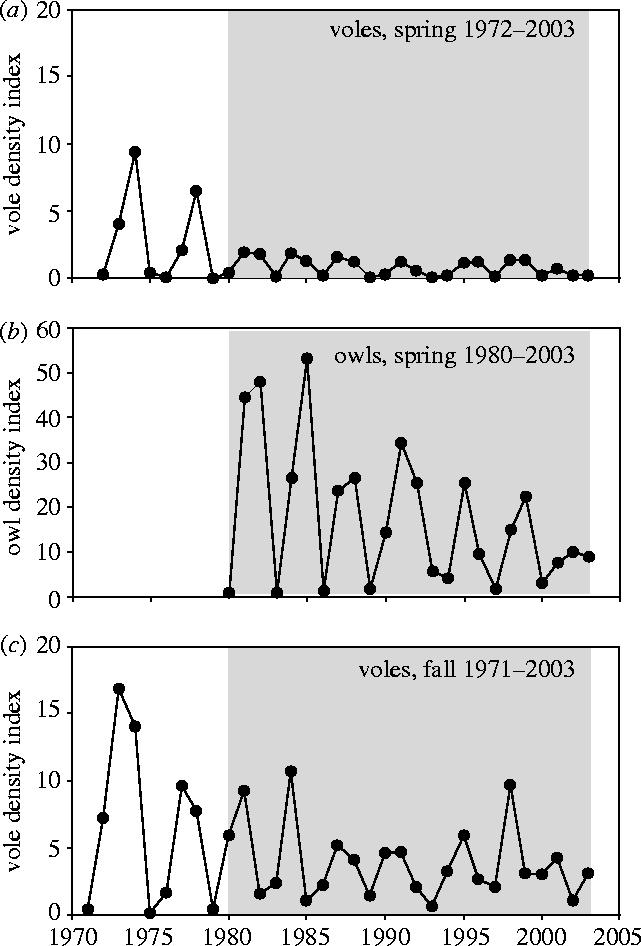
Vole density index, expressed as number of trapped individuals per 100 trap-nights, for pooled numbers of Clethrionomys glareolus, C. rufocanus and Microtus agrestis in (a) spring 1972–2003 and (c) autumn 1971–2003, and (b) owl density index, expressed as proportion (%) of nest boxes with breeding attempts by Tengmalm's owls (Aegolius funereus), in spring 1980–2003.
The decrease in the voles' wintering success has coincided with a change in the climate moderating phenomenon, the North Atlantic Oscillation (NAO). In Scandinavia, positive NAO-index values are associated with mild and wet winters, and negative values with cold and dry winters (Hurrell 1995, 2002), although precipitation effects vary within the area (Uvo 2003). Since the early 1980s there has been a lengthy period dominated by high positive NAO-index values, possibly influenced by effects of global warming (Hurrell 1995, 2002; Hurrell et al. 2001). As a consequence of this extreme positive NAO-index phase, there has been a clear rise in winter temperature in this part of Scandinavia since the late 1980s (Alexandersson 2002). Thus, winters have become less stable, with a shorter period with protective snow cover, causing more frequent thaws and freezing periods leading to formation of icebark on the ground (Hörnfeldt 2004; see also Angerbjörn et al. 2001). These conditions have recently been experimentally shown to be detrimental to vole survival during winter (Aars & Ims 2002). Although the detailed mechanisms of the decrease in vole wintering success demand further research (Aars & Ims 2002; Hörnfeldt 2004), the poorer wintering success and long-term decline in vole numbers have clearly coincided with the NAO-driven increase in winter temperatures in recent years.
An important implication of the decline in vole population densities in spring is the likely negative effects on the reproduction and abundance of several specialist predators (Strann et al. 2002; Hörnfeldt 2004). However, very little detailed knowledge is available on this, owing to the infrequency of parallel and quantitative long-term monitoring of both vole and predator populations on the breeding grounds in areas with decreasing vole populations (see also Bjørnstad & Grenfell 2001; Hörnfeldt 2004). The present time-series for density of a nest box breeding population of Tengmalm's owl (Aegolius funereus), a nomadic vole specialist, in 1980–2003 in the current vole monitoring area represents one of the few exceptions (Löfgren et al. 1986; Hörnfeldt et al. 1990; Hipkiss et al. 2002a,b). Two of the vole species, C. glareolus and M. agrestis, are the staple food supply and make up nearly 85% of the breeding season diet and strongly affect the breeding success of this owl (Hörnfeldt et al. 1990; Hipkiss et al. 2002a). We previously found that in the two first 3–4 yr, high-amplitude cycles in 1980–86, the owl density index was strongly correlated with the supply of these voles in the previous autumn, but not with that in the current spring. On the other hand, clutch size and number of fledglings per nest were correlated with the vole supply in spring (Hörnfeldt et al. 1990). The aim of this report is to analyse the long-term changes in the owl's population density and the predator–prey dynamics of owls and voles along with decline in the vole populations.
2. Material and methods
(a) Vole monitoring
Voles were snap-trapped in 58 regularly distributed 1 ha plots in a range of habitats in a 100×100 km2 area (approx. 64°N, 20°E), for three consecutive nights in spring and autumn. Fifty traps per plot were used, corresponding to 150 trap-nights per plot, and on average 8475 trap-nights per sampling period, totalling more than 530 000 trap-nights in 1971–2003. This running survey is carried out within the Swedish Environmental Protection Agency's National Environmental Monitoring Programme1 (see also Hörnfeldt 1994, 2004, 2005).
(b) Owl monitoring
Nest boxes (range: 200–500) suitable for breeding Tengmalm's owls were regularly checked for occupant owls between March and June, within the same area where voles were trapped (approx. 64°N, 20°E). A breeding attempt was defined as the laying of greater than or equal to one egg. An owl breeding density index was expressed as percentage nest boxes with breeding attempts. See also Löfgren et al. 1986, Hörnfeldt et al. 1990 and Hipkiss et al. 2002a.
3. Results
A marked decline in the breeding A. funereus population, by about 75% with respect to peak densities, has gradually occurred from the mid-1980s until the early 2000s (figure 1b), in parallel with the decline in vole population densities in spring and autumn from the mid-1980s and onwards (figure 1a,c). Owl breeding density in 2001 was significantly lower than in 1981 (figure 1b), i.e. at comparable stages of the owl cycle and based on the comparison of occupied versus non-occupied nest boxes (χ12=105.5, p<0.001). For comparison, staple food supply (C. glareolus and M. agrestis) in spring was lower in 2001 than 1981 (t=2.008, p=0.047, n=58; cf. figure 1a), as was food supply in the previous autumn in 2000 compared to 1980 (t=3.128, p=0.002, n=58; cf. figure 1c). Also, low phase densities of the owl appear to have become elevated since the mid 1980s (figure 1b).
A closer look revealed that the owl–vole relationships changed in 1987–2003 compared to 1980–1986. In the earlier period, the owl density index was highly correlated with staple food supply in the previous autumn (rs=0.937, p=0.002, n=7), but less so with food supply in the current spring (rs=0.577, p=0.175, n=7; Hörnfeldt et al. 1990). In contrast, in the later period the correlation of owl density index with staple food supply in the previous autumn was markedly weaker and insignificant (rs=0.459, p=0.064, n=17), while that with food supply in spring was markedly stronger and significant (rs=0.790, p<0.001, n=17), hence opposite to the situation in 1980–86. For the pooled dataset, a stepwise multiple regression of log-transformed owl density indices (logOD, n=24) revealed that, in all, 58% of the variation was explained by staple food supply, C. glareolus and M. agrestis, in the current spring (FSCS; p=0.001) and previous autumn (FSPF; p=0.005) according to the model: logOD=0.252+0.559×FSCS+0.095×FSPF. Autocorrelation and partial autocorrelation (not shown) revealed that remaining residuals contained no significant temporal correlation.
Like the longer vole time-series from 1970s to early 2000s, the owl time-series shows a gradual change in the dynamics from the 1980s to early 2000s, from 3–4 yr, high-amplitude cycles towards a mainly annual density variation only (figure 1b). The temporal relationships between owl density and vole supply in the previous autumn and current spring are also illustrated in the phase diagrams for successive cycles in figure 2. The prevailing phase pattern for the relationship between owl density and vole supply in spring is an anti-clockwise spiralling (except in 1994–1998), consistent with predictions from simple predator–prey models (Begon et al. 1990). In contrast, the patterns for the relationship between owl density and vole supply in the previous autumn spiral in the opposite direction, i.e. clockwise (except in 2000–2003). In both cases, the phase diagrams for 2000–2003 (figure 2g,n) reveal a similar pattern to that discernible from figure 1, i.e. that the dynamics are approaching annual density variation and even lower amplitudes.
Figure 2.

Phase diagrams for owl density index in spring 1980–2003, expressed as proportion (%) of nest boxes with breeding attempts by Tengmalm's owls (Aegolius funereus), in relation to indices of staple food supply (pooled number of trapped individuals per 100 trap-nights of Clethrionomys glareolus and Microtus agrestis), in (a–g) the previous autumn and (h–n) the current spring, for successive cycles as denoted in the upper right corner. Shaded circles denote ends of successive cycles, dashed lines transition to subsequent cycle, and arrowheads direction of change.
4. Discussion
Recent declines of other vole predator populations have also been observed in Sweden. The arctic fox (Alopex lagopus) has declined since around the mid-1980s (Angerbjörn et al. 1995), and autumn counts at a Scandinavian migration bottleneck at Falsterbo, southern Sweden, have declined for the hen harrier (Circus cyaneus) since the late 1970s and for the rough-legged buzzard (Buteo lagopus) since the mid-1980s (Kjellén & Roos 2000). These predator declines have been ascribed to low or declining small rodent populations, although without being backed-up by quantitative estimates of current rodent abundance. One important conclusion from this and the present case is that they highlight the need for long-term time-series, and stress the need for a stable and persistent organization by authorities of long-term monitoring, and we hope that our study will help to encourage the environmental monitoring of biological systems in general.
The present vole–owl case is the first example we know of from cyclic populations that has shown not only such a remarkable long-term decline in density, but also a shift in dynamics from pronounced multiannual, high-amplitude vole–predator cycles towards more or less annual fluctuations only (figures 1 and 2; but see Hanski & Henttonen 1996; Solonen 2004). Our finding of a shift in the relative strength over time of the correlation of owl breeding density with staple food supply in the previous autumn (decreasing) and current spring (increasing) relates to other studies reporting correlations with food supply in the previous autumn and/or current spring (Korpimäki 1994; Solonen 2004) or ensuing fall (Strann et al. 2002). It is reasonable to assume that these different results are related to differences in changes of vole numbers over winter in different time periods and areas (see also Solonen 2004). We believe that the population declines and the seemingly ongoing transition from one dynamic state to another in the same area, also occurring in association with the NAO changes and ensuing elevation of winter temperature, is a key to a deeper understanding of the fluctuations of vole, lemming and predator populations. Our findings suggest a strong capacity for abiotic factors to influence or govern the type of predator–prey dynamics actually realized. They emphasize the need to shift the focus from mainly invoking biotic factors to also include abiotic factors, such as winter conditions, for analysing and understanding the dynamics of this type of predator–prey system (see also Stenseth 1999). The NAO-driven increase in winter temperature in the current case is associated with an effect during the essentially non-reproductive season in winter on wintering success of voles, and subsequently predator population density. As the underlying NAO changes may be affected by global warming (Hurrell et al. 2001), it is reasonable to assume that the current decline in predator and prey densities and the resemblance of a fading out of their coupled predator–prey cycles are indeed early effects of global warming. Let us assume that the decline in numbers and change in vole and predator dynamics from clear 3–4 yr, high-amplitude cycles towards mainly annual density fluctuations are caused by adverse winter conditions during the lengthy period dominated by positive NAO-index values. Then, provided that no other climatic force promotes similar winter instability, it is possible to make a reasonable long-term prediction. A shift back to lasting negative NAO-index values, causing a return to colder winters, would increase vole wintering success and lead back again towards a pronounced 3–4 yr, cyclic dynamics of voles and, as a consequence, of their predators.
Acknowledgments
We thank Sam Erlinge, Lennart Hansson, Rolf Anker Ims, Frank Johansson, Kjell Leonardsson, Bo Niklasson, Åke Norberg, Erik I. Nyholm, Christian Otto, Ingemar Renberg, Sara Sjöstedt-de Luna, Janne Sundell, Staffan Ulfstrand and Nigel G. Yoccoz for constructive and valuable comments on the manuscript. We also greatly appreciate the financial support received by grants from among others Stiftelsen Seth M. Kempes Minne, Olle och Signhild Engkvists Stiftelser and the Swedish Environmental Protection Agency.
Endnote
References
- Aars J, Ims R.A. Intrinsic and climatic determinants of population demography: the winter dynamics of tundra voles. Ecology. 2002;83:3449–3456. [Google Scholar]
- Alexandersson, H. 2002 Temperature and precipitation in Sweden 1860–2002. SMHI meteorological report no. 104. Norrköping, Sweden: SMHI. [In Swedish with English abstract.]
- Angerbjörn A, Tannerfeldt M, Bjärvall A, Ericson M, From J, Norén E. Dynamics of the Arctic fox population in Sweden. Ann. Zool. Fennici. 1995;32:55–68. [Google Scholar]
- Angerbjörn A, Tannerfeldt M, Lundberg H. Geographical and temporal patterns of lemming population dynamics in Fennoscandia. Ecography. 2001;24:298–308. 10.1034/j.1600-0587.2001.240307.x [Google Scholar]
- Begon M, Harper J.L, Townsend C.R. 2nd edn. Blackwell Scientific Publications; Oxford: 1990. Ecology: individuals, populations and communities. [Google Scholar]
- Bjørnstad O.N, Grenfell B.T. Noisy clockwork: time series analysis of population fluctuation in animals. Science. 2001;293:638–643. doi: 10.1126/science.1062226. [DOI] [PubMed] [Google Scholar]
- Cavanagh R.D, Lambin X, Ergon T, Bennett M, Graham I.M, van Sooloingen D, Begon M. Disease dynamics in cyclic populations of field voles (Microtus agrestis): cowpox virus and vole tuberculosis (Mycobacterium microti) Proc. R. Soc. B. 2004;271:859–867. doi: 10.1098/rspb.2003.2667. 10.1098/rspb.2003.2667 [DOI] [PMC free article] [PubMed] [Google Scholar]
- Gilg O, Hanski I, Sittler B. Cyclic dynamics in a simple vertebrate predator–prey community. Science. 2003;302:866–868. doi: 10.1126/science.1087509. 10.1126/science.1087509 [DOI] [PubMed] [Google Scholar]
- Hansen T.F, Stenseth N.C, Henttonen H, Tast J. Interspecific and intraspecific competition as causes of direct and delayed density dependence in a fluctuating vole population. Proc. Natl Acad. Sci. USA. 1999;96:986–991. doi: 10.1073/pnas.96.3.986. 10.1073/pnas.96.3.986 [DOI] [PMC free article] [PubMed] [Google Scholar]
- Hanski I, Henttonen H. Predation on competing rodent species: a simple explanation of complex patterns. J. Anim. Ecol. 1996;65:220–232. [Google Scholar]
- Hanski I, Henttonen H, Korpimäki E, Oksanen L, Turchin P. Small-rodent dynamics and predation. Ecology. 2001;82:1505–1520. [Google Scholar]
- Hansson L, Henttonen H. Gradients in density variations of small rodents: the importance of latitude and snow cover. Oecologia. 1985;67:394–402. doi: 10.1007/BF00384946. 10.1007/BF00384946 [DOI] [PubMed] [Google Scholar]
- Hansson L, Henttonen H. Rodent dynamics as community processes. Trends Ecol. Evol. 1988;3:195–200. doi: 10.1016/0169-5347(88)90006-7. 10.1016/0169-5347(88)90006-7 [DOI] [PubMed] [Google Scholar]
- Hipkiss T, Hörnfeldt B, Eklund U, Berlin S. Year-dependent sex-biased mortality in supplementary-fed Tengmalm's owl nestlings. J. Anim. Ecol. 2002a;71:693–699. [Google Scholar]
- Hipkiss T, Hörnfeldt B, Lundmark Å, Norbäck M, Ellegren H. Sex ratio and age structure of nomadic Tengmalm's owls: a molecular approach. J. Avian Biol. 2002b;33:107–110. 10.1034/j.1600-048X.2002.330118.x [Google Scholar]
- Hörnfeldt B. Delayed density dependence as a determinant of vole cycles. Ecology. 1994;75:791–806. [Google Scholar]
- Hörnfeldt B. Long-term decline in numbers of cyclic voles in boreal Sweden: analysis and presentation of hypotheses. Oikos. 2004;107:376–392. 10.1111/j.0030-1299.2004.13348.x [Google Scholar]
- Hörnfeldt, B. 2005 Miljöövervakning av smådäggdjur. (http://www.emg.umu.se/personal/lankar/hornfeldt/index3.html)
- Hörnfeldt B, Carlsson B.-G, Löfgren O, Eklund U. Effects of cyclic food supply on breeding performance in Tengmalm's owl (Aegolius funereus) Can. J. Zool. 1990;68:522–530. [Google Scholar]
- Hudson P.J, Bjørnstad O.N. Vole stranglers and lemming cycles. Science. 2003;302:797–798. doi: 10.1126/science.1092366. 10.1126/science.1092366 [DOI] [PubMed] [Google Scholar]
- Hurrell J.W. Decadal trends in the North Atlantic Oscillation: regional temperatures and precipitation. Science. 1995;269:676–679. doi: 10.1126/science.269.5224.676. [DOI] [PubMed] [Google Scholar]
- Hurrell, J. 2002 North Atlantic Oscillation (NAO) indices information. (http://www.cgd.ucar.edu/∼jhurrell/nao.html)
- Hurrell J.W, Kushnir Y, Visbeck M. The North Atlantic Oscillation. Science. 2001;291:603–605. doi: 10.1126/science.1058761. 10.1126/science.1058761 [DOI] [PubMed] [Google Scholar]
- Kjellén N, Roos G. Population trends in Swedish raptors demonstrated by migration counts at Falsterbo, Sweden 1942–97. Bird Study. 2000;47:195–211. [Google Scholar]
- Korpimäki E. Rapid or delayed tracking of multi-annual vole cycles by avian predators? J. Anim. Ecol. 1994;63:619–628. [Google Scholar]
- Löfgren O, Hörnfeldt B, Carlsson B.-G. Site tenacity and nomadism in Tengmalm's owl (Aegolius funereus (L.)) in relation to cyclic food production. Oecologia. 1986;69:321–326. doi: 10.1007/BF00377051. 10.1007/BF00377051 [DOI] [PubMed] [Google Scholar]
- Niklasson B, Hörnfeldt B, Nyholm E, Niedrig M, Donoso-Mantke O, Gelderblom H.R, Lernmark Å. Type1 diabetes in Swedish bank voles (Clethrionomys glareolus): signs of disease in both colonized and wild cyclic populations at peak density. Ann. NY Acad. Sci. 2003;1005:170–175. doi: 10.1196/annals.1288.020. 10.1196/annals.1288.020 [DOI] [PubMed] [Google Scholar]
- Solonen T. Are vole-eating owls affected by mild winters in southern Finland? Ornis Fennica. 2004;81:65–74. [Google Scholar]
- Stenseth N.C. Population cycles in voles and lemmings: density dependence and phase dependence in a stochastic world. Oikos. 1999;87:427–461. [Google Scholar]
- Strann K.-B, Yoccoz N.G, Ims R.A. Is the heart of Fennoscandian rodent cycle still beating? A 14-year study of small mammals and Tengmalm's owls in northern Norway. Ecography. 2002;25:81–87. 10.1034/j.1600-0587.2002.250109.x [Google Scholar]
- Uvo C.B. Analysis and regionalization of northern European winter precipitation based on its relationship with the North Atlantic Oscillation. Int. J. Climatol. 2003;23:1185–1194. [Google Scholar]