

Abstract
OBJECTIVES
Barrett’s esophagus develops in 5–10% of patients with gastroesophageal reflux disease and predisposes to esophageal adenocarcinoma. We have previously shown that a systematic baseline endoscopic biopsy protocol using flow cytometry with histology identifies subsets of patients with Barrett’s esophagus at low and high risk for progression to cancer. In this report, we further examined cytometric variables to better define the characteristics that best enable DNA cytometry to help predict cancer outcome.
METHODS
Patients were prospectively evaluated using a systematic endoscopic biopsy protocol, with baseline histological and flow cytometric measurements as predictors and with cancer as the outcome.
RESULTS
A receiver operating curve analysis demonstrated that a 4N fraction cut point of 6% was optimal to discriminate cancer risk (relative risk [RR] = 11.7, 95% CI = 6.2–22). The 4N fractions of 6–15% were just as predictive of cancer as were fractions of >15%. We found that only aneuploid DNA contents of >2.7N were predictive of cancer (RR = 9.5, CI = 4.9–18), whereas those patients whose sole abnormality was an aneuploid population with DNA content of ≤2.7 had a low risk for progression. The presence of both 4N fraction of >6% and aneuploid DNA content of >2.7N was highly predictive of cancer (RR = 23, CI = 10–50). S phase was a predictor of cancer risk (RR = 2.3, CI = 1.2–4.4) but was not significant when high-grade dysplasia was accounted for.
CONCLUSIONS
Flow cytometry is a useful adjunct to histology in assessing cancer risk in patients with Barrett’s esophagus. Careful examination of cytometric variables revealed a better definition of those parameters that are most closely associated with increased cancer risk.
INTRODUCTION
For the past 2 decades, the incidence of esophageal adenocarcinoma has been increasing rapidly in the United States and many regions of Western Europe (1–4). Unfortunately, most cases of esophageal adenocarcinoma are detected when the cancer is advanced and incurable, and >90% of patients die of their disease (5). Barrett’s esophagus is the only known precursor to esophageal adenocarcinoma; a systematic endoscopic biopsy protocol can detect esophageal adenocarcinomas at an early stage, with 5-yr survival rates of 80–90% or more after esophagectomy (6–8). Thus, endoscopic surveillance is frequently recommended for the early detection of cancer in patients with Barrett’s esophagus (6–9).
However, follow-up and autopsy studies indicate that the vast majority of patients with Barrett’s esophagus do not develop cancer (10, 11). For example, in nine follow-up studies, only 3.6% of nearly 1000 patients with Barrett’s esophagus progressed to cancer (10–18). These observations have led to controversy concerning management of the cancer risk in patients with this condition (19). Some authorities recommend periodic surveillance, whereas others question the value of surveillance in the average patient (10, 17, 19, 20). The low incidence of cancer in patients with Barrett’s esophagus has led to debate concerning optimal surveillance intervals, even among those who support endoscopic biopsy surveillance (10, 11, 17, 19, 20).
We have recently shown that patients who do not have high-grade dysplasia (HGD), aneuploidy, or increased 4N fractions after a baseline four-quadrant endoscopic biopsy protocol are at low risk of progressing to cancer during the subsequent 5 yr (21). Conversely, the presence of HGD, aneuploidy, increased 4N fractions or combinations of these abnormalities identifies subsets of patients who are at increased risk for progression. The presence of DNA aneuploidy or elevated 4N fractions was a strong predictor of increased risk for cancer progression even in patients without high-grade dysplasia. However, there were no significant differences among negative, indefinite, and low-grade dysplasia histological categories with regard to progression to cancer. None of these abnormalities are perfectly predictive, and some patients with HGD, aneuploidy, or increased 4N fractions may remain free of cancer indefinitely. However, these previous analyses were based on a maximal 4N cutoff abnormality at the baseline endoscopy, and more detailed evaluation of cytometric variables was not performed. In addition, prognostic strength of S-phase measurements, a biomarker that is frequently proposed for risk assessment in Barrett’s esophagus (22–26), was not examined. Furthermore, the DNA content of the aneuploid cell populations may have prognostic value, as has been reported for some types of cancer (27, 28). We have also shown previously that some patients who progress to cancer have multiple aneuploid cell populations in the Barrett’s segment (29, 30), and it is also possible that the presence of multiple DNA content abnormalities may be indicative of more advanced clonal evolution and an increased risk for cancer.
The Seattle Barrett’s Esophagus Project has had a prospective endoscopic biopsy surveillance study since 1983. Between July 1, 1983, and June 30, 1998, we evaluated 307 patients who had baseline histological and flow cytometric DNA content and S-phase assessment, as well as at least one follow-up evaluation (21). Here, we report the outcome of these patients based on a detailed examination of the following cytometric variables: DNA content of aneuploid cell populations; number and distribution of DNA content abnormalities; and fraction of S-phase and 4N cells.
MATERIALS AND METHODS
Patients
A total of 322 patients had Barrett’s esophagus, as defined by the presence of specialized columnar metaplasia in esophageal biopsies, and at least one follow-up endoscopy with protocol biopsies as part of the Seattle Barrett’s Study between July 1, 1983, and June 30, 1998 (21). Total patient-years of follow-up in this study were 1338. Patients who had a prior history of esophageal cancer were excluded. As compared to our previous report, the baseline endoscopic evaluation was redefined for this study as the first for which a valid flow cytometric S-phase analysis was available (see DNA Content Flow Cytometry, below), in addition to DNA content flow cytometry and histology. Of the 322 patients, 15 either did not have such a baseline measurement (n = 9) or had not been followed long enough to have a subsequent endoscopic evaluation (n = 6), leaving 307 qualifying patients, 34 with a baseline date that was later than that of the previously reported study (21). The mean follow-up time from baseline to cancer or last endoscopy was 56 months (median 40, range 0.5 to 174). Patients were counseled concerning the risks and benefits of endoscopic biopsy surveillance and were informed of potential alternatives, including surgery for HGD. The Seattle Barrett’s Esophagus Study was approved by the Human Subjects Review Board at the University of Washington in 1982 and renewed annually thereafter, with reciprocity from the Fred Hutchinson Cancer Research Center since 1993.
Endoscopy and Biopsy
Endoscopies were typically performed by one of three endoscopists (D.S.L., P.L.B., B.J.R.) using a large-channel endoscope and jumbo biopsy forceps (31). From 1985 to 1998, four-quadrant biopsy specimens were generally taken at 2-cm levels throughout the Barrett’s segment. After 1992, four-quadrant biopsies were taken at 1-cm levels in patients with a known history of HGD. One biopsy at each level was divided in half for histology and flow cytometry.
Histology
Biopsy specimens were processed and interpreted as described previously (6).
DNA Content Flow Cytometry
Biopsy specimens were processed for flow cytometry as previously described (29). Aggregates were reduced by gating on peak versus area histograms, taking care to not eliminate true 4N cells, as determined from prior historical assessment of cases with large 4N populations. S-phase analysis was performed using MultiCycle software with “sliced nucleus” background correction, but without software aggregate correction. In accordance with published guidelines (32), histograms containing <10,000 events or background aggregates and debris of >20% were not considered adequate for S-phase analysis, requiring evaluation of histograms from the next endoscopy as the baseline measurement (see Patients, above). A trained technician and one of the authors (P.S.R.) interpreted flow cytometric histograms. Disagreements were resolved by joint review of the histogram.
Statistical Analysis
Relative risk (RR) estimates for the association of baseline flow cytometric measures with the subsequent incidence of cancer were obtained from univariable Cox proportional hazards regression models (33). Outcome and censoring times were defined relative to baseline endoscopy. Wald test p values were based on RR estimates from the corresponding models.
The Kaplan-Meier estimator was used for cumulative cancer incidence curves and estimates, with censoring at time of last surveillance endoscopy. Corresponding 95% CI were based on Greenwood SE estimates (33).
Receiver operating characteristic (ROC) curves (34, 35) were used to examine the predictive value of the continuous measures, 4N, and S-phase fractions. An ROC curve is a statistical tool that is sometimes used to describe the accuracy of diagnostic and screening tests when the test measure is continuous. Such curves are constructed by varying the threshold used for defining a positive test and plotting the associated sensitivity (true-positive rate) and 1 − specificity (false-positive rate) values against each other. ROC analyses were restricted to patients with at least 18 months of follow-up unless these patients developed cancer before this time.
In addition to looking at the sensitivity-specificity tradeoffs for 4N and S-phase fractions, the two-sample log-rank test statistic (33) for cancer outcome was calculated and plotted as a function of the threshold used to define a positive test. The log-rank test statistic is based on the difference in the observed and expected number of failures (cancers) within groups, and takes into account variable follow-up times. It is very similar to the test of whether RR = 1 for a group indicator variable in a Cox regression model.
The p values were not corrected for multiple comparisons or the exploratory approach to selecting thresholds for cytometric measures.
RESULTS
Of the 307 patients who met the entry criteria, 42 developed cancer (13.7%) during follow-up. Consistent with the previously reported results (21), HGD, aneuploidy, or increased 4N fractions were detected at the baseline endoscopy in 90% of patients who progressed to cancer (38/42) and in 100% of patients who progressed to cancer within 5 yr (34/34).
ROC and Cut Point Analysis Curves for 4N Fractions
Our previously reported analysis of 4N fractions used a cut point of 6% to define an elevated 4N fraction (21). This was based on earlier studies that showed a correlation of 4N fractions of >6% with histological abnormalities (36). Therefore, it was important to re-evaluate the threshold defining 4N abnormalities based on association with cancer outcome. Figure 1A shows the ROC curve, whereas Figure 1B shows results of a two-sample log-rank test for cancer outcome as a function of 4N cut point. The ROC curve is a common statistical presentation in which for each cut point, sensitivity (true positive rate) is plotted as a function of 1 − specificity (false-positive rate). Perfect sensitivity and specificity would be in the upper left corner of the plot. Both ROC and log-rank analyses are consistent with the interpretation that 6% is the cut point that represents the optimal combination of sensitivity and specificity for detection of cancer risk in this cohort of Barrett’s esophagus patients. ROC and cut point analysis curves were similar when the analysis was restricted to patients without baseline HGD (data not shown). Of the 307 patients in this study, 52 had a 4N fraction of >6% at baseline endoscopy. The cumulative incidence of cancer 3 yr and 5 yr after an elevated 4N was 53% (CI = 38–69) and 57% (CI = 41–74), respectively (Table 1 and Fig. 2A).
Figure 1.
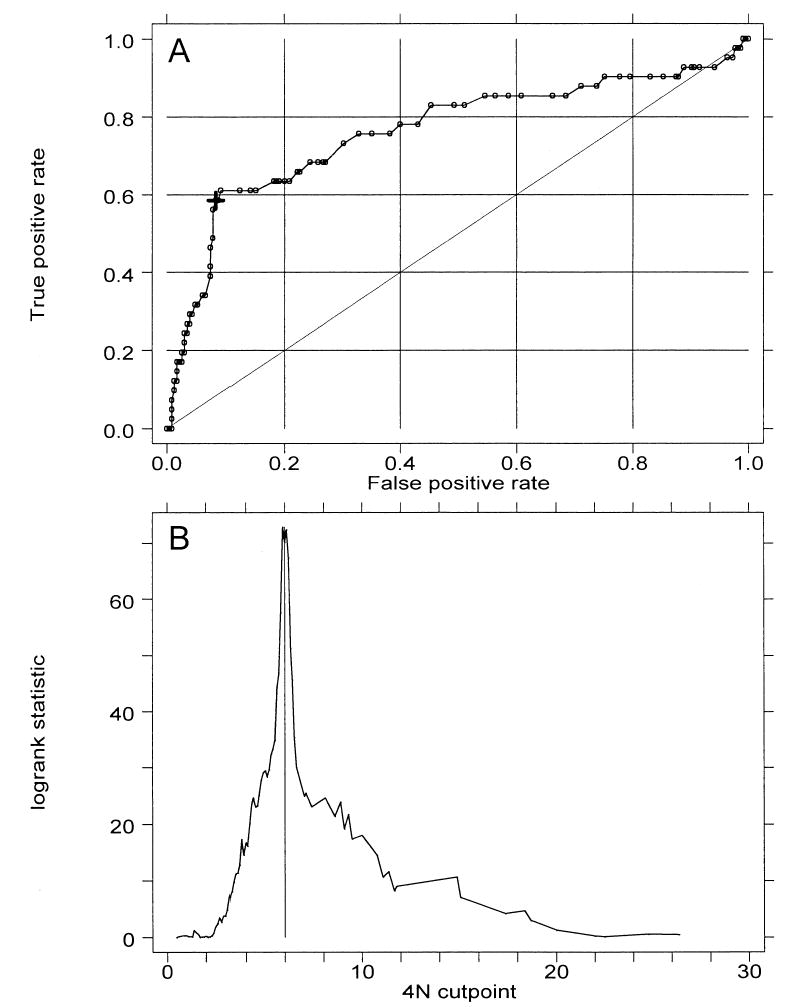
(A) Receiver operating characteristic (ROC) curve for prediction of cancer outcome by 4N fractions. The large cross indicates a cut point of 6%. Area under ROC curve is 0.76. (B) Plot of two-sample log-rank test statistic for cancer outcome as a function of 4N cut point. Vertical line marks maximal χ2 at 6%.
Table 1.
Cancer Cases, Relative Risks, and Cumulative Incidence of Cancer After Baseline Diagnoses (95% CI*)
| Cancer Incidence
|
|||||
|---|---|---|---|---|---|
| Cytometric Measure | n | No. Cancers | RR (95% CI) | 3 yr | 5 yr |
| 4N | |||||
| >6% | 52 | 24 | 12 (6.2, 22) | 53 (37, 69) | 57 (41, 74) |
| >15%† | 13 | 6 | 10 (4.1, 27) | 39 | 39 |
| 6–15%† | 39 | 18 | 12 (6.2, 24) | 56 (39, 75) | 62 |
| ≤6% | 255 | 18 | 4.7 (2.6, 8.7) | 6.5 (3.6, 11.6) | |
| Aneuploid | |||||
| Yes | 45 | 16 | 5.9 (3.1, 11) | 43 (27, 62) | 43 (27, 62) |
| No | 262 | 26 | 7.7 (4.8, 12) | 10 (6.6, 16) | |
| Aneuploid (ploidy > 2.7N) | |||||
| Yes | 34 | 15 | 9.5 (4.9, 18) | 64 | 64 |
| No | 273 | 27 | 7.4 (4.6, 12) | 10 (6.3, 15) | |
| Aneuploid (>2.7N)/4N > 6 | |||||
| +/+ | 23 | 12 | 23 (10, 50) | 75 | 75 |
| +/− | 11 | 3 | 7.9 (2.3, 28) | 46 | 46 |
| −/+ | 29 | 12 | 10 (4.7, 22) | 41 (24, 63) | 48 |
| −/− | 244 | 15 | 3.4 (1.6, 7.0) | 5.2 (2.6, 10) | |
| Either positive | 63 | 27 | 13 (6.7, 25) | 51 (37, 67) | 55 (40, 71) |
| S Phase | |||||
| >5.5% | 164 | 30 | 2.3 (1.2, 4.4) | 17 (12, 25) | 21 (15, 30) |
| ≤5.5% | 143 | 12 | 6.6 (3.3, 13) | 6.6 (3.3, 13) | |
| S Phase | |||||
| >9% | 44 | 9 | 2.0 (.94, 4.1) | 21 (11, 40) | 28 (14, 51) |
| ≤9% | 263 | 33 | 11 (7.3, 16) | 13 (8.6, 18) | |
RR = relative risk.
95% CI provided at times when more than five patients at risk for esophageal adenocarcinoma are still followed.
Reference group is ≤6%.
Figure 2.
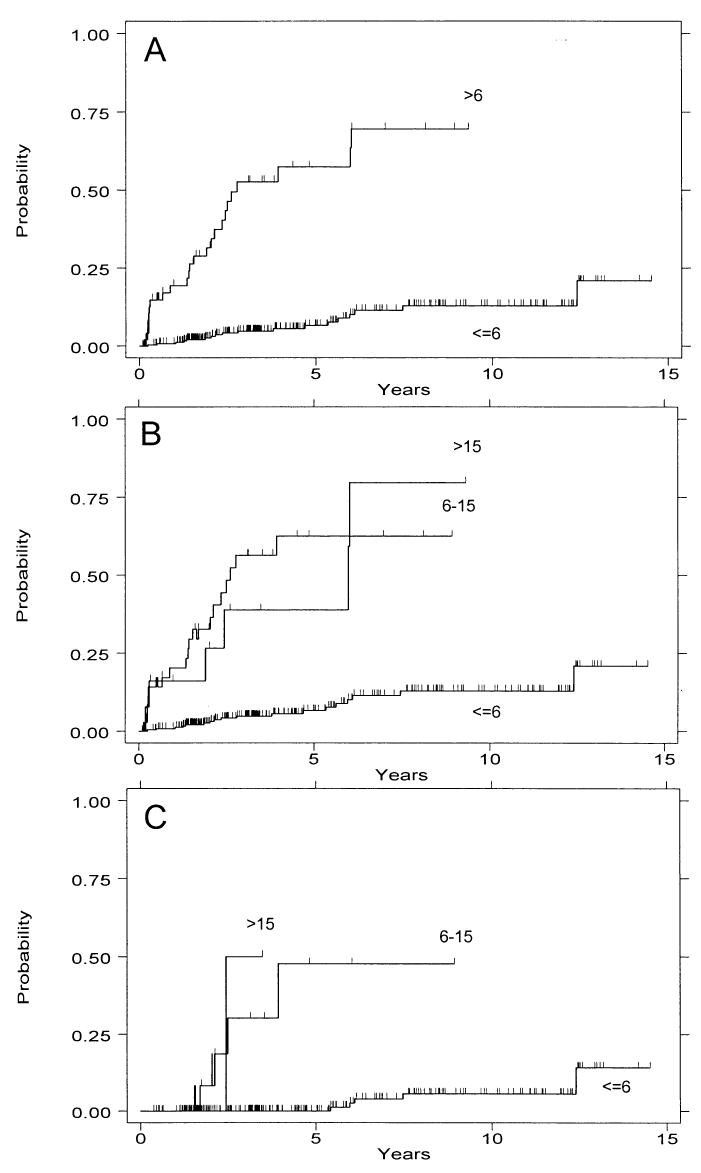
Cumulative incidence of cancer by 4N category. (A) Patients with a 4N fraction of >6% vs <6%. (B) 4N categories of <6% vs 6–15% vs >15%. (C) 4N categories of <6% vs 6–15% vs >15% only in subset of patients without HGD. Note that the number of patients is small in the latter two groups (13 and three).
4N Fractions > 15% and < 15%
Although there is not a single definition of abnormally elevated 4N fractions in the literature, the majority of published studies have used 15% as the cutoff for definition of “tetraploidy,” and a cut point of 6% is lower than has generally been recognized as abnormal in other tissue types. We therefore wished to address the question of whether 4N fractions of 6–15% were as predictive of cancer risk as 4N fractions of >15%. Figure 2B and Table 1 illustrate that these two categories seem to be equivalently strong predictors of cancer outcome.
Distribution of Aneuploid DNA Contents
The distribution of aneuploid DNA contents was not uniform. Instead, the aneuploid populations fell into a bimodal distribution, with “triploid” (2.7 < N < 4.0) abnormalities constituting the majority and near-diploid aneuploid cell populations (2.0N < N < 2.7N) representing the minority (Fig. 3A). A small fraction of aneuploid populations had DNA contents of >4N or <2N.
Figure 3.
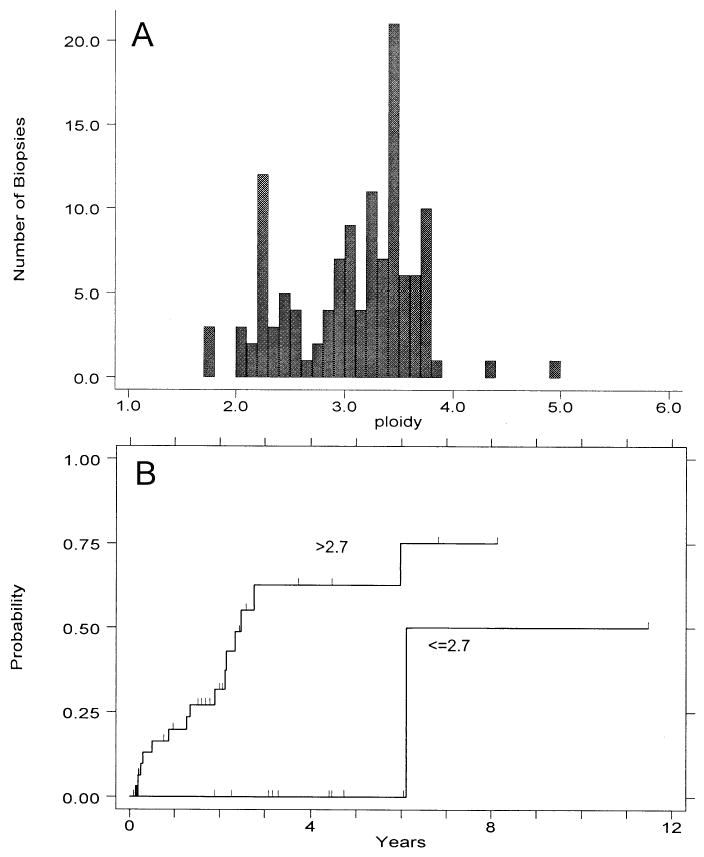
(A) Distribution of DNA ploidy values for aneuploid biopsies seen in study patients (123 aneuploid populations from 45 patients). (B) Cumulative cancer incidence for patients with at least one aneuploid DNA content <2.7N, vs those having all observed DNA contents 32.7N.
DNA Content and Progression to Cancer
One of 11 patients (9%) whose only abnormality was a near-diploid aneuploidy (DNA content ≤ 2.7N) progressed to cancer, compared with 15 of 34 patients (44%) who had an aneuploidy of >2.7N. The cumulative cancer incidence rates between these two groups (Fig. 3B) shows a marked difference between the two categories (p < 0.01, RR = 10.4, CI = 1.4–80). Importantly, no patient with a near-diploid DNA content progressed to cancer within 5 yr from the baseline endoscopy (Fig. 3B).
Combination of Aneuploidy and Elevated 4N Fraction
Figure 4 shows the cumulative cancer incidence rates for patients with aneuploidy only, 4N fractions of >6%, neither, or both. Figure 4A shows results obtained with aneuploidy defined as any abnormal DNA content, including near-diploid aneuploidies. The presence of elevated 4N fractions alone (RR = 11, CI = 5.1–25) or elevated 4N fractions and aneuploidy together (RR = 20, CI = 9.0–44) was more predictive of cancer outcome than were the presence of aneuploidy alone (RR = 4.4, CI = 1.4–14). These results are similar to our previously published observations (21). However, when aneuploid DNA contents were limited to those >2.7N (Fig. 4B and Table 1), the presence of aneuploidy only and the presence of elevated 4N fractions only predict similar cancer risk (RR = 7.9, CI = 2.3–28; and RR = 10.2, CI = 4.7–22, respectively). The presence of both, however, has increased predictive value for cancer outcome (RR = 23, CI = 10–50, 3-yr and 5-yr cancer incidences both 75%) (Table 1). This increased predictive value, relative to either alone, is significant (RR = 2.4, CI = 1.1–5.2, p = 0.02).
Figure 4.
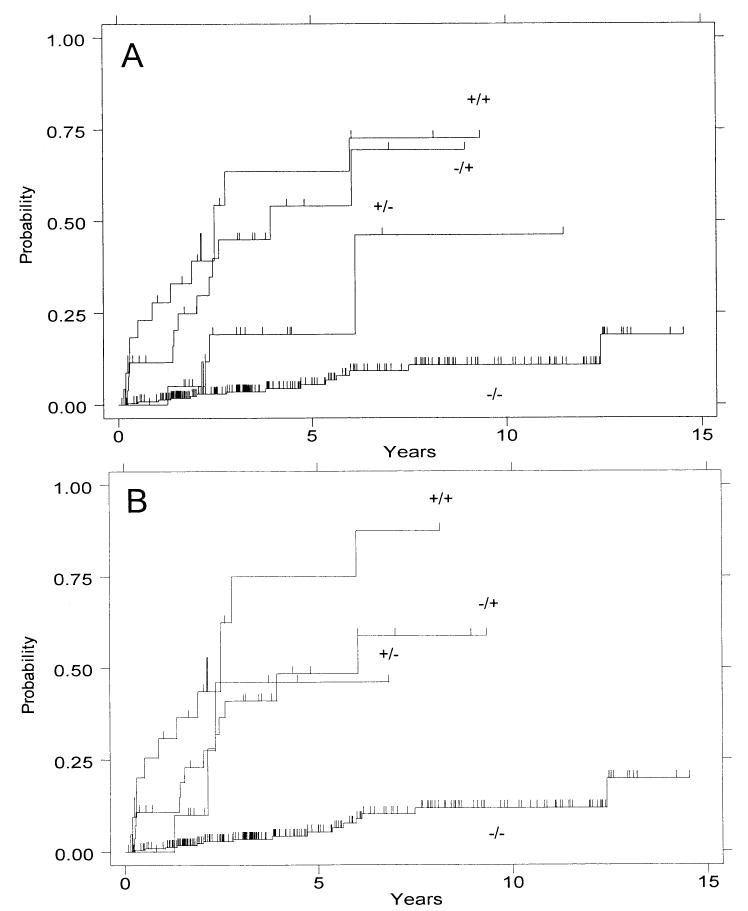
Cumulative incidence of cancer by ploidy category: presence (+) or absence (−) of aneuploidy/presence (+) or absence (−) of elevated 4N fractions. Analyses are performed with (A) any aneuploid DNA content included, and (B) near-diploid DNA contents (<2.7N) excluded from the aneuploid category.
Number of Aneuploid Cell Populations of >2.7N and Progression to Cancer
Of 34 patients, 22 (65%) had a single aneuploid cell population of >2.7N in the baseline endoscopy; nine of the 34 patients (27%) had two aneuploid populations, and three patients (9%) had three or four aneuploid populations (as DNA contents of <2.7N were shown to have little prediction of cancer risk, these ploidy values were eliminated from this analysis). Although the numbers in these groups are small, cancer incidence seems to be similar in patients with one aneuploid population (nine of 22 patients developed cancer) versus two or more (six of 12 patients developed cancer).
Number and Fraction of Levels With DNA Content Abnormalities
In some patients, DNA content abnormalities were present over large regions of the esophagus; in others, however, the DNA content abnormality seemed to be much more localized. To determine whether the risk of cancer was higher in one case than in the other, we looked at cancer incidence as a function of both the number of levels with a DNA content abnormality (either aneuploidy > 2.7N or 4N elevation) and fraction of levels with a DNA content abnormality. Of 307 patients, 35 (11%) had only one level with a DNA content abnormality at baseline endoscopy, 11 patients (4%) had two, eight (3%) had three levels with a DNA content abnormality, and 10 (3%) had four to nine levels with a DNA content abnormality. The observed incidence of cancer among patients with two or more levels having a DNA content abnormality was slightly greater than those with only one level involved, but this was not statistically significant (RR 1.6, CI = 0.74–3.4, p = 0.24). The risk of cancer in patients with three to nine levels with a DNA content abnormality was greater that that of patients with one to two levels involved, but this was of borderline significance (RR = 2.2, CI = 98–4.7, p = 0.06). The fraction of levels in the baseline endoscopy with a DNA content abnormality was examined by tertiles, and no difference in cancer incidence was seen (data not shown).
ROC and Cut Point Analysis of S-Phase Fractions
S-phase fractions are frequently proposed as biomarkers of risk in Barrett’s esophagus (22–26), and our previous studies have shown a correlation of S-phase fractions of >7% with histological abnormalities (29). To determine what degree of increased S phase might be correlated with progression to cancer, we again used an ROC curve (Fig. 5A) and the log-rank test statistic to examine cancer outcome by S-phase cut point (Fig. 5B). The ROC curve shows poorer combinations of sensitivity and specificity than those seen for 4N fraction. The log-rank test of cancer outcome suggested possible optimal cut points at 5.5% and 9% S phase. Therefore, we evaluated these two cut points as potential predictors of progression to cancer.
Figure 5.
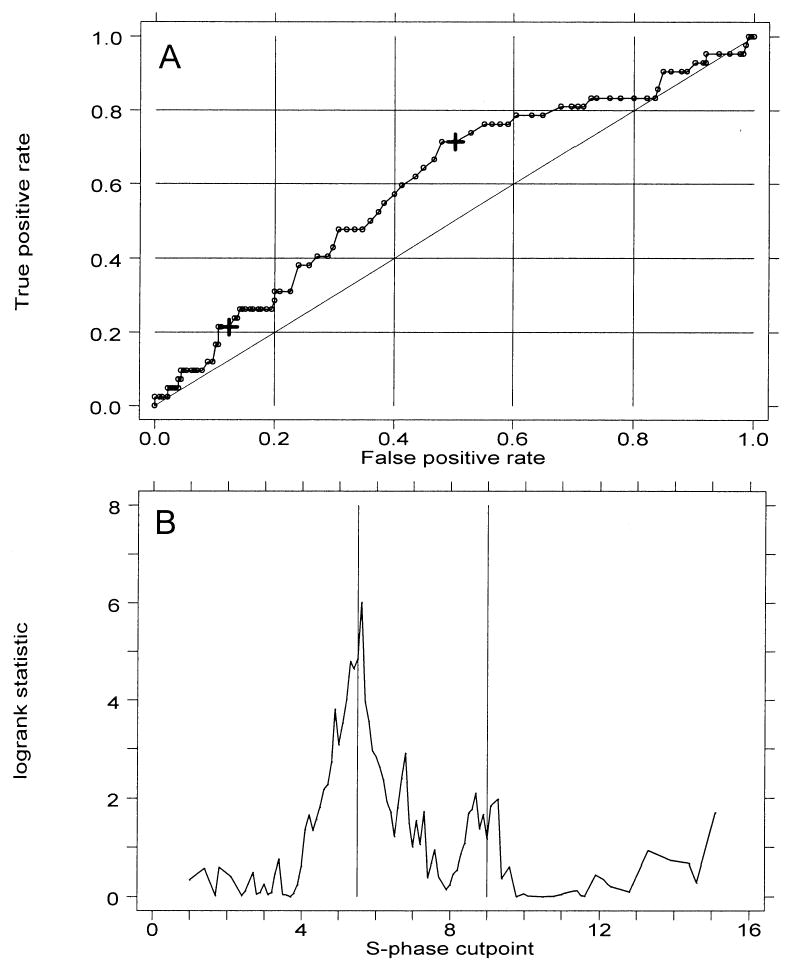
(A) Receiver operating characteristic (ROC) curve analysis of the prediction cancer outcome by S-phase fractions according to cut point. The two large crosses indicate cut points of 5.5% and 9%. (B) Two-sample test for cancer outcome by S-phase cut point. Vertical lines mark potential χ2 maxima at 5.5% and 9%.
S-Phase Fractions as Predictors of Progression to Cancer
Of 307 patients, 137 had an S-phase fraction of >5.5% at baseline endoscopy. The incidence of cancer 3 yr and 5 yr after such an elevated S-phase was 17% (CI = 12–25) and 21% (CI = 15–30), respectively (Fig. 6A). The RR for patients with this elevated S phase compared to those without was 2.3 (CI = 1.2–4.4, p = 0.02). Of 307 patients, 44 (14%) had an S-phase fraction of >9% at baseline endoscopy. The incidence of cancer 3 yr and 5 yr after this degree of elevated S phase was 21% (CI = 11–40) and 28% (CI = 14–51), respectively (Fig. 6B). The RR for patients with this elevated S phase compared to those without was 2.0 (CI = 0.94–4.1, p = 0.07).
Figure 6.
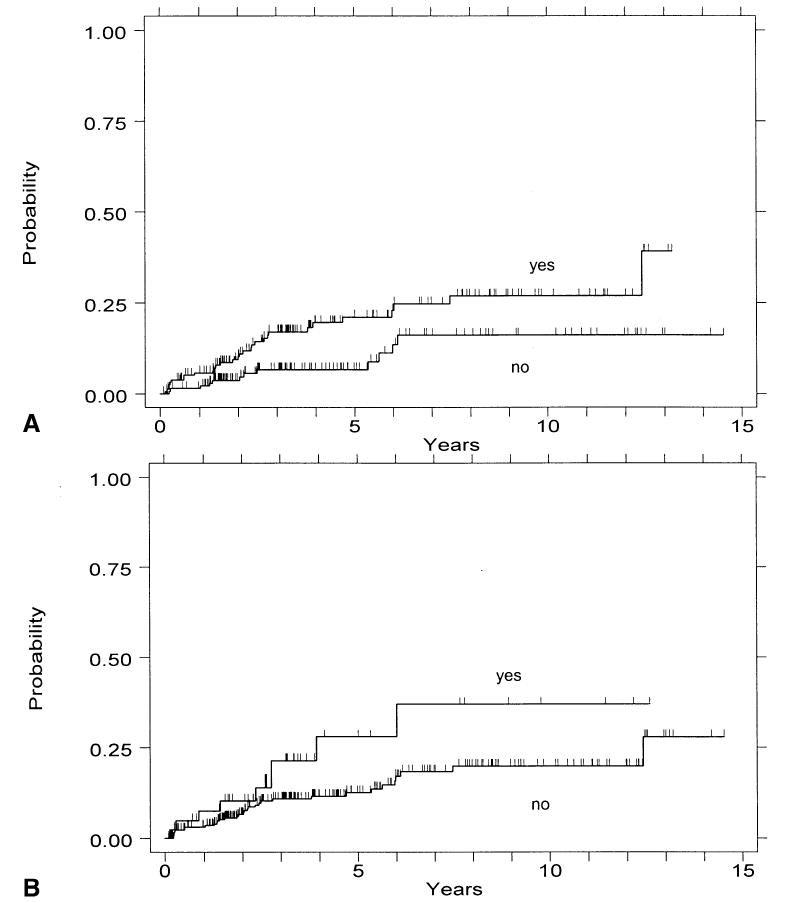
Cumulative incidence of cancer by presence of elevated S phase. (A) Cancer incidence for patients with vs without an S-phase fraction of >5.5%. (B) Cancer incidence for patients with vs without an S-phase fraction >9%.
Cytometric Variables Combined With Histological Grade
We have previously reported that the presence of either aneuploidy or elevated 4N fraction is predictive of cancer outcome in the subset of patients with negative, indefinite, or low-grade dysplasia (RR = 19, CI = 4.7–78), but not among patients with HGD, for whom the cancer risk is uniformly elevated (21). When this analysis is repeated with the exclusion of near-diploid aneuploidy (DNA content < 2.7), the presence of either aneuploidy or elevated 4N fraction assumes greater predictive strength in the subset of patients with negative, indefinite, or low-grade dysplasia (RR = 25, CI = 6.5–98) (Fig. 7A), and becomes of borderline significance in the subset of patients with HGD (RR = 1.8, CI = 0.9–3.9) (Fig. 7B). The number of cancer cases in the patients without HGD is small: five of 20 in the “either aneuploidy or elevated 4N fraction” category, five of 16 in the “elevated 4N” category, and none of four in the “aneuploidy only” category progressed to cancer. These limited data appear to suggest that an elevated 4N fraction was the strongest indicator of cancer risk in this patient subset (RR = 36, CI = 9.2–140).
Figure 7.
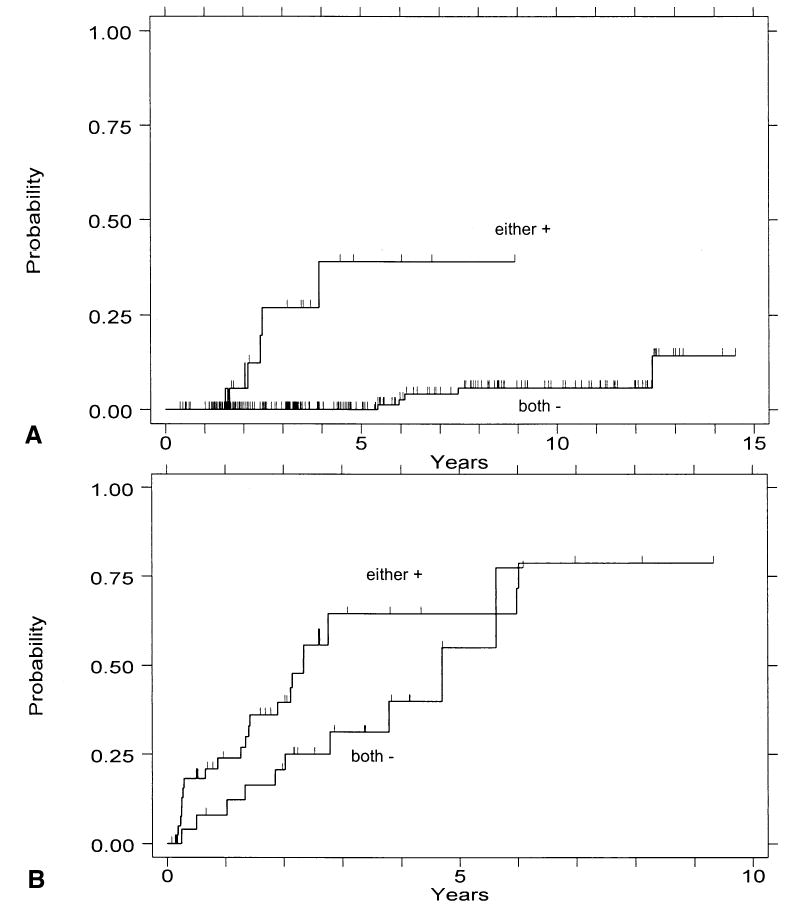
(A) Cumulative incidence of cancer in patients with baseline endoscopy-negative, indefinite, or low-grade dysplasia histology with neither aneuploid DNA content > 2.7N nor 4N fraction > 6% (both −), or with either of these two cytometric findings (either +). (B) Corresponding analysis of patients with baseline high-grade dysplasia.
When S phase was examined separately in HGD and non-HGD patient subsets, predictive strength was greatly diminished: in less than HGD patients an S phase of >5.5% was associated with a RR of 1.4 (CI = 0.39–4.9), but it was not significant (p = 0.62). In patients with HGD the RR was 1.6 (CI = 0.72–3.6), but it also was not significant (p = 0.24). The S-phase cut point of 9% had a RR of 1.0 within both patient subsets. Because RR estimates within strata defined by presence or absence of HGD were similar, we fit a stratified model to test the risk imparted by S phase > 5.5% when high grade histology status was taken into account. The RR was not significantly different from 1 (RR = 1.5, CI = 0.79–3.0, p = 0.21).
DISCUSSION
The majority of Barrett’s patients will not develop esophageal adenocarcinoma (10–19, 37, 38, 40), and these patients derive no benefit from endoscopic surveillance efforts. Conversely, when the subset of patients at risk for progression to cancer can be identified, surveillance efforts and resources can be most effectively focused on this population. We have shown in this and a previous article (21) that flow cytometry can be an effective adjunct to histology to stratify patients with Barrett’s esophagus into these low- and high-risk subsets. The flow cytometric measurement of cellular DNA content provides, in one analysis, quantitation of S phase, G2/4N fraction, and presence and DNA content of aneuploid cell populations (if present). The optimal clinical utility of flow cytometry requires that each of these quantities be correctly interpreted. This report is an attempt to determine the rules for such a determination by analyzing the relationship of the flow cytometric parameters to cancer outcome.
The 4N cut point of 6% was originally selected as 2.5 SD above the mean G2/4N fraction in gastric fundus, and values above this level were found to be correlated with the presence of histological dysplasia in Barrett’s esophagus (29). Elevations above this percentage have also been shown to correlate with p53 loss of heterozygosity (LOH) and subsequent development of DNA aneuploidy (41). The degree of 4N elevation that is most predictive of progression to cancer had not, however, been previously established. By an analysis of ROC curves and the log-rank test statistic for cancer outcome (Fig. 1), we have determined that the 6% cutoff based on histology is in agreement with the optimal cutoff for prediction of cancer outcome. This degree of elevation is, however, substantially less than the 15% cut point above which is conventionally considered to be evidence of DNA tetraploidy (32). Despite this, we have demonstrated (Fig. 2) that 4N elevation in the 6–15% range is just as predictive of cancer outcome as is elevation > 15%. As we have previously noted (21, 29, 36), it is important that care be taken in flow cytometric analysis to avoid artifactual 4N elevations resulting from aggregation of cells or nuclei. The association of elevated 4N fractions with p53 LOH suggests their possible origin; p53 inactivation in Barrett’s esophagus usually occurs by 17p (p53) LOH and p53 mutation (41–44); and in the absence of normal p53 protein, cells with DNA damage bypass the p53-dependent G1 checkpoint and arrest in G2/M (39). They may subsequently adapt to the G2/M checkpoint and pass without cell division into a tetraploid G1 (45, 46). Analysis of sorted Barrett’s epithelial cells from the elevated 4N fraction by fluorescence in situ hybridization (FISH) has indeed shown that they are a mixture of G2 and tetraploid G1 cells (47).
Aneuploid cells in Barrett’s esophagus have a bimodal distribution of DNA contents with near-diploid and near-triploid modes (Fig. 3A). This distribution is very similar to that seen in other epithelial malignancies (48), including breast (49) and colon cancers (50). In the 42 cancers that arose within the cohort that we report, the near-diploid mode (DNA content < 2.7N) did not seem to be associated with increased cancer risk. Although the number of cases was small, patients with a near-diploid aneuploidy remained cancer free within 5 yr of baseline measurement (Fig. 3B). Breast and bladder cancers with near-diploid aneuploidy have also been shown to be associated with more favorable prognosis (27, 28), and our finding that the presence of near-diploid aneuploidy is associated with lower risk of progression to invasive cancer is analogous to observations in noninvasive, Ta, bladder lesions (51–53). There are several possible mechanisms of such a difference. It is possible that near-diploid aneuploidy is more frequently an artifact of altered DNA dye accessibility (54) or cell degeneration resulting from poor sample preservation (55). However, we have used a dye that is least affected by chromatin conformation (4′,6-diamidino-2-phenyl-indole [DAPI]), and we have carefully minimized the time between endoscopy and biopsy preservation by placing the biopsies on ice in tissue culture medium during endoscopy and freezing them at −20°C immediately after the procedure. Alternatively, it is possible that near-diploid aneuploidy arises by a different mechanism than near-triploid aneuploidy. As previously mentioned, we have shown that elevated 4N fractions are associated with inactivation of p53 and frequently precede aneuploidy (41). A tetraploid intermediate has been proposed as a precursor to the development of aneuploidy in human cancers through progressive chromosome loss (56–59). In contrast, near-diploid aneuploidy may arise directly from diploid cells as a consequence of chromosome non-disjunction, such as typically occurs in many hematological malignancies (60, 61). In this scenario, near-triploid (but not near-diploid) aneuploidy would be a step in a continuum from p53 abnormality and tetraploidy to aneuploidy to cancer. The hypothesis that elevated 4N fractions and near-triploid aneuploidy are manifestations of the same cellular defect could explain their similar cancer risk, but would not seem to explain the observation that the presence of both confers a higher cancer risk than either alone (Table 1). It also seems surprising that the presence of more than one aneuploid population in Barrett’s esophagus is not associated with higher cancer risk than the finding of a single aneuploid DNA content, as the former would seem to be evidence of a high degree of genomic instability in the Barrett’s epithelium (30). It seems that the presence of even a single DNA aneuploid population indicates that mechanisms of genomic instability are actively contributing to neoplastic progression.
The proliferative rate of the Barrett’s epithelium, as measured by S phase, seems to carry only very modest power for prediction of progression to cancer (22), and we did not find it to be significant when the presence of HGD was accounted for. We hypothesize that acquisition of a high proliferative rate in Barrett’s esophagus is an early event in the sequence of neoplastic progression and does not strongly indicate which of these cases will go on to cancer. This is consistent with our observation that allelic loss of 9p21 and mutation of the CDKN2/p16 gene are common early events in Barrett’s esophagus (41, 62), as loss of p16 removes an important inhibitor of Rb activation.
One of the most significant findings of this and a previous report (21) is that flow cytometry defines low- and high-risk subsets of patients without HGD, inasmuch as histological subdivision of these patients into negative, indefinite, and low-grade dysplasia subsets seems to provide poor separation of risk (21, 63, 64) and may be confounded by inter-observer variation in histological diagnosis (65–69). Not only do transient episodes of LGD increase patient anxiety, they are also a significant factor in increasing the cost of endoscopic surveillance in Barrett’s esophagus (70). The redefinition of prognostically significant aneuploidy (>2.7N) enhances the separation of low- and high-risk subsets of patients without HGD (Table 1). Multivariate analysis confirmed that elevated 4N fraction and aneuploidy of >2.7N each are independent predictors of cancer risk in a model that includes HGD, but S phase is not a predictor (data not shown). Our data support use of flow cytometry with histology in evaluation of cancer risk in Barrett’s esophagus. Patients who undergo our biopsy protocol and have negative, indefinite, or low-grade dysplasia biopsy results without increased 4N or aneuploidy may have subsequent surveillance deferred for up to 5 yr. More frequent surveillance can be reserved for patients with cytometric abnormalities, and management of HGD can be individualized based on careful risk-benefit calculations (6).
Acknowledgments
This work was supported by National Institutes of Health grant R01 CA61202. We thank Christine Karlsen for patient care, David Cowan for data base management, and Sop Chong Kim and Julie Hill for flow cytometry.
Footnotes
D.S.L. is currently at AstraZeneca (Wayne, PA).
References
- 1.Blot WJ, Devesa SS, Kneller RW, et al. Rising incidence of adenocarcinoma of the esophagus and gastric cardia. JAMA. 1991;265:1287–9. [PubMed] [Google Scholar]
- 2.Blot WJ, Devesa SS, Fraumeni JF., Jr Continuing climb in rates of esophageal adenocarcinoma: An update. JAMA. 1993;270:1320. [PubMed] [Google Scholar]
- 3.Pera M. Epidemiology of esophageal cancer, especially adenocarcinoma of the esophagus and esophagogastric junction. Recent Results Cancer Res. 2000;155:1–14. doi: 10.1007/978-3-642-59600-1_1. [DOI] [PubMed] [Google Scholar]
- 4.Spechler SJ, Zeroogian JM, Antonioli DA, et al. Prevalence of metaplasia at the gastro-oesophageal junction. Lancet. 1994;344:1533–6. doi: 10.1016/s0140-6736(94)90349-2. [DOI] [PubMed] [Google Scholar]
- 5.Farrow DC, Vaughan TL. Determinants of survival following the diagnosis of esophageal adenocarcinoma (United States) Cancer Causes Control. 1996;7:322–7. doi: 10.1007/BF00052937. [DOI] [PubMed] [Google Scholar]
- 6.Levine DS, Haggitt RC, Blount PL, et al. An endoscopic biopsy protocol can differentiate high-grade dysplasia from early adenocarcinoma in Barrett’s esophagus. Gastroenterology. 1993;105:40–50. doi: 10.1016/0016-5085(93)90008-z. [DOI] [PubMed] [Google Scholar]
- 7.Rusch VW, Levine DS, Haggitt R, et al. The management of high-grade dysplasia and early cancer in Barrett’s esophagus. A multidisciplinary problem. Cancer. 1994;74:1225–9. doi: 10.1002/1097-0142(19940815)74:4<1225::aid-cncr2820740408>3.0.co;2-q. [DOI] [PubMed] [Google Scholar]
- 8.Peters JH, Clark GW, Ireland AP, et al. Outcome of adenocarcinoma arising in Barrett’s esophagus in endoscopically surveyed and nonsurveyed patients. J Thorac Cardiovasc Surg. 1994;108:813–21. [PubMed] [Google Scholar]
- 9.Spechler JS, Goyal RK. Barrett’s esophagus. N Eng J Med. 1986;315:362–71. doi: 10.1056/NEJM198608073150605. [DOI] [PubMed] [Google Scholar]
- 10.Spechler SJ, Robbins AH, Rubins HB, et al. Adenocarcinoma, and Barrett’s esophagus. An overrated risk? Gastroenterology. 1984;87:927–33. [PubMed] [Google Scholar]
- 11.Cameron AJ, Ott BJ, Payne WS. The incidence of adenocarcinoma in columnar-lined (Barrett’s) esophagus. N Engl J Med. 1985;313:857–9. doi: 10.1056/NEJM198510033131404. [DOI] [PubMed] [Google Scholar]
- 12.Hameeteman W, Tytgat GHJ, Houthoff HJ, et al. Barrett’s esophagus. Development of dysplasia and adenocarcinoma. Gastroenterology. 1989;96:1249–56. doi: 10.1016/s0016-5085(89)80011-3. [DOI] [PubMed] [Google Scholar]
- 13.Ovasaka J, Miettinen M, Kivilaakso E. Adenocarcinoma arising in Barrett’s esophagus. Dig Dis Sci. 1989;34:1336–9. doi: 10.1007/BF01538065. [DOI] [PubMed] [Google Scholar]
- 14.Robertson CS, Mayberry JF, Nicholson DA, et al. Value of endoscopic surveillance in the detection of neoplastic change in Barrett’s oesophagus. Br J Surg. 1988;75:760–3. doi: 10.1002/bjs.1800750813. [DOI] [PubMed] [Google Scholar]
- 15.Williamson WA, Ellis FH, Gibb P, et al. Barrett’s esophagus: Prevalence and incidence of adenocarcinoma. Arch Intern Med. 1991;151:2212–6. doi: 10.1001/archinte.151.11.2212. [DOI] [PubMed] [Google Scholar]
- 16.Achkar E, Carey W. The cost of surveillance for adenocarcinoma complicating Barrett’s esophagus. Am J Gastroenterol. 1988;3:291–4. [PubMed] [Google Scholar]
- 17.van der Burgh A, Dees J, Hop WC, et al. Oesophageal cancer is an uncommon cause of death in patients with Barrett’s oesophagus. Gut. 1996;39:5–8. doi: 10.1136/gut.39.1.5. [DOI] [PMC free article] [PubMed] [Google Scholar]
- 18.Drewitz DJ, Sampliner RE, Garewal HS. The incidence of adenocarcinoma in Barrett’s esophagus: A prospective study of 170 patients followed 4.8 years. Am J Gastroenterol. 1997;92:212–5. [PubMed] [Google Scholar]
- 19.Grimm I, Shaheen N, Bozymski EM. Surveillance for Barrett’s esophagus: Are we saving lives? Gastroenterology. 1997;112:661–2. doi: 10.1053/gast.1997.v112.agast970661. [DOI] [PubMed] [Google Scholar]
- 20.Provenzale D, Schmitt C, Wong JB. Barrett’s esophagus: A new look at surveillance based on emerging estimates of cancer risk. Am J Gastroenterol. 1999;94:2043–53. doi: 10.1111/j.1572-0241.1999.01276.x. [DOI] [PubMed] [Google Scholar]
- 21.Reid BJ, Levine DS, Longton G, et al. Predictors of progression to cancer in Barrett’s esophagus. Baseline histology and flow cytometry identify low and high risk patient subsets. Am J Gastroenterol. 2000;95:1669–76. doi: 10.1111/j.1572-0241.2000.02196.x. [DOI] [PMC free article] [PubMed] [Google Scholar]
- 22.Robaszkiewicz M, Hardy E, Volant A, et al. Flow cytometric analysis of cellular DNA content in Barret’s esophagus. A study of 66 cases. Gastroenterol Clin Biol. 1991;15:703–10. [PubMed] [Google Scholar]
- 23.Herbst JJ, Berenson MM, McCloskey DW, Wiser WC. Cell proliferation in esophageal columnar epithelium (Barrett’s esophagus) Gastroenterology. 1978;75:683–7. [PubMed] [Google Scholar]
- 24.Pellish LJ, Hermos JA, Eastwood GL. Cell proliferation in three types of Barrett’s epithelium. Gut. 1980;21:26–31. doi: 10.1136/gut.21.1.26. [DOI] [PMC free article] [PubMed] [Google Scholar]
- 25.Ouatu-Lascar R, Fitzgerald F, Triadafilopoulos G. Differentiation and proliferation in Barrett’s esophagus and the effects of acid suppression. Gastroenterology. 1999;117:327–35. doi: 10.1053/gast.1999.0029900327. [DOI] [PubMed] [Google Scholar]
- 26.Gray MR, Hall PA, Nash J, et al. Epithelial proliferation in Barrett’s esophagus by proliferating cell nuclear antigen immunolocalization. Gastroenterology. 1992;103:1769–76. doi: 10.1016/0016-5085(92)91433-5. [DOI] [PubMed] [Google Scholar]
- 27.Wheeless LL, Badalament RA, de Vere White RW, et al. Consensus review of the clinical utility of DNA cytometry in bladder cancer. Report of the DNA Cytometry Consensus Conference. Cytometry. 1993;14:478–81. doi: 10.1002/cyto.990140504. [DOI] [PubMed] [Google Scholar]
- 28.Hedley DW, Clark GM, Cornelisse CJ, et al. Consensus review of the clinical utility of DNA cytometry in carcinoma of the breast. Report of the DNA Cytometry Consensus Conference. Cytometry. 1993;14:482–5. doi: 10.1002/cyto.990140505. [DOI] [PubMed] [Google Scholar]
- 29.Reid BJ, Blount PL, Rubin CE, et al. Flow-cytometric, and histological progression to malignancy in Barrett’s esophagus: Prospective endoscopic surveillance of a cohort. Gastroenterology. 1992;102:1212–9. [PubMed] [Google Scholar]
- 30.Rabinovitch PS, Reid BJ, Haggitt RC. Progression to cancer in Barrett’s esophagus is associated with genomic instability. Lab Invest. 1988;60:65–71. [PubMed] [Google Scholar]
- 31.Levine DS, Reid BJ. Endoscopic diagnosis of esophageal neoplasms. Gastrointest Endosc Clin North Am. 1992;2:395–413. [Google Scholar]
- 32.Shankey TV, Rabinovitch PS, Bagwell B, et al. Guidelines for implementation of clinical DNA cytometry. Cytometry. 1993;14:472–7. doi: 10.1002/cyto.990140503. [DOI] [PubMed] [Google Scholar]
- 33.Kalbfleisch JD, Prentice RL, eds. The statistical analysis of failure time data. New York: John Wiley, 1980.
- 34.Swets JA, Pickett RM. Evaluation of diagnostic systems: Methods from signal detection theory. New York: Academic Press, 1982.
- 35.Mets CE. ROC methodology in radiologic imaging. Invest Radiol. 1986;21:720–33. doi: 10.1097/00004424-198609000-00009. [DOI] [PubMed] [Google Scholar]
- 36.Reid BJ, Haggitt RC, Rubin CE, et al. Barrett’s esophagus. Correlation between flow cytometry and histology in detection of patients at risk for adenocarcinoma. Gastroenterology. 1987;93:1–11. [PubMed] [Google Scholar]
- 37.Miros M, Kerlin P, Walker N. Only patients with dysplasia progress to adenocarcinoma in Barrett’s oesophagus. Gut. 1991;32:1441–6. doi: 10.1136/gut.32.12.1441. [DOI] [PMC free article] [PubMed] [Google Scholar]
- 38.O’Connor BJ, Falk GW, Richter JE. The incidence of adenocarcinoma and dysplasia in Barrett’s esophagus. Am J Gastroenterol. 1999;94:2037–42. doi: 10.1111/j.1572-0241.1999.01275.x. [DOI] [PubMed] [Google Scholar]
- 39.O’Connor PM. Mammalian G1 and G2 phase checkpoints. Cancer Surv. 1997;29:151–82. [PubMed] [Google Scholar]
- 40.Cameron AJ. Barrett’s esophagus: Does the incidence of adenocarcinoma matter? Am J Gastroenterol. 1997;92:193–4. [PubMed] [Google Scholar]
- 41.Galipeau PC, Cowan DS, Sanchez CA, et al. 17p (p53) allelic losses, 4N (G2/tetraploid) populations, and progression to aneuploidy in Barrett’s esophagus. Proc Natl Acad Sci USA. 1996;93:7081–4. doi: 10.1073/pnas.93.14.7081. [DOI] [PMC free article] [PubMed] [Google Scholar]
- 42.Prevo LJ, Sanchez CA, Galipeau PC, et al. p53-Mutant clones, and field effects in Barrett’s esophagus. Cancer Res. 1999;59:4784–7. [PubMed] [Google Scholar]
- 43.Hamelin R, Flejou JF, Muzeau F, et al. TP53 gene mutations, and p53 protein immunoreactivity in malignant, and premalignant Barrett’s esophagus. Gastroenterology. 1994;107:1012–8. doi: 10.1016/0016-5085(94)90225-9. [DOI] [PubMed] [Google Scholar]
- 44.Gleeson CM, Sloan JM, McManus DT, et al. Comparison of p53 and DNA content abnormalities in adenocarcinoma of the oesophagus and gastric cardia. Br J Cancer. 1998;77:277–86. doi: 10.1038/bjc.1998.44. [DOI] [PMC free article] [PubMed] [Google Scholar]
- 45.Lanni JS, Jacks T. Characterization of the p53-dependent postmitotic checkpoint following spindle disruption. Mol Cell Biol. 1998;18:1055–64. doi: 10.1128/mcb.18.2.1055. [DOI] [PMC free article] [PubMed] [Google Scholar]
- 46.Cross SM, Sanchez CA, Morgan CA, et al. A p53-dependent mouse spindle checkpoint. Science. 1995;267:1353–6. doi: 10.1126/science.7871434. [DOI] [PubMed] [Google Scholar]
- 47.Palanca-Wessels MC. In vitro analysis of cultured Barrett’s esophagus cells: Insights into mechanisms of genomic instability and possible therapeutic strategies. PhD thesis, University of Washington, 1999.
- 48.Raber MN, Barlogie B. Flow cytometry of human solid tumors. In: Melamed MR, Lindmo T, Mendelsohn ML, eds. Flow cytometry and sorting, 2nd ed. New York: Wiley-Liss, 1990:547–54.
- 49.Ewers SB, Langstrom E, Baldetorp B, et al. Flow-cytometric DNA analysis in primary breast carcinomas, and clinicopathological correlations. Cytometry. 1984;5:408–19. doi: 10.1002/cyto.990050419. [DOI] [PubMed] [Google Scholar]
- 50.Giaretti W. A model of DNA aneuploidization and evolution in colorectal cancer. Lab Invest. 1994;71:904–10. [PubMed] [Google Scholar]
- 51.deVere White RW, Deitch AD, West B, et al. The predictive value of flow cytometric information in the clinical management of stage O (Ta) bladder cancer. J Urol. 1988;139:279–82. doi: 10.1016/s0022-5347(17)42386-x. [DOI] [PubMed] [Google Scholar]
- 52.Blomjous EC, Schipper NW, Baak JP, et al. The value of morphometry and DNA flow cytometry in addition to classic prognosticators in superficial urinary bladder carcinoma. Am J Clin Pathol. 1989;91:243–8. doi: 10.1093/ajcp/91.3.243. [DOI] [PubMed] [Google Scholar]
- 53.Gustafson H, Tribukait B, Esposti PL. DNA profile and tumour progression in patients with superficial bladder tumours. Urol Res. 1982;10:13–8. doi: 10.1007/BF00256518. [DOI] [PubMed] [Google Scholar]
- 54.Darzynkiewicz Z, Traganos F, Kapuscinski J, et al. Accessibility of DNA in situ to various fluorochrome: Relationship to chromatin changes during erythroid differentiation of Friend leukemia cells. Cytometry. 1984;5:355–63. doi: 10.1002/cyto.990050411. [DOI] [PubMed] [Google Scholar]
- 55.Alanen KA, Joensuu H, Klemi PJ. Autolysis is a potential source of false aneuploid peaks in flow cytometric DNA histograms. Cytometry. 1989;10:417–25. doi: 10.1002/cyto.990100409. [DOI] [PubMed] [Google Scholar]
- 56.Shackney SE, Smith CA, Miller BW, et al. Model for the genetic evolution of human solid tumors. Cancer Res. 1989;49:3344–54. [PubMed] [Google Scholar]
- 57.Burholt DR, Shackney SE, Ketterer, et al. Karyotypic evolution of a human undifferentiated large cell carcinoma of the lung in tissue culture. Cancer Res. 1989;49:3355–61. [PubMed] [Google Scholar]
- 58.Ornitz DM, Hammer RE, Messing A, et al. Pancreatic neo-plasia induced by SV40 T-antigen expression in acinar cells of transgenic mice. Science. 1987;238:188–93. doi: 10.1126/science.2821617. [DOI] [PubMed] [Google Scholar]
- 59.Andreassen PR, Martineau SN, Margolis RL. Chemical induction of mitotic checkpoint override in mammalian cells results in aneuploidy following a transient tetraploid state. Mutat Res. 1996;372:181–94. doi: 10.1016/s0027-5107(96)00138-8. [DOI] [PubMed] [Google Scholar]
- 60.Le Beau MM, Rowley JD. Chromosomal abnormalities in leukemia and lymphoma: Clinical and biological significance. Adv Hum Genet. 1986;15:1–54. doi: 10.1007/978-1-4615-8356-1_1. [DOI] [PubMed] [Google Scholar]
- 61.Barlogie B, McLaughlin P, Alexanian R. Characterization of hematologic malignancies by flow cytometry. Anal Quant Cytol Histol. 1987;9:147–55. [PubMed] [Google Scholar]
- 62.Barrett MT, Sanchez CA, Prevo LJ, et al. Evolution of neoplastic cell lineages in Barrett esophagus. Nat Genet. 1999;22:106–9. doi: 10.1038/8816. [DOI] [PMC free article] [PubMed] [Google Scholar]
- 63.Wang HH, Doria MI, Jr, Purohit-Buch S, et al. Barrett’s esophagus. The cytology of dysplasia in comparison to benign and malignant lesions. Acta Cytol. 1992;36:60–4. [PubMed] [Google Scholar]
- 64.Weston AP, Sharma P, Topalovski M, et al. Low-grade dysplasia in Barrett’s esophagus. Variable fate during long-term prosepective follow-up. Gastroenterology. 1999;116:A352. [Google Scholar]
- 65.Reid BJ, Haggitt RC, Rubin CE, et al. Observer variation in the diagnosis of dysplasia in Barrett’s esophagus. Hum Pathol. 1988;19:166–78. doi: 10.1016/s0046-8177(88)80344-7. [DOI] [PubMed] [Google Scholar]
- 66.Sagan C, Flejou JF, Diebold MD, et al. Observer variation in the diagnosis of dysplasia in Barrett’s mucosa. Gastroenterol Clin Biol. 1994;18:D31–4. [PubMed] [Google Scholar]
- 67.Polkowski W, Baak JPA, Van Lanshot JJB, et al. Clinical decision making in Barrett’s oesophagus can be supported by computerized immunoquanitation and morphometry of features associated with proliferation and differentiation. J Pathol. 1998;184:161–8. doi: 10.1002/(SICI)1096-9896(199802)184:2<161::AID-PATH971>3.0.CO;2-2. [DOI] [PubMed] [Google Scholar]
- 68.Alikhan M, Rex D, Khan A, et al. Variable pathologic interpretation of columnar lined esophagus by general pathologists in community practice. Gastrointest Endoscopy. 1999;50:23–6. doi: 10.1016/s0016-5107(99)70339-1. [DOI] [PubMed] [Google Scholar]
- 69.van Sandick JW, Baak JP, van Lanschot JJ, et al. Computerized quantitative pathology for the grading of dysplasia in surveillance biopsies of Barrett’s oesophagus. J Pathol. 2000;190:177–83. doi: 10.1002/(SICI)1096-9896(200002)190:2<177::AID-PATH508>3.0.CO;2-X. [DOI] [PubMed] [Google Scholar]
- 70.Ofman JJ, Lewin K, Ramers C, et al. The economic impact of the diagnosis of dysplasia in Barrett’s esophagus. Am J Gastroenterol. 2000;95:2946–52. doi: 10.1111/j.1572-0241.2000.03209.x. [DOI] [PubMed] [Google Scholar]