Abstract
Purpose
E-cadherin is known to accumulate variably and slowly at junctions of cultured human RPE cells. The intent of this investigation was to determine what limits E-cadherin protein accumulation in RPE cells by analyzing cultures at early postplating intervals when junctions of the dominant cadherin (N-cadherin) are first forming.
Methods
RPE cell lines hTERT-RPE1 and ARPE-19 and RPE cultures established from human donors were analyzed within 48 hours after plating for E-cadherin gene and protein expression (by RT-PCR and Western blotting, respectively) and for protein distribution (by immunofluorescence and immunoelectron microscopy), including codistribution with markers for organelles. Cell surface localization was analyzed by biotinylation and trypsin cleavage of extracellular cadherin domains.
Results
The E-cadherin gene was constitutively expressed by RPE cultures, but the protein did not accumulate substantially in early RPE cultures. Instead small amounts of newly synthesized E-cadherin were detectable only transiently, peaking within a few hours after plating, at which time the protein was in the form of peptides of variable size rather the predicted 120-kDa molecular mass. Immunoreactive E-cadherin peptides did not traffic to the cell surface and localize to junctions. Rather they codistributed with several organelles including the endoplasmic reticulum (ER; but not the Golgi), sites of protein degradation (proteasomes, lysosomes, and autophagosomes) and unusual compartments (centrosomes and apposed to subdomains of the mitochondrial network).
Conclusions
The results suggest that in RPE cells posttranscriptional mechanisms involving altered protein processing and rapid turnover exist to limit E-cadherin accumulation. The consequence may be to limit E-cadherin-specific inductive properties in the RPE, a cell type in which N-cadherin is the normal dominant cadherin.
Cadherins are a family of glycoproteins that mediate calcium-dependent cell–cell adhesion at adherens junctions and participate in complex signaling pathways affecting cell phenotype.1 Dominant cadherin type differs among tissues, with E-cadherin the major cadherin of most monolayer epithelial cells. RPE cells differ in that they preferentially express N-cadherin, which localizes to a zonular junction2 resembling the E-cadherin adhesion in other epithelial cells. E-cadherin is not completely absent from the RPE, however. Junctional E-cadherin is found in scattered groups of both human and bovine RPE cells within the monolayer in situ.3,4 It is also found in patches of cells cultured from human RPE, but only after the cells have been held for long intervals at confluence.3 E-cadherin expression by the RPE is of interest because it is competent to induce basolateral polarity of Na,K-ATPase,5,6 which is the opposite of the normal polarity found in RPE cells in the eye.7–9 How apical polarity of the sodium pump develops in the RPE remains unresolved, but it may be essential for the cells to at least limit the basal inductive potential of E-cadherin.
One mechanism to limit E-cadherin function would be to limit protein abundance, which led us to question why E-cadherin accumulates so slowly at RPE junctions in vitro. To address this question, we first examined the timing of E-cadherin gene expression after plating RPE cell cultures, expecting to find upregulation in the late postconfluence period when the protein is detected.3 Unexpectedly, mRNA for E-cadherin was found in RPE cultures even shortly after plating (shown herein), which prompted us to look more closely at E-cadherin protein at this early culture interval. As we now show, E-cadherin does not accumulate substantially in early RPE cultures. Instead small amounts of newly synthesized E-cadherin are detectable only transiently, peaking within a few hours after plating, at which time the protein is in the form of peptides of variable size rather the predicted 120-kDa molecular mass. Immunoreactive E-cadherin peptides codistribute with several organelles, notably those involved in protein degradation, rather than trafficking to the cell surface and localizing to junctions. The results suggest that posttranscriptional mechanisms involving altered processing and rapid turnover exist in the RPE to limit E-cadherin protein accumulation in early cultures when junctions comprised of N-cadherin are first forming.
Methods
Cultures
The human RPE cell line hTERT-RPE1 was used for most of the experiments reported herein. Several experiments were performed in ARPE-19 cells, lines of other epithelial cell types (MDCK, A431, and Caco-2), and RPE cultures that were propagated from human donor eyes by methods that have been described elsewhere.3 The donor eyes were obtained and used according to the guidelines of the Declaration of Helsinki. Donor age and passage number are provided in the figure legends where data derived from the cultures are shown. All cells were grown using biweekly feedings of minimum essential medium (MEM) supplemented with dialyzed 10% FBS.
A carefully controlled protocol was used to deliver cells into assay wells for experiments to examine cadherin expression or distribution. The protocol was initiated several days before the experiments by first passaging the cultures and allowing them to attain confluence, then maintaining them at confluence for no more than 7 days. For plating in assay wells, cultures were fed 24 hours before dissociation with 0.3% trypsin then plated in multiwell plates or in glass chamber slides at a density to yield individual cells and small groups of cells (approximately 3 × 10⁴ cells/cm2). Cells were analyzed in early culture, defined as within 48 hours of plating.
In experiments to determine whether E-cadherin immunoreactive protein in early RPE cultures represents newly synthesized protein, cultures were treated with the protein synthesis inhibitor cycloheximide (100 μm) for 6 hours, from 24 to 30 hours after plating, with harvest for analysis at 30 hours. In other experiments, to alter mitochondrial phenotype by ATP synthesis blockade, cultures were treated with 200 μm antimycin A for 24 hours, also with harvest at 30 hours.
Transfection and Reverse Transcription–Polymerase Chain Reaction
Transfection experiments were conducted using plasmid vectors pEc-adGFP (gift of James Nelson, Stanford University, California) and pEGF-N1-NcadGFP (gift of Brian McKay, University of Arizona, Tucson, AZ), which express full length canine E-cadherin-GFP or human N-cadherin-GFP fusion proteins, respectively. Transfections were performed in nearconfluent cultures in complete culture medium (with serum) using LipofectAMINE 2000 reagent (Invitrogen Life Technologies, Gaithersburg, MD) and the manufacturer’s procedure, as previously described.10,11
RT-PCR was performed on total RNA extracts, as reported previously,10 using the following primers for the human E-cadherin gene, which predict a 410-bp product: upstream, 5′-AACCTGGTTCAGAT-CAAATCC-3′; downstream, 5′-GGCAGCTCAGGATCCTGGCTGA-3′. Amplified PCR products were electrophoresed in 1% agarose gels containing ethidium bromide.
Antibodies
Several anti-cadherin antibodies were used that are directed against different domains of the proteins (indicated in parentheses). The following mouse monoclonal antibodies were used: anti-N-cadherin antibody clone GC-4 (extracellular domain) and pancadherin antibody (cytoplasmic domain), both from Sigma-Aldrich, St. Louis, MO; anti-E-cadherin antibodies clone HECD-1 (extracellular domain near the amino terminus, Zymed Laboratories, Inc., South San Francisco, CA) and clone 36 (cytoplasmic domain, BD Transduction Laboratories, Lexington, KY). The following rabbit polyclonal antibodies were used: anti-N-cadherin antibody H-63 (extracellular domain; Santa Cruz Biotechnology, Santa Cruz, CA); anti-E-cadherin antibodies H-108 (extracellular domain near the plasma membrane, Santa Cruz Biotechnology), and ab15148 (extracellular domain, Abcam, Inc., Cambridge, MA). Also used were monoclonal antibodies to cadherin-associated proteins β-catenin and p120 (both from BD Transduction Laboratories). Primary mouse monoclonal antibodies to marker proteins of organelles (indicated in parentheses) were used: early endosome antigen 1 (EEA1, early endosomes, BD Transduction Laboratories); protein disulfide isomerase (PDI, endoplasmic reticulum [ER], Molecular Probes Invitrogen Detection Technologies, Eugene, OR); GM130, GS28, and P230 (Golgi; BD Transduction Laboratories); S20α (20S proteasome, Affiniti Research Products, Ltd., Exeter, UK); and ATP synthase α subunit (mitochondria; Molecular Probes Invitrogen Detection Technologies). Also used were rabbit polyclonal antibodies to pericentrin (centrosome; Covance, Richmond, CA), catalase (peroxisome, Abcam Ltd.), and calnexin (ER; Stressgen Biotechnologies, Victoria, BC, Canada); goat polyclonal antibodies to lysosomal associated membrane protein-2 (LAMP-2, lysosomes; Santa Cruz Biotechnology), and chicken polyclonal antibodies to microtubule-associated protein 1 light chain 3α (MAPILC3α, autophagosome; Orbigen, Inc., San Diego, CA). Rabbit polyclonal antibodies were used to detect green fluorescent protein (GFP; BD-Clontech Laboratories, Inc., Palo Alto, CA) in transfected cells. Secondary antibodies conjugated to rhodamine, fluorescein or 12 nm colloidal gold (for microscopy) or conjugated to horseradish peroxidase (for protein blotting) were from Jackson ImmunoResearch Laboratories, Inc. (West Grove, PA).
Microscopy
For immunofluorescence microscopy, cultures were fixed in paraformaldehyde and permeabilized after fixation by treatment with 0.5% Triton as previously described.2,3,10 Cells were immunostained with the antibodies listed in the previous section using dilutions and incubation times that were empirically determined for each antibody and which produced specific staining compared to cultures treated with a control antibody of the same isotype. In some experiments zenon technology (Molecular Probes Invitrogen Detection Technologies) was used to allow costaining with two mouse-derived antibodies. The manufacturer’s recommended labeling, fixation, and staining protocols were used. Nuclei were visualized with DAPI. Digital images were captured (Spot RT camera; Diagnostic Instruments, Sterling Heights, MI) and manipulated for display (Photoshop CS; Adobe Systems, Inc., San Jose, CA).
For immunoelectron microscopy, RPE cultures at 30 hours after plating were trypsinized to produce cell suspensions and fixed for 2 hours in phosphate-buffered 0.1% glutaraldehyde, 4% paraformaldehyde, and 3% sucrose. Samples were embedded in LR White (Polysciences, Inc., Warrington, PA). Thin sections were cut, stained with lead citrate, and incubated for 6 to 18 hours with clone 36 E-cadherin primary antibodies, followed by a 2-hour incubation with gold-conjugated secondary antibodies. Sections were examined and photographed (H-600 transmission electron microscope; Hitachi, Japan).
Western Blot Analysis, Biotinylation, and Controlled Trypsinization
For Western blot analysis, detergent-soluble proteins were collected from cultures using a 0.5% Triton buffer containing a cocktail of protease inhibitors as previously described2,3 and mixed with an equal volume of Laemmli12 electrophoresis buffer. Detergent-insoluble proteins remaining after Triton extraction were lysed directly in electrophoresis buffer, then mixed 1:1 with the Triton buffer. Protein concentrations in detergent-soluble and -insoluble extracts were determined by the Bradford method, and protein-equivalent samples were loaded on gels and separated by electrophoresis under reducing conditions using 7.5%, 10%, or 4% to 20% SDS separating gels. Proteins were electroblotted and probed with a subset of the primary antibodies listed in the previous section (reported with the Results) and bands were visualized by enhanced chemiluminescence (Pierce Chemical, Rockford, IL).
Biotinylation and trypsinization protocols were used to analyze the cell surface expression of cadherins. Methods for biotinylation were previously described.10 Controlled trypsinization was performed to cleave the ectodomain of cell surface cadherins by incubating cultures for 20 minutes in the absence or presence of low concentrations of trypsin (0.01%) in buffer containing calcium chelators. Biotinylated proteins or extracts prepared from cells subjected to trypsinization were analyzed by Western blot using antibodies to E- and N-cadherin.
Results
E-cadherin Expression and Distribution
E-cadherin mRNA has been observed in human RPE cultures at a late postconfluence interval when the protein localizes to the junctions of some cells.3 E-cadherin gene expression has not been analyzed in early cultures, but, as shown herein, the gene was also expressed at early culture intervals (Fig. 1). E-cadherin gene expression was detected in RPE cells propagated from human donor tissue as well as in the cell lines ARPE-19 and hTERT-RPE1.
Figure 1.
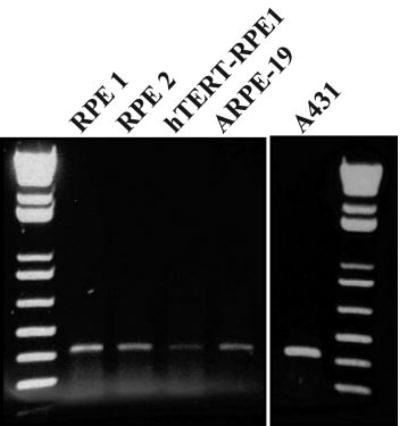
Agarose gel of RT-PCR products showing E-cadherin gene expression at 30 hours after plating in RPE cultures from two human donors (RPE 1 and 2), two human RPE cell lines, and A431 cells (human epithelial cell line used as a positive control). The donor-derived RPE cultures were from donors aged 53 years in passage 8 (RPE 1) and 68 years in passage 6 (RPE 2). DNA standards are shown in the first and last lanes.
Re-evaluation of E-cadherin in early RPE cultures initially showed no clear evidence for the protein, consistent with previous reports,3 until cultures were analyzed over a tight time course after plating. This protocol revealed a transient accumulation of protein and at nonjunctional sites. E-cadherin immunostaining showed a prominent signal associated with heterogeneous perinuclear granules which was detectable for a few hours, peaking at approximately 30 hours after plating (Fig. 2A). Similar staining patterns were seen in RPE cultures grown from donor tissue and in the RPE cell lines (Fig. 2). It was most reproducible in hTERT-RPE1 cells, although the timing of the peak staining and its intensity varied among experiments and was sensitive to culture density, even in this cell line (Fig. 2B). The nonjunctional E-cadherin seen in this early postplating interval represents newly synthesized protein, since immunostaining was reduced by treatment with the protein synthesis inhibitor cycloheximide (Fig. 2C).
Figure 2.
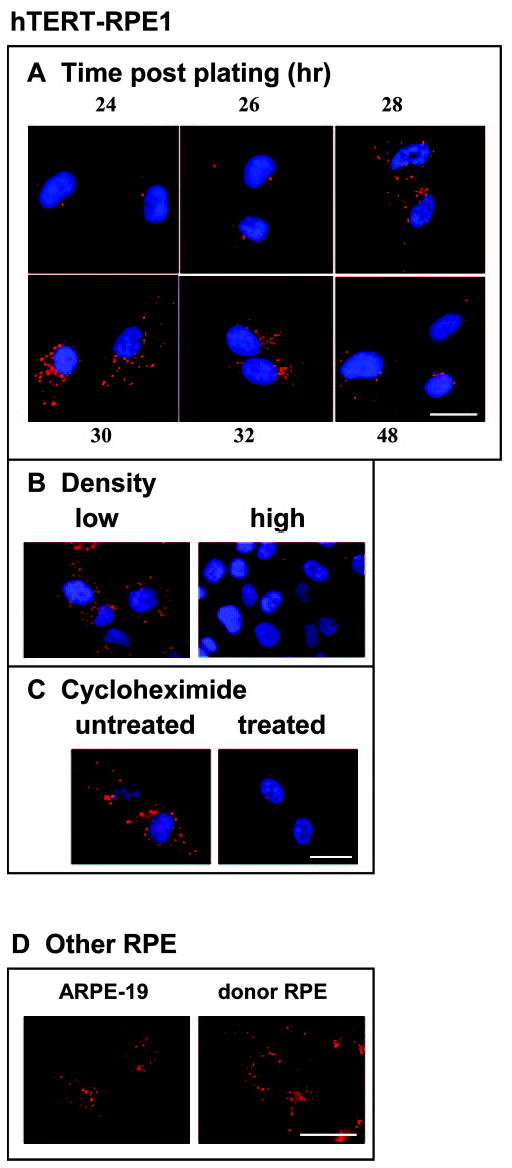
E-cadherin immunostaining (clone 36 antibody, red) in hTERT-RPE 1 cells (A–C). (A) Changes in E-cadherin staining at intervals between 24 and 48 hours after plating. (B) Low and high cell-density regions in the same culture at 30 hours after plating showing greater staining in low-density cells. (C) Cultures at 30 hours after plating, either untreated or treated with the protein synthesis inhibitor cycloheximide. (D) E-cadherin immunostaining at 30 hours after plating in ARPE-19 cells and RPE cultures from a human donor (aged 48 years, passage 9). Scale bar, 20 μm.
To confirm that the unusual nonjunctional protein distribution in early RPE cultures represents E-cadherin, several antibodies directed against different epitopes of the molecule were tested. The most prominent staining of the broadest spectrum of immunoreactive granules across experiments was obtained with clone 36 E-cadherin antibodies. Other antibodies also reacted with at least subsets of the granules, but none demonstrated junctional protein. Codistribution between two E-cadherin antibodies with different epitopes is illustrated in Figure 3. Additional support for the observation that RPE cells localize E-cadherin to nonjunctional sites in early culture was provided by transient transfection experiments, which showed that RPE cells also distribute exogenous GFP-E-cadherin to cytoplasmic granules rather than to junctions (Fig. 4A). In the transfection experiments, the transgene product was expressed in scattered cells at levels similar to those of the endogenous protein (the GFP tag was not seen in the living cells), avoiding an unphysiologically high expression that could produce an abnormal distribution. To detect the GFP, immunofluorescence microscopy of fixed cells was therefore used. The exogenous GFP-E-cadherin exhibited a nonjunctional pattern similar to the endogenous protein in RPE cells. In other epithelial cells the ectopic GFP-E-cadherin had the expected junctional pattern (Fig. 4B), as did ectopically expressed GFP-N-cadherin in RPE cells (Fig. 4A).
Figure 3.
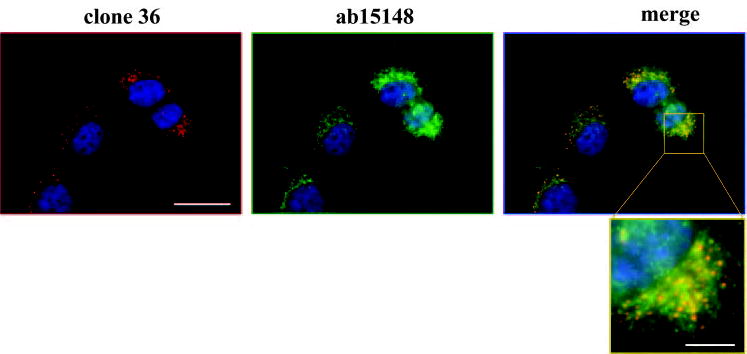
Costaining of hTERT-RPE1 cells at 30 hours after plating with monoclonal (clone 36, red) and polyclonal (ab15148, green) E-cadherin antibodies. As shown in the expanded merged image, the antibodies codistributed at some but not all the granular punctate–stained sites. Scale bars: 20 μm (low magnification images), 5 μm (enlargement).
Figure 4.
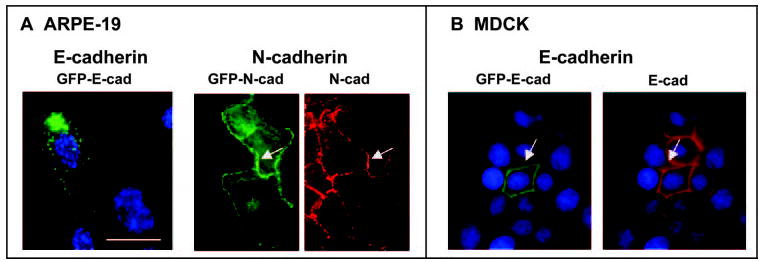
Product of a GFP-E-cadherin transgene in ARPE-19 (A) and MDCK cells (B) detected by staining with antibodies to GFP (green). GFP-E-cadherin was punctate in the RPE line but junctional in MDCK, as shown by costaining for endogenous E-cadherin in MDCK (red). (A) Also shown is the product of a GFP-N-cadherin transgene (green) codistributing with endogenous N-cadherin (red) in ARPE-19 cells. Arrows: sites of junctional colocalization of transgene products and the dominant endogenous cadherin in each cell type. Scale bar, 20 μm.
Immunoblot analysis for endogenous E-cadherin in extracts of early RPE cultures did not reveal a 120-kDa peptide as expected for the full-length, processed form of the protein. Rather, higher (135 kDa) and several lower molecular mass immunoreactive E-cadherin peptides were present (Fig. 5). The peptide patterns and band densities at steady state varied among experiments. They also differed in the Triton detergent-soluble and -insoluble cell fractions and when probed with E-cadherin antibodies directed against different regions of the molecule. Examples of blotting patterns from a donor RPE population and the hTERT-RPE1 line are shown (Fig. 5). E-cadherin immunoblot analysis was performed on extracts taken when immunostaining was at its peak intensity (30 hours after plating), at which time prominent staining was seen in most cells, yet blotting signals were typically weak. The molecular masses of the major E-cadherin peptides in extracts of early RPE cultures determined in approximately 40 independent experiments are summarized in Table 1.
Figure 5.
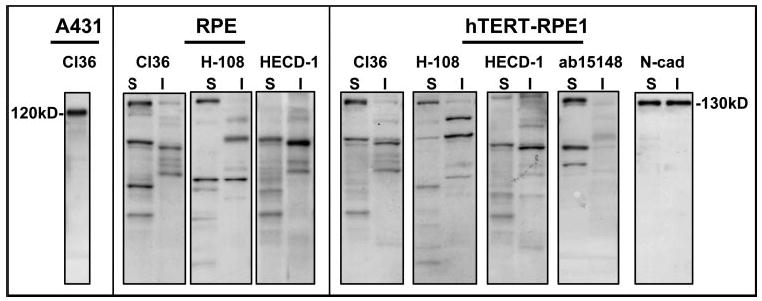
E-cadherin Western blots of protein extracts from RPE cultures at 30 hours after plating showing banding patterns for cells from a human donor, aged 71 years in passage 5 (RPE) and for the hTERT-RPE1 cell line. Different E-cadherin antibodies were used (cl36, H-108, HECD-1, and ab15148) to blot Triton detergent-soluble (S) and -insoluble (I) fractions. Also shown are the migration positions of E-cadherin (120 kDa) in a whole-cell extract of A431 cells and of N-cadherin (130 kDa) in soluble and insoluble fractions of hTERT-RPE1 cells.
Table 1.
Molecular Masses of Major Peptides
|
Clone 36 |
H-108 |
HECD-1 |
ab15148 |
|||||
|---|---|---|---|---|---|---|---|---|
| kDa | S | I | S | I | S | I | S | I |
| 135 | X | X | X | |||||
| 97–100 | X | X | X | |||||
| 80–84 | X | X | X | X | X | X | X | |
| 60 | X | X | X | X | ||||
| 48 | X | X | ||||||
| 40 | X | X | ||||||
| 30 | X | |||||||
Peptides were detected in E-cadherin blots of detergent soluble (S) and insoluble (I) RPE cell extracts using four E-cadherin antibodies (clone 36, H-108, HECD-1, ab15148).
N-cadherin differs from E-cadherin in early RPE cultures in that the former localizes to forming junctions as expected for the adhesion protein (Fig. 6A). Because E-cadherin does not distribute to junctions, the possibility was raised that the protein did not traffic to the RPE cell surface. This was supported by biotinylation analysis, which revealed no E-cadherin in the cell surface biotinylated fraction of RPE cells (Fig. 6B). The same protocol demonstrated cell surface N-cadherin in RPE cells and E-cadherin in MDCK cells, as expected. Controlled trypsinization to cleave the cadherin ectodomain also indicates no E-cadherin in RPE cell surface membranes. E-cadherin peptides show no evidence for trypsin-mediated proteolysis under conditions in which cell surface N-cadherin becomes truncated (Fig. 6C).
Figure 6.
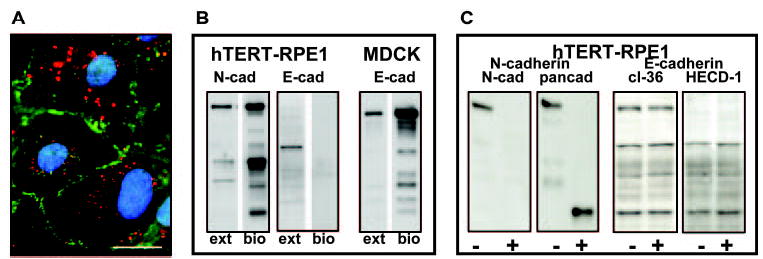
(A) Costaining of E-cadherin (clone 36, red) and N-cadherin (green) in hTERT-RPE-1 cells at 30 hours after plating. (B) Western blots of whole-cell extracts (ext) and the biotinylated cell-surface fractions (bio) showing N- and E-cadherin in RPE cells and E-cadherin in MDCK. E-cadherin was not found in the biotinylated fraction of RPE cells. (C) hTERT-RPE1 cultures that were untreated (−) or treated (+) with trypsin to degrade cadherin extracellular domains. The E-cadherin blotting pattern was unchanged, as shown for two antibodies (cl36, HECD-1). The N-cadherin signal was lost after treatment, as shown by an antibody directed against the extracellular N-cadherin domain (N-cad blot), and a lower mass cleavage product was generated, as shown by an antibody directed against the N-cadherin cytoplasmic domain (pancadherin [pancad] blot). Scale bar, 20 μm.
Organelle Codistribution of E-cadherin Immunoreactive Peptides
The absence of E-cadherin from the RPE cell surface coupled with the granular staining pattern in the perinuclear region where organelles are clustered suggested that E-cadherin immunoreactive protein is organelle associated in early RPE cultures. Further, because the granular pattern for E-cadherin staining is heterogeneous, varying from fine puncta to granules or vesicles of various sizes and conformations, E-cadherin co-distribution with multiple organelles seemed likely. Organelles are themselves heterogeneous in early cultures and consist of subdomains. Therefore, to determine E-cadherin codistribution with organelles, multiple independent experiments (3 to as many as 20) were performed with each organelle marker. The analyses demonstrated localization of E-cadherin immunoreactive peptides with biosynthetic, degradative, and unusual sub-cellular compartments in early RPE cultures (Figs. 7–10).
Figure 7.
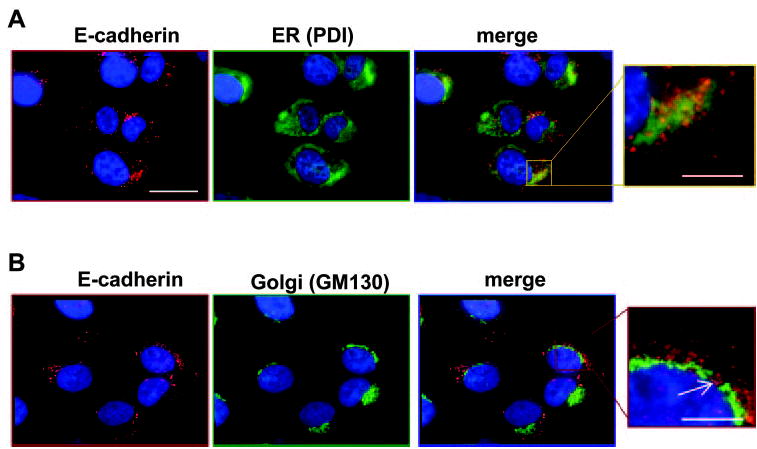
hTERT-RPE-1 cells at 30 hours after plating costained for E-cadherin (clone 36, red) and organelle markers (green) for (A) ER (PDI) and (B) Golgi (GM130). As shown in the enlarged E-cadherin-PDI merged image, the staining patterns colocalized in a subset of granules (yellow and yellow-orange). In contrast, E-cadherin did not codistribute with GM130; the arrow in the enlarged merged image indicates a site where the two staining patterns clearly segregated. Scale bars: 20 μm (low magnification images), 5 μm (enlargements).
Figure 10.
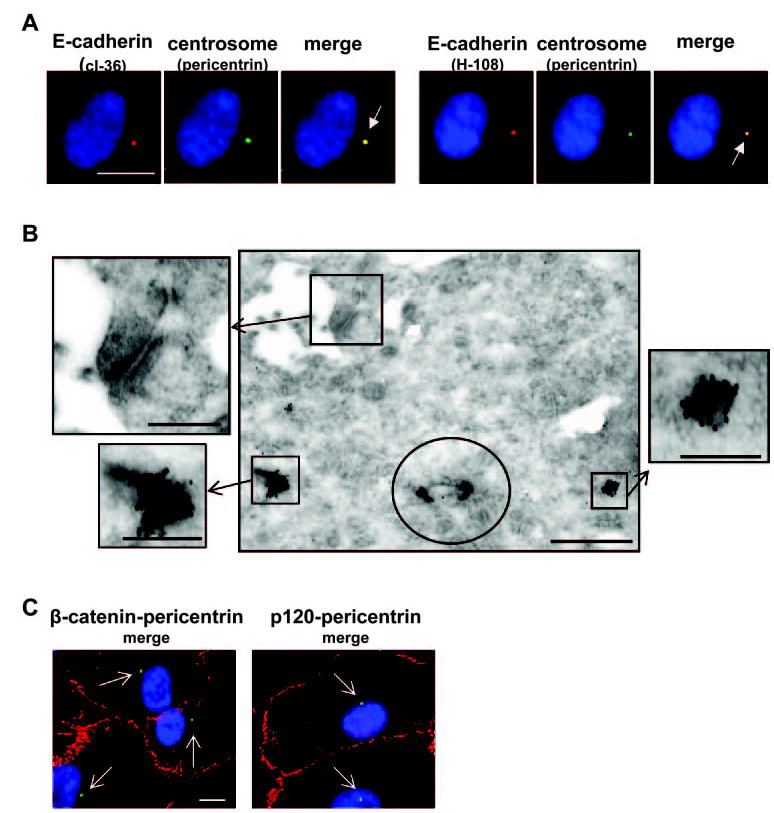
hTERT-RPE-1 cells at 30 hours after plating. (A) Costaining for E-cadherin (clone 36 [cl36] or H-108, red) and an organelle marker for the centrosome (pericentrin, green), which codistributed as shown in the merged images (yellow, arrows). (B) Immunoelectron microscopy of E-cadherin (clone 36). The site of the centriole is circled, and is flanked by two pericentriolar electron dense granules that are heavily labeled (boxes and enlarged boxes). The box and enlargement in the top left corner of the main image shows the unlabeled adherens junction. (C) Costaining for β-catenin (red) or p120 catenin (red) and the centrosome (pericentrin; green, arrows). Neither catenin localized to the centrosome. Scale bars: 10 μm (fluorescence micrographs), 5 μm (main electron micrograph), 2 μm (enlarged electron micrographs).
For organelles involved in protein biosynthesis, partial co-distribution of E-cadherin immunostaining was seen with subdomains of the endoplasmic reticulum, as illustrated by protein disulfide isomerase (PDI) costaining (Fig. 7). No codistribution was found with the cis Golgi marker GM 130, however (Fig. 7). E-cadherin immunoreactivity surrounded the Golgi but was overtly absent from the organelle itself. Similar outcomes were obtained with antibodies to marker proteins (P230, GS28) of other Golgi regions (not shown).
E-cadherin showed partial codistribution with all three major degradative organelles in RPE cultures: proteasomes identified by S20α, autophagosomes identified by MAPILC3α, and lysosomes identified by LAMP 2 (Fig. 8).
Figure 8.
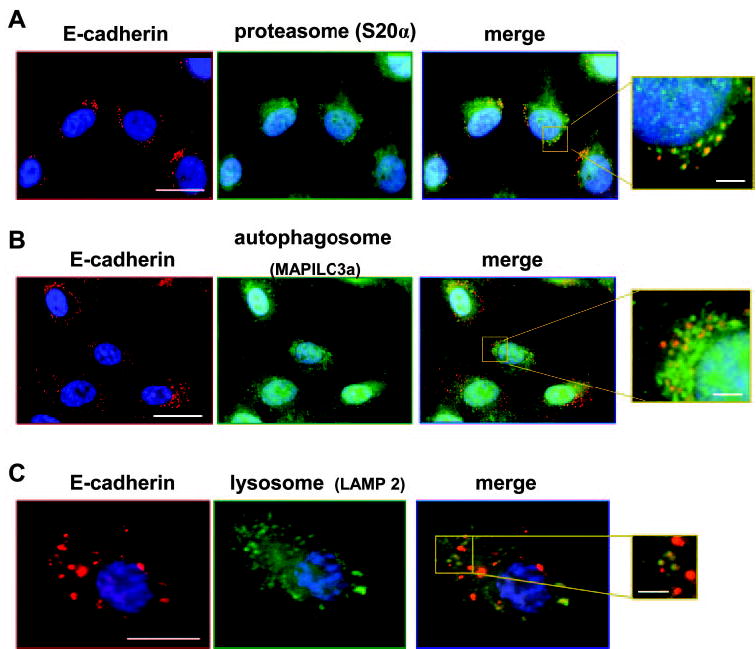
hTERT-RPE-1 cells at 30 hours after plating costained for E-cadherin (clone 36, red) and organelle markers (green) for (A) the proteasome (S20α), (B) the autophagosome (MAPILC3a), and (C) the lysosome (LAMP2). As shown in the enlarged merged images, a subset of the E-cadherin-stained granules colocalized with each organelle (yellow). Scale bars: 20 μm (low magnification images), 2 μm (enlargements).
No E-cadherin codistribution was found with early endosomes (identified by EEA1 staining) or peroxisomes (identified by catalase staining) (not shown). However, compelling evidence for codistribution was found with two unexpected compartments: mitochondria and centrosomes. The mitochondrial membrane marker protein ATP synthase α shows a ramifying tubular network of mitochondria in early RPE cultures. Cigar-shaped E-cadherin immunostaining colocalizes with parts of the mitochondrial system, not clearly within the organelle network itself but closely apposed to it (Fig. 9). Treatment of cells with the ATP synthesis inhibitor antimycin A changes the phenotype of the mitochondrial network to curved profiles. E-cadherin coimmunostaining shows a similar altered appearance after antimycin A treatment confirming a close association with mitochondria (Fig. 9).
Figure 9.
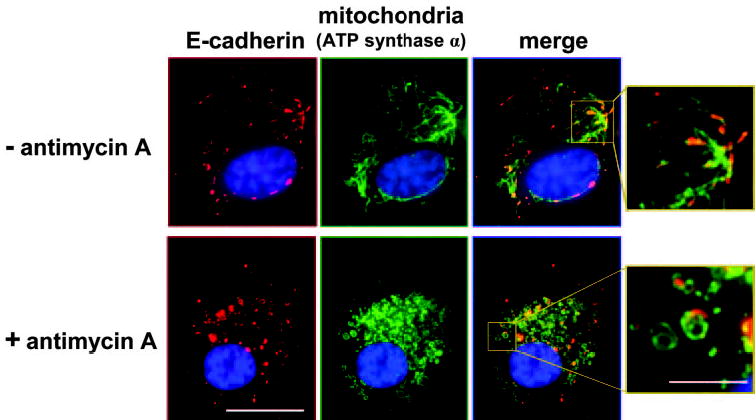
hTERT-RPE-1 cells at 30 hours after plating co-stained for E-cadherin (clone 36, red) and an organelle marker (green) for mitochondria (ATP synthase α), without and with treatment with antimycin A. As shown in the enlarged merges, E-cadherin is closely associated with parts of the mitochondrial network. Scale bars: 20 μm (low-magnification images), 5 μm (enlargements).
E-cadherin also localizes to a discrete juxtanuclear dot, sometimes appearing as a doublet, that codistributes with markers of the centrosome (Fig. 10). E-cadherin staining of the centrosome is not found in all RPE cells in the culture, but it is widespread among cells and often the one-dot-per-cell pattern is the only detectable E-cadherin staining (Fig. 2, 24-hour time point). Although HECD-1 E-cadherin antibodies do not label the centrosome, several E-cadherin antibodies codistribute with this structure including clone 36 (Fig. 10), H-108 (Fig. 10) and ab15148 (not shown). Immunoelectron microscopy confirms E-cadherin immunoreactivity localizing to unidentified electron-dense granules in the pericentriolar region (Fig. 10). Catenins, proteins that complex with cadherins, do not codistribute with E-cadherin at the centrosome or any other organellar location, distributing rather to junctional sites as shown for β-catenin and p120 (Fig. 10).
Discussion
E-cadherin protein has been identified only in postconfluent human RPE cultures,3 which suggested that its expression may be developmentally delayed. However, we found in this study that the E-cadherin gene is constitutively expressed by RPE cells regardless of culture time. Further, the gene is expressed in two immortalized cell lines (ARPE-19 and hTERT-RPE1) in which we have not seen junctional protein at any culture interval (not shown). In early cultures E-cadherin protein is difficult to detect. When observed, it localizes not to junctions but to perinuclear granules where it accumulates transiently, at low levels, and reproducibly only under tightly controlled plating conditions.
Despite the nonjunctional locations in RPE cells, several lines of evidence indicate that immunoreactive protein is E-cadherin. Similar staining patterns were seen with multiple E-cadherin antibodies and in all types of RPE cultures that were examined, including two immortalized human RPE lines and RPE cells propagated from human donor eyes. Further, both endogenous protein and the product of an exogenous E-cadherin transgene localized to nonjunctional sites. The distribution of E-cadherin in RPE cells was clearly different from that of the more abundant N-cadherin, which localized to forming junctions. This cadherin-type difference in distribution is consistent with our previous investigations of N- and E-cadherin coexpression in other epithelial cells.10,11 When the two proteins had a highly asymmetric levels of protein accumulation (as shown here for RPE cells), the dominant cadherin localized to junctions, but the minor cadherin did not.
The partial codistribution of E-cadherin with the biosynthetic compartment (endoplasic reticulum [ER]), the marked reduction in overall E-cadherin staining when protein synthesis is inhibited, and the presence on protein blots of a 135-kDa immunoreactive peptide, which is consistent with the pro form of E-cadherin,13 also indicate that E-cadherin protein is synthesized by early cultures of RPE. In other cells, the E-cadherin precursor is processed to the mature 120-kDa peptide by a convertase and the protein binds to β-catenin, which facilitates trafficking to surface membranes (for review, see Ref. 14) and may protect the cytoplasmic domain of the protein from proteolysis.15 These events may not occur efficiently in early RPE cultures, however, as indicated by the absence of the 120-kDa form of E-cadherin and the failure of β-catenin (or other catenins) to codistribute with E-cadherin at any of its nonjunctional sites. The distribution of β-catenin and p120 were selected for demonstration in this study because the former catenin associates early in the biosynthetic pathway with E-cadherin, and the latter associates early with N-cadherin.14 Because N-cadherin is the dominant cadherin of RPE cells and the temporal sequence of catenin binding could be cell rather than cadherin specific, p120 could perhaps codistribute early with newly synthesized E-cadherin in RPE cells. However, no catenin was found to codistribute with nonjunctional E-cadherin in RPE cells. If E-cadherin in RPE cells is not processed and not associated with its binding partners, it may be targeted for degradation, which would explain its codistribution with degradative organelles and its manifestation as multiple lower mass peptides on protein blots.
The enzymes responsible for E-cadherin proteolysis are not well known, and most information comes from studies simulating pathologic states involving junction breakdown. The ectodomain of E-cadherin can be cleaved by plasmin16 and by extracellular matrix metalloproteinases,17,18 but these enzymes are not likely to be involved in E-cadherin degradation in early RPE cultures because there is no evidence that the protein reaches the cell surface. The cytoplasmic domain of E-cadherin in apoptotic cells can be cleaved by caspases,18,19 by a presenilin-1/γ-secretase activity,20 and by an unidentified protease(s) that removes the β-catenin binding domain.21 E-cadherin is sensitive to calpain22 and to an unidentified lytic activity shown in models of ischemia/ATP depletion.23 These enzyme activities collectively generate at least 10 different molecular mass immunoreactive E-cadherin peptides, including peptides of the sizes seen in this study in RPE cells. However, it is not clear whether any of these enzymes is involved in E-cadherin degradation in the RPE or, for that matter, in other normal epithelial cells in which the protein is constitutively synthesized and turned over. If E-cadherin is unprocessed and misfolded in RPE cells, it may be degraded by alternative mechanisms such as the ER-associated degradation (ERAD) pathway,24 which could account for some of the E-cadherin codistribution with ER. We have attempted to pursue identifying the sequence of cleavages that produces truncated forms of E-cadherin in RPE cells but are finding it a considerable challenge. The amount of protein is low and difficult to extract in sufficient amounts to perform traditional pulse–chase immunoprecipitation experiments. Indeed, we have been surprised at the low E-cadherin protein retrieval in RPE cell extracts, since immunostaining for E-cadherin is robust at its peak (30 hours after plating), when the amount of antibody (especially clone 36) needed to obtain a nonjunctional staining signal in RPE cells is the same as used to detect the prominent junctional E-cadherin seen in cells like MDCK. We attribute the low E-cadherin yields in protein extracts of RPE cells to an association of the protein largely with subcellular sites where degradative enzymes are sequestered, which makes it difficult to isolate intact peptides before they are further degraded.
The notion that E-cadherin is targeted for degradation in RPE cells is supported by the partial codistribution of the protein with lysosomes, autophagosomes, and proteasomes. As indicated earlier, part of the ER association could also represent protein targeted for degradation, and the unusual localization with the centrosome may similarly represent a protein degradation site. Misfolded or incompletely processed proteins targeted by ubiquitination to the proteasome, especially in cells expressing large amounts of mutant membrane protein, have been shown to localize to the centrosome to form aggresomes.25–28 Perhaps even low-abundance, misfolded proteins, as we suspect for E-cadherin in RPE cultures, traffic to this site. The centrosomal distribution of E-cadherin is not specific to the RPE (our unpublished observations, 2004) but is also found in human epithelial cell lines A431 and Caco-2 (where it is easily overlooked because of prominent junctional staining), but not in the dog-derived cell line MDCK, suggesting perhaps a species difference. As an alternative to undergoing degradation at the centrosome, E-cadherin at this site may be performing an unrecognized function. A growing number of novel proteins, notably tumor suppressors, have been localized to the centrosome.29
The association of E-cadherin immunoreactive peptides with regions of the mitochondrial network is also currently unexplained. Other proteins have recently been identified in this unexpected compartment.30 Mitochondria are known to have close contact sites with the ER,31–34 and so perhaps the E-cadherin staining that is apposed to mitochondria is ER associated. Investigations of the close association between these organelles are primarily focused on calcium signaling within cells to regulate such events as ATP synthesis, apoptosis, and mitochondrial motility.31,33,34 It is not clear what function, if any, E-cadherin has at this site. We have attempted to triple stain for E-cadherin and the two organelles, but identifying regions of real contact between the two organelles is complicated by the fact that organelles are subcompartmentalized with a nonuniform protein distribution.35 Even markers for the same organelle show incomplete colocalization. Whether E-cadherin localizes to ER regions apposed to mitochondria therefore remains speculative.
Summary
In explaining the behavior of E-cadherin in RPE cells, one has to account for the absence of junctional protein in early cultures despite expression of the gene (as shown herein), the slow accumulation of protein at junctions in vitro,3 and the cell– cell heterogeneity in junctional E-cadherin both in situ and in postconfluent cultures.3,4 Our working hypothesis to explain these observations is that E-cadherin protein is constitutively synthesized at low levels in RPE cells, but incompletely processed and broadcast to subcellular sites where it undergoes degradation by multiple mechanisms. Transient detection in early cultures is due to identification of a narrow window of time when biosynthesis slightly exceeds degradation. This allows the detection of truncated forms of the protein, which are revealed as various low molecular mass peptides by E-cadherin antibodies directed against different epitopes. In some cells small amounts of E-cadherin escape degradation, traffic successfully to the cell surface, and over time gradually become stabilized at junctions, accounting for the junctional location of the protein in patches of cells in late confluence.3 Differences among individual cells in levels of biosynthesis and in the multiple mechanisms responsible for proteolysis would be expected to produce an RPE monolayer that is a mosaic with regard to the amount of junctional E-cadherin.36
Although the steps in the process of E-cadherin synthesis and turnover in RPE cells are not yet defined, the result is that RPE cells accumulate little E-cadherin during early stages of epithelial morphogenesis in vitro and perhaps in situ. As a consequence, E-cadherin’s ability to induce a basolateral polarity of Na,K-ATPase5,6 may be suppressed, which could be essential to at least permit the sodium pump to achieve an apical polarity, which is the normal distribution for the RPE.7–9
Footnotes
Supported by National Eye Institute Grants R01 EY015284 (JMB) and P30 EY01931, the Posner Foundation, the Coleman Charitable Foundation (Milwaukee, WI), and an unrestricted grant from Research to Prevent Blindness, Inc.
Disclosure: J.M. Burke, None; J. Hong, None
References
- 1.Wheelock MJ, Johnson KR. Cadherins as modulators of cell phenotype. Ann Rev Cell Dev Biol. 2003;19:207–235. doi: 10.1146/annurev.cellbio.19.011102.111135. [DOI] [PubMed] [Google Scholar]
- 2.McKay BS, Irving PE, Skumatz CM, Burke JM. Cell-cell adhesion molecules and the development of an epithelial phenotype in cultured human retinal pigment epithelial cells. Exp Eye Res. 1997;65:661–671. doi: 10.1006/exer.1997.0374. [DOI] [PubMed] [Google Scholar]
- 3.Burke JM, Cao F, Irving PE, Skumatz CMB. Expression of E-cadherin by human retinal pigment epithelium: delayed expression in vitro. Invest Ophthalmol Vis Sci. 1999;40:2963–2970. [PubMed] [Google Scholar]
- 4.Burke JM, Cao F, Irving PE. High levels of E-/P-cadherin: correlation with decreased apical polarity of Na-K ATPase in bovine RPE cells in situ. Invest Ophthalmol Vis Sci. 2000;41:1945–1952. [PubMed] [Google Scholar]
- 5.Nelson WJ, Shore EM, Wang AZ, Hammerton RW. Identification of a membrane-cytoskeletal complex containing the cell adhesion molecule uvomorulin (E-cadherin), ankyrin, and fodrin in Madin-Darby canine kidney epithelial cells. J Cell Biol. 1990;110:349–357. doi: 10.1083/jcb.110.2.349. [DOI] [PMC free article] [PubMed] [Google Scholar]
- 6.Marrs JA, Andersson-Fisone C, Jeong MC, et al. Plasticity in epithelial cell phenotype: modulation by expression of different cadherin cell adhesion molecules. J Cell Biol. 1995;129:507–519. doi: 10.1083/jcb.129.2.507. [DOI] [PMC free article] [PubMed] [Google Scholar]
- 7.Bok D. Autoradiographic studies on the polarity of plasma membrane receptors in RPE cells. In: Hollyfield J, ed. The Structure of the Eye. New York: Elsevier North Holland; 1982:247–256.
- 8.Okami T, Yamamoto A, Omori K, Takada T, Uyama M, Tashiro Y. Immunocytochemical localization of Na, K-ATPase in rat retinal pigment epithelial cells. J Histochem Cytochem. 1990;38:1267–1275. doi: 10.1177/38.9.2167328. [DOI] [PubMed] [Google Scholar]
- 9.Rizzolo LJ. The distribution of Na/K ATPase in the retinal pigmented epithelium from chicken embryo is polarized in vivo but not in primary cell culture. Exp Eye Res. 1990;51:435–446. doi: 10.1016/0014-4835(90)90156-o. [DOI] [PubMed] [Google Scholar]
- 10.Youn Y-H, Hong J, Burke JM. Endogenous N-cadherin in a sub-population of MDCK cells: distribution and catenin complex composition. Exp Cell Res. 2005;303:275–286. doi: 10.1016/j.yexcr.2004.09.023. [DOI] [PubMed] [Google Scholar]
- 11.Youn Y-H, Hong J, Burke JM. Cell Phenotype in normal epithelial cell lines with high endogenous N-cadherin: comparison of RPE to an MDCK subclone. Invest Ophthalmol Vis Sci. 2006;47:2675–2685. doi: 10.1167/iovs.05-1335. [DOI] [PMC free article] [PubMed] [Google Scholar]
- 12.Laemmli UK. Cleavage of structural proteins during the assembly of the head of bacteriophage T4. Nature. 1970;227:680–685. doi: 10.1038/227680a0. [DOI] [PubMed] [Google Scholar]
- 13.Shore EM, Nelson WJ. Biosynthesis of the cell adhesion molecule uvomorulin (E-cadherin) in Madin-Darby canine kidney epithelial cells. J Biol Chem. 1991;266:19672–19780. [PubMed] [Google Scholar]
- 14.Bryant DM, Stow JL. The ins and outs of E-cadherin trafficking. Trends Cell Biol. 2004;14:427–434. doi: 10.1016/j.tcb.2004.07.007. [DOI] [PubMed] [Google Scholar]
- 15.Huber AH, Stewart DB, Laurents DV, Nelson WJ. The cadherin cytoplasmic domain is unstructured in the absence of β-catenin. J Biol Chem. 2001;276:12301–12309. doi: 10.1074/jbc.M010377200. [DOI] [PubMed] [Google Scholar]
- 16.Ryniers F, Stove C, Goethals M, et al. Plasmin produces an E-cadherin fragment that stimulates cancer cell invasion. Biol Chem. 2002;383:159–165. doi: 10.1515/BC.2002.016. [DOI] [PubMed] [Google Scholar]
- 17.Ito K, Okamoto I, Araki N, et al. Calcium influx triggers the sequential proteolysis of extracellular and cytoplasmic domains of E-cadherin, leading to the loss of β-catenin from cell-cell contacts. Oncogene. 1999;8:7080–7090. doi: 10.1038/sj.onc.1203191. [DOI] [PubMed] [Google Scholar]
- 18.Steinhusen U, Weiske J, Badock V, Taubert R, Bommert K, Huber O. Cleavage and shedding of E-cadherin after induction of apoptosis. J Biol Chem. 2001;276:4972–4980. doi: 10.1074/jbc.M006102200. [DOI] [PubMed] [Google Scholar]
- 19.Schmeiser K, Grand R. The fate of E- and P-cadherin during the early stages of apoptosis. Cell Death Differ. 1999;6:377–386. doi: 10.1038/sj.cdd.4400504. [DOI] [PubMed] [Google Scholar]
- 20.Marambaud P, Shioi J, Serban G, et al. A presenilin-1/γ-secretase cleavage releases the E-cadherin intracellular domain and regulates disassembly of adherens junctions. EMBO J. 2002;211:948–1956. doi: 10.1093/emboj/21.8.1948. [DOI] [PMC free article] [PubMed] [Google Scholar]
- 21.Vallorosi CJ, Day KC, Zhao X, et al. Truncation of the β-catenin binding domain of E-cadherin precedes epithelial apoptosis during prostate and mammary involution. J Biol Chem. 2000;275:3328–3334. doi: 10.1074/jbc.275.5.3328. [DOI] [PubMed] [Google Scholar]
- 22.Rios-Doria J, Day KC, Kuefer R, et al. The role of calpain in the proteolytic cleavage of E-cadherin in prostate and mammary epithelial cells. J Biol Chem. 2003;278:1372–1379. doi: 10.1074/jbc.M208772200. [DOI] [PubMed] [Google Scholar]
- 23.Bush KT, Tatsuo T, Nigam SK. Selective degradation of E-cadherin and dissolution of E-cadherin-catenin complexes in epithelial ischemia. Am J Physiol. 2000;278:F847–F852. doi: 10.1152/ajprenal.2000.278.5.F847. [DOI] [PubMed] [Google Scholar]
- 24.Vashist S, Ng DTW. Misfolded proteins are sorted by a sequential checkpoint mechanism of ER quality control. J Cell Biol. 2004;165:41–52. doi: 10.1083/jcb.200309132. [DOI] [PMC free article] [PubMed] [Google Scholar]
- 25.Wigley WC, Fabunmi RP, Lee MG, et al. Dynamic association of proteasomal machinery with the centrosome. J Cell Biol. 1999;145:481–490. doi: 10.1083/jcb.145.3.481. [DOI] [PMC free article] [PubMed] [Google Scholar]
- 26.Fabunmi RP, Wigley WC, Thomas PJ, DeMartino GN. Activity and regulation of the centrosome-associated proteasome. J Biol Chem. 2000;275:409–413. doi: 10.1074/jbc.275.1.409. [DOI] [PubMed] [Google Scholar]
- 27.Hyman AA. Centrosomes: sic transit gloria centri. Curr Biol. 2000;10:R276–R278. doi: 10.1016/s0960-9822(00)00406-1. [DOI] [PubMed] [Google Scholar]
- 28.Saliba RS, Munro PM, Luthert PJ, Cheetham ME. The cellular fate of mutant rhodopsin: quality control, degradation and aggresome formation. J Cell Sci. 2002;115:2907–2918. doi: 10.1242/jcs.115.14.2907. [DOI] [PubMed] [Google Scholar]
- 29.Fisk HA, Mattison CP, Winey M. Centrosomes and tumour suppressors. Curr Opin Cell Biol. 2002;14:700–705. doi: 10.1016/s0955-0674(02)00385-x. [DOI] [PubMed] [Google Scholar]
- 30.Paraoan L, Ratnayaka JA, Spiller DG, Hiscott P, White MRH, Grierson I. Unexpected intracellular localization of the AMD-associated cystatin C variant. Traffic. 2004;5:884–895. doi: 10.1111/j.1600-0854.2004.00230.x. [DOI] [PubMed] [Google Scholar]
- 31.Rutter GA, Rizzuto R. Regulation of mitochondrial metabolism by ER Ca+ release: an intimate connection. Trends Biochem Sci. 2000;25:215–221. doi: 10.1016/s0968-0004(00)01585-1. [DOI] [PubMed] [Google Scholar]
- 32.Wang HJ, Guay G, Pogan L, Sauve R, Nabi IR. Calcium regulates the association between mitochondria and a smooth sub domain of the endoplasmic reticulum. J Cell Biol. 2000;15:1489–1498. doi: 10.1083/jcb.150.6.1489. [DOI] [PMC free article] [PubMed] [Google Scholar]
- 33.Yi M, Weaver D, Hajnóczky G. Control of mitochondrial motility and distribution by the calcium signal: a homeostatic circuit. J Cell Biol. 2004;167:661–672. doi: 10.1083/jcb.200406038. [DOI] [PMC free article] [PubMed] [Google Scholar]
- 34.Simpson PB, Mehotra S, Langley D, Sheppard CA, Russell JT. Specialized distributions of mitochondria and endoplasmic reticulum proteins define Ca2+ wave amplification sites in cultured astrocytes. J Neurosci Res. 1998;52:672–683. doi: 10.1002/(SICI)1097-4547(19980615)52:6<672::AID-JNR6>3.0.CO;2-5. [DOI] [PubMed] [Google Scholar]
- 35.Pfeffer S. Membrane domains in the secretory and endocytic pathways. Cell. 2003;112:507–517. doi: 10.1016/s0092-8674(03)00118-1. [DOI] [PubMed] [Google Scholar]
- 36.Burke JM, Hjelmeland LM. Mosaicism of the retinal pigment epithelium: seeing the small picture. Mol Interv. 2005;5:241–245. doi: 10.1124/mi.5.4.7. [DOI] [PubMed] [Google Scholar]


