Abstract
Purpose
Unlike most monolayer epithelial cells, cultured RPE are competent to form a zonular adhesion of N- rather than E-cadherin. To determine whether other normal epithelial cells do likewise, cells with high endogenous N-cadherin were cloned from the typically E-cadherin dominant epithelial line Madin-Darby canine kidney cells (MDCK) to analyze cell and junction phenotype in the presence of N-cadherin.
Methods
A MDCK subclonal line, clone-YH, was selected for high endogenous N-cadherin and was compared with the RPE line hTERT-RPE1 with regard to cell phenotype, cadherin gene expression and cadherin protein distribution, glycosylation state, and catenin complex composition.
Results
In early cultures, hTERT-RPE1 cells are moderately epithelioid with junctional N-cadherin, but clone-YH cells are initially highly fusiform with N-cadherin in multiple sites. With time, N-cadherin in clone-YH becomes deglycosylated, resistant to detergent extraction, and zonular, and cells become epithelioid. Treatment with the N-glycosylation inhibitor tunicamycin induces an epithelioid phenotype in clone-YH, like time in culture but disrupts the hTERT-RPE1 phenotype. N-cadherin traffics to surface membranes and complexes with catenins regardless of cell type or glycosylation state, although catenin complex composition varied, showing enriched α-catenin under the cell-type-specific conditions in which N-cadherin was junctional. Clone-YH continued to express E-cadherin as a very minor cadherin, which trafficked to membranes but did not accumulate at junctions.
Conclusions
RPE cells are not unique in localizing N-cadherin to a zonular adhesion typical of a monolayer epithelium, because even epithelial cells derived from a typically E-cadherin dominant line (clone-YH) form a zonular N-cadherin junction if the protein is abundant. However, there are cell and cadherin differences in mechanisms of cadherin accumulation in a zonular pattern, and a previously unrecognized cell-type-specific role for protein glycosylation in epithelial phenotype development.
N - and E-cadherin are members of a superfamily of transmembrane glycoproteins that mediate calcium-dependent intercellular adhesion at adherens junctions and play critical roles in determining cell phenotype.1–4 Cadherins form the adherens junction by associating with β-catenin or plakoglobin, and with the actin binding protein α-catenin. Other proteins, including the catenin p120, also complex with cadherins to modulate junctional stability.5–8
Cadherins of different types form cell-type-specific adherens junctions with various morphologies, such as puncta, plaques, or zonular rings. Most monolayer epithelial cells preferentially express E-cadherin, which forms an adherens junction that is zonular, comprising part of the apicolateral junctional complex that is required for cells to exhibit an epithelial phenotype. E-cadherin adhesion was recognized many years ago as a seminal triggering event for the formation of the epithelial junctional complex.9 Many subsequent investigations, continuing to the present day, have been conducted to determine downstream events between E-cadherin adhesion and the acquisition of an epithelial phenotype, and, although the process is not fully known, E-cadherin adhesion is a critical component. Compared with most monolayer epithelial cells, RPE cells are unusual in that they express N- rather than E-cadherin as their normal dominant cadherin.10,11 Cultured RPE cells use N-cadherin to form a zonular junction by a process that is slow11,12 compared with the more rapid formation of the E-cadherin adhesion in other normal epithelial cells, for example, Madin-Darby canine kidney cells (MDCK).13,14 It is not clear if RPE cells are unique among monolayer epithelial cells in their ability to generate a stable, zonular, epithelial-type junction by using N-cadherin. This question arises because N-cadherin is absent from most normal epithelial cells, but when it is found in carcinoma-derived epithelial cells, N-cadherin dysregulates rather than supports zonular junction formation, inducing a motile, mesenchymal phenotype.3,15,16
We have been developing other models of normal monolayer epithelial cells in which E-cadherin typically dominates to determine whether they are competent to generate a zonular adhesion of N-cadherin. The intent is to develop a comparative model for the RPE in which to pursue mechanisms of cell-type-specific junction development. In a previous study, we characterized a trypsin-sensitive subpopulation of MDCK cells (TS-MDCK) that expressed low levels of endogenous N-cadherin in addition to undiminished levels of E-cadherin.17 TS-MDCK cells were more phenotypically fusiform and more motile than the parental MDCK line, which suggested that small amounts of N-cadherin disrupt rather than support epithelial phenotype in normal MDCK epithelial cells, similar to its behavior in carcinoma cells.
The disadvantage of TS-MDCK cells for our purpose is that N-cadherin is only a minor cadherin in these cells. E-cadherin continues to dominate, and cadherin dosage may matter. Here we report a follow-up investigation in which we developed a subclonal line from TS-MDCK, named clone-YH, which was characterized with regard to cell phenotype and cadherin expression, and was found to express N-cadherin as the dominant endogenous cadherin. Comparative analyses of clone-YH cells and the human RPE cell line hTERT-RPE1 demonstrated that both cell types were competent to develop an epithelial phenotype with N-cadherin localizing to and stabilizing at a zonular adhesion. However, phenotype development differs in the two cell lines as indicated by studies of cell-type differences in protein N-glycosylation.
Materials and Methods
Antibodies and Reagents
Mouse monoclonal antibodies against the following proteins were used: E-cadherin, N-cadherin, β-catenin, plakoglobin, p120 (BD Trans-duction Laboratories, Lexington, KY), and α-catenin (Becton Dickinson and Company, San Jose, CA). Rabbit polyclonal antibodies against N-cadherin (Santa Cruz Biotechnology Inc., Santa Cruz, CA) were also used. Appropriate rhodamine-, fluorescein-, or horseradish peroxidase-conjugated secondary antibodies were from Jackson ImmunoResearch Laboratories, Inc. (West Grove, PA).
All reagents were purchased from Sigma-Aldrich (St. Louis, MO) unless otherwise indicated.
Cell Culture
Two cell lines derived from normal epithelia were purchased: the telomerase immortalized human RPE line hTERT-RPE1 (Clontech Laboratories, Inc., Palo Alto, CA), and the canine kidney-derived line MDCK (strain II, American Type Culture Collection, Manassas, VA). A subclonal cell line of MDCK was derived by a two-step protocol involving selection for the MDCK subpopulation TS-MDCK17 followed by generating subclones with cloning discs (Scienceware/Bel-Art Products, Pequannock, NJ) by standard methods. After cell propagation, a subclone with highly fusiform phenotype (named clone-YH) was expanded and characterized here.
All cell lines were maintained in MEM supplemented with 10% fetal bovine serum. For experiments, cells were plated at subconfluent density and usually were analyzed in early or late culture, at 24 hours or 7 days after plating, respectively.
For experiments in which early cultures were treated with the N-glycosylation inhibitor tunicamycin or the apoptosis inducer staurosporine, the agents were added after cell attachment (at 6 hours after plating) and incubations were continued for up to 18 hours. The O-glycosylation inhibitor benzyl-N-acetyl-α-galactosaminide (BAG) was added at the time of plating, with incubations up to 24 hours. Times of incubation and agent concentrations are given in the Results section.
RNA Isolation and Semiquantitative RT-PCR Analysis
E- and N-cadherin gene expression in the cell lines was examined by isolating total RNA from early cultures with an extraction kit (RNAqueous-4PCR; Ambion, Inc., Austin, TX) for semiquantitative RT-PCR analysis, as previously described.17 Sequences of the primer pairs specific for E-cadherin, N-cadherin, and glyceraldehyde-3-phosphate dehydrogenase (GAPDH) were previously published.17 PCR products were subjected to electrophoresis on 2% agarose gels.
Protein Extraction, Biotinylation, Immunoblotting, and Immunoprecipitation
Cell cultures were lysed in a 1X Laemmli18 electrophoresis sample buffer to produce whole-cell extracts or were extracted to generate separate Triton-soluble and -insoluble (largely cytoskeletally associated) protein fractions by published methods.11,17
Cell-surface proteins were detected with a membrane impermeable reagent (EZ-Link sulfo-NHS-SS-biotin; Pierce Chemical, Rockford, IL), followed by precipitating biotinylated proteins with streptavidin beads (Ultralink; Pierce), as previously described.17 Precipitates were immunoblotted with antibodies to E- and N-cadherin.
Immunoblotting was performed by published methods17 after electrophoresis with 7.5% or 10% separating gels with band detection by enhanced chemiluminescence (Pierce). Immunoprecipitation methods were also previously described.17 Here, products were blotted with antibodies to cadherins and catenins. In some experiments, catenin-band density was quantified by scanning densitometry with a densitometer (Alpha Innotech FluoroChem 8900 densitometer; Key Scientific, Inc., Mt. Prospect, IL). Densities are expressed in arbitrary units and are normalized to the cadherin-band density in the same lane on the transblot, which was cut to allow probing for both the cadherin and the catenin in the same sample.
Immunofluorescence Microscopy and Confocal Imaging
For protein localization, cells were fixed in paraformaldehyde, then immunostained with antibodies to N- or E-cadherin, as previously described.17 Nuclei were visualized with DAPI (4′,6–diamidino-2-phenylindole) for epifluorescence microscopy or stained (SYTOX Orange; Molecular Probes Invitrogen Detection Technologies, Eugene, OR) for confocal imaging. For epifluorescence microscopy, images were captured by using diagnostic software (Spot RT; Diagnostic Instruments, Sterling Heights, MI). Confocal microscopy was performed with a laser scanning confocal microscope (Leica TCS SP2; Leica Microsystems, Wetzlar, Germany) with cross-sectional Z-scans and 3-dimensional reconstructions generated by using the system’s software. Images were assembled and manipulated with photo editing software (Adobe Photoshop CS; Adobe Systems, Inc., San Jose, CA).
Glycosidase Treatment of Cell Lysates
Cells extracts containing 20 μg protein were boiled in denaturing buffer (5% SDS, 10% β-mercaptoethanol) at 100°C for 10 minutes to inactivate endogenous enzymes. Samples were incubated for 1 hour at 37°C with 500 mU endoglycosidase H (endo) or peptide N-glycosidase F (PNG) (both from New England BioLabs, Inc., Beverly, MA), followed by electrophoresis and immunoblotting with antibodies to N- or E-cadherin. As a positive control for the digestion, 20 μg RNase B was similarly treated, and electrophoretic bands were visualized by silver staining.
Assays for Cytotoxicity
To confirm that the concentrations of tunicamycin used here to induce protein deglycosylation were not cytotoxic, three protocols were performed. (1) The MTT (3-[4,5-dimethylthiazol-2-yl]-2,5-diphenyltetrazolium bromide) assay was used as a general indicator of cytotoxicity by adding MTT (0.25 mg/mL) to control or tunicamycin-treated cultures in 96-well plates, followed by incubation for 90 minutes at 37°C. The absorbance of blue formazan precipitates was read at 560 nm in a plate reader, and data were reported in optical density (OD) units as the means (± SD) of 20 replicate wells per control or treatment group. (2) Annexin V staining was used as one measure of apoptosis by incubating control, tunicamycin-, or staurosporine-treated (a known apoptosis inducer19,20) cultures for 15 minutes at room temperature in a 1.0% solution of FITC-annexin V. Images were captured at ×40 in an epifluorescence microscope, and staining was quantified by using densitometer software (Alpha Innotech; Key Scientific, Inc., Mt. Prospect, IL). Data were expressed in arbitrary intensity units per cell as the means (± SD) of 35 microscope fields (approximately 650–850 cells) per control or treatment group. (3) As a second measure of apoptosis, oligonucleosomal DNA fragmentation was analyzed by isolating DNA from untreated, tunicamycin-, or staurosporine-treated cultures by using a detection kit (Quick Apoptotic DNA Ladder Detection Kit; Bio-Source International, Inc., Camarillo, CA). Samples were subjected to horizontal agarose gel electrophoresis and were visualized by ethidium bromide staining.
Results
Cell Phenotype, Cadherin Expression, and Distribution
The clone-YH line subcloned from MDCK has a highly fusiform phenotype in subconfluent cultures, which differs from moderately epithelioid hTERT-RPE1 cells and from highly epithelioid MDCK cells, which form cohesive colonies (Fig. 1A). Similar to hTERT-RPE1 cells but unlike the parental MDCK line, clone-YH cells express the N-cadherin gene (Fig. 1B). Clone-YH cells continue to express the E-cadherin gene as well (Fig. 1C).
Figure 1.
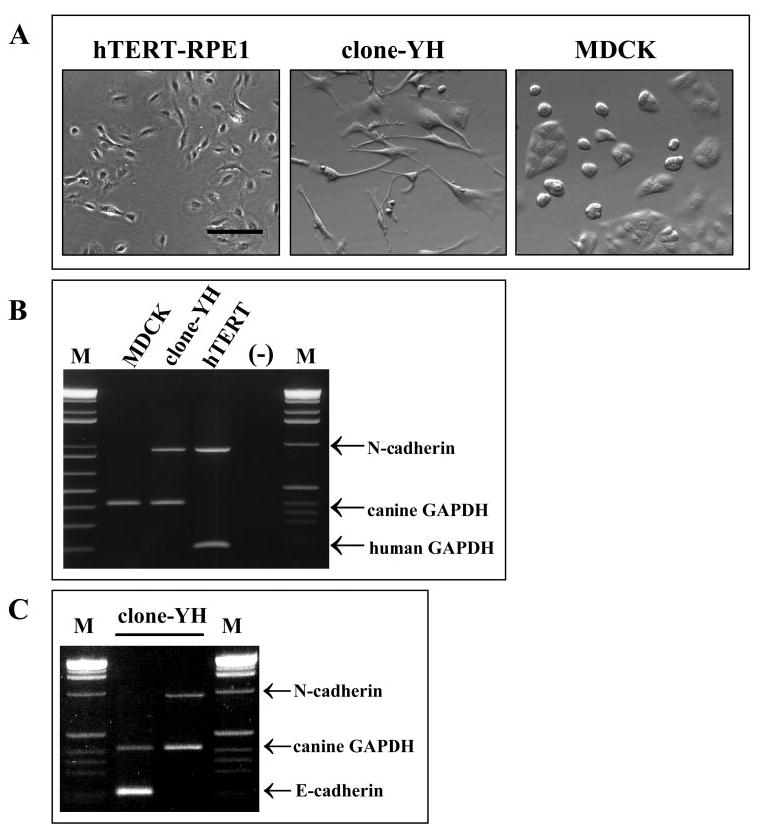
Cell phenotype and cadherin gene expression in three epithelial cell lines. (A) Phase contrast microscopy of subconfluent cultures of hTERT-RPE1, clone-YH, and MDCK cells. Scale bar, 100 μm. (B) RT-PCR analysis showing N-cadherin gene expression in clone-YH and hTERT-RPE1 but not MDCK cells. (C) Showing both N- and E-cadherin gene expression in clone-YH cells. GAPDH gene expression is also shown. M lanes show DNA standards.
N-cadherin is the dominant cadherin protein in both hTERT-RPE1 and clone-YH cells, although its distribution differs (Figs. 2, 3). N-cadherin has a typical junctional distribution in early cultures of moderately epithelioid hTERT-RPE1, localizing to sites of forming cell-cell contacts, which develop further over time as the cells pack more densely while retaining their epithelioid cell shape (Fig. 2). In contrast, N-cadherin has multiple distribution patterns in early cultures of fusiform clone-YH cells, localizing to some sites of cell contact but also distributing to free borders of cells and in various punctate patterns, including along cell processes (Fig. 3, early). With time in culture, the distribution of N-cadherin in clone-YH becomes more junctional coincident with the development of a more epithelioid phenotype (Fig. 3, late). Both cell lines, therefore, develop zonular N-cadherin and an epithelial phenotype, but the lines differ in timing and pattern of junction formation.
Figure 2.
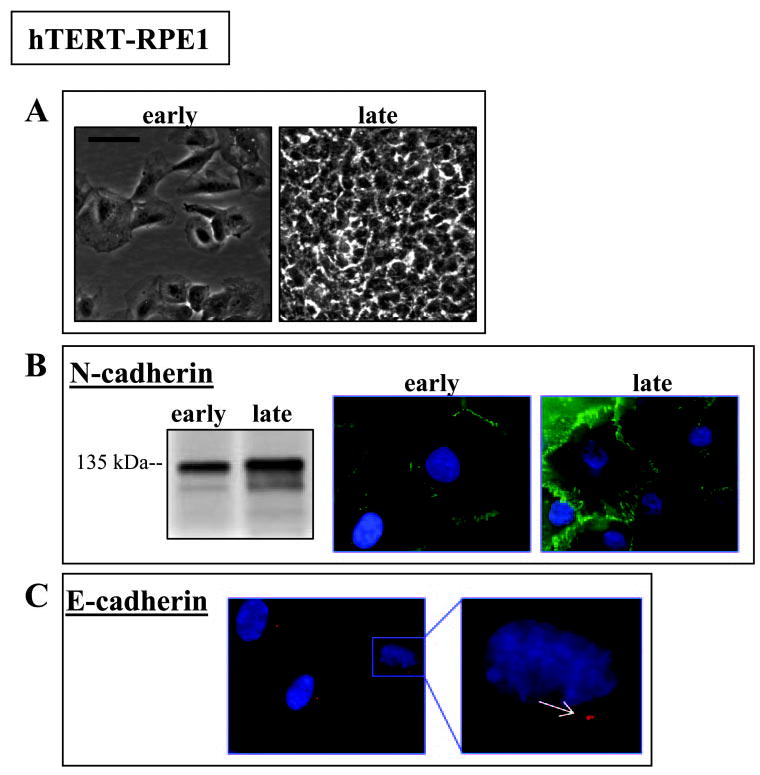
Cell phenotype and N-cadherin in early and late hTERT-RPE1 cultures (24 hours or 7 days after plating, respectively). (A) Phase contrast microscopy showing a moderately epithelioid culture phenotype at both time points. Scale bar, 50 μm. (B) At both time points, protein blotting shows N-cadherin at the expected 135 kDa migration position, and immunofluorescence microscopy shows N-cadherin distributing to junctions. (C) Immunostaining for E-cadherin to illustrate localization to the centrosome in many cells where it may appear as a doublet (arrow, inset). For fluorescence micrographs, nuclei are counterstained with DAPI. Scale bar, 20 μm.
Figure 3.
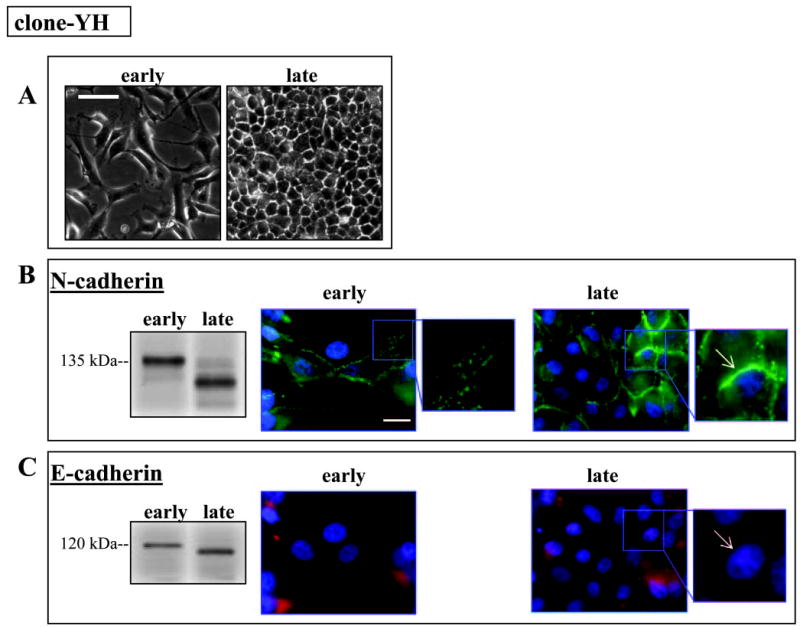
Cell phenotype and N- and E-cadherin in early and late clone-YH cultures (24 hours or 7 days after plating, respectively). (A) Phase contrast microscopy showing fusiform phenotype in early cultures and epithelioid in late cultures. Scale bar, 50 μm. (B) Protein blots showing N-cadherin at its expected 135 kDa migration position in early cultures and at a lower mass in late cultures. In early fusiform cultures, N-cadherin has multiple distribution patterns, including at sites of cell contact and in a punctate pattern in cell processes (early culture, inset). In late epithelioid cultures N-cadherin localizes to junctions (late culture, inset arrow). (C) Protein blot showing E-cadherin shifting from its predicted position (120 kDa) to a lower mass between early and late culture. Immunolocalization of E-cadherin in cells co-stained for N-cadherin shows diffuse distribution of E-cadherin at both time intervals, with no junctional distribution in epithelioid late cultures (late culture, inset arrow). For fluorescence micrographs, nuclei are counterstained with DAPI. Scale bar, 20 μm. Nuclei are counterstained with DAPI.
The N-cadherin blotting signals are similar in extracts of early cultures of both hTERT-RPE1 and clone-YH, showing the expected 135 kDa molecular mass protein (Figs. 2B, 3B). The molecular mass of N-cadherin remains unchanged in hTERT-RPE1 cells with time in culture (Fig. 2B), but, in late clone-YH cultures, when cells become more epithelioid, N-cadherin migrates as a lower mass protein (Fig. 3B).
Consistent with its origin from MDCK cells, the clone-YH cell line contains E-cadherin, but the protein levels in clone-YH are quite low, requiring approximately a 20-fold higher protein loading from clone-YH than from MDCK cell extracts to achieve even a weak E-cadherin signal on immunoblots (not shown). E-cadherin in clone-YH does not distribute to junctions. Rather, it is found in a diffuse pattern and in variable amounts among cells, regardless of the time in culture (Fig. 3C). Like N-cadherin, E-cadherin protein in clone-YH shows a time-in-culture– dependent reduction in molecular mass. In hTERT-RPE1, E-cadherin protein is largely undetectable in Western blots, although a small amount of immunoreactive E-cadherin protein localizes to a discrete dot in many cells (Fig. 2C), codistributing with the centrosome (Burke JM, et al. IOVS 2005;46:ARVO E-Abstract 3053). We used this unusual E-cadherin staining pattern as a marker for hTERT-RPE1 cells in later coculture experiments (see below).
Protein Glycosylation
The shift of cadherins to lower mass in late cultures of clone-YH but not hTERT-RPE1 raised the possibility that the proteins were deglycosylated over time in clone-YH cells. To test this possibility, preliminary experiments were conducted by using the N-glycosylation inhibitor tunicamycin to identify an effective dose that is not cytotoxic, because this agent can induce apoptosis.21,22 In early clone-YH cultures, treatment with 0.5 μg/mL tunicamycin for 18 hours deglycosylated N-cadherin (Fig. 4A) without reducing cell survival detectable by the MTT assay (Fig. 4B), or inducing apoptosis as determined by annexin V staining (Fig. 4C) or DNA fragmentation (Fig. 4D). A 20-fold higher concentration of tunicamycin (10 μg/mL) was required to produce significant MTT reductions, and a 10-fold higher concentration produced only slightly increased annexin V staining, which remained significantly less than the known apoptosis inducer staurosporine (0.5 μg/mL). Subsequent experiments (see Fig. 6) also showed ongoing cell survival after tunicamycin treatment and withdrawal, indicating that the agent was not cytotoxic.
Figure 4.
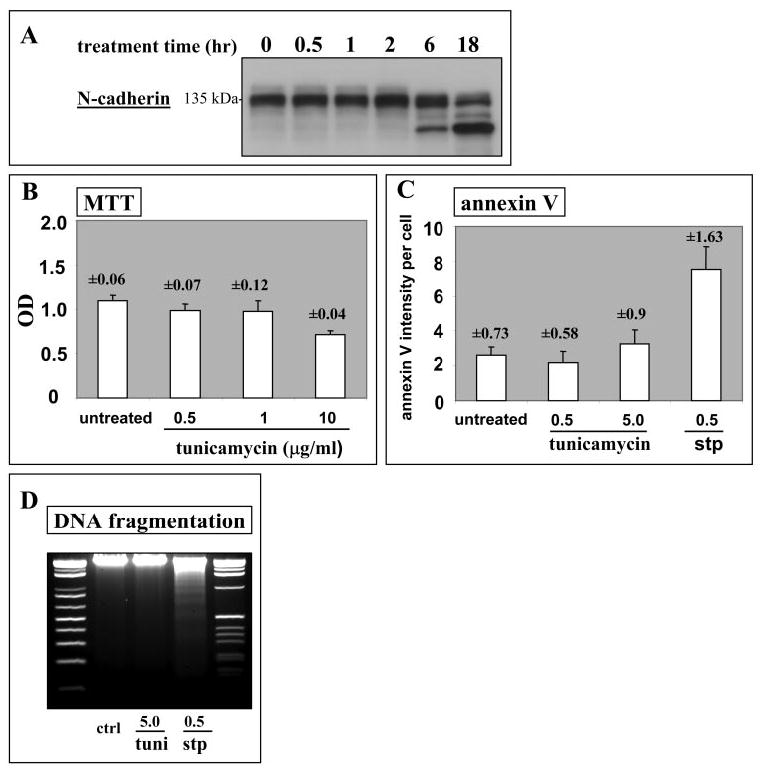
Tunicamycin treatment of clone-YH cells. (A) Time course for protein deglycosylation induced by treatment with tunicamycin at 0.5 μg/mL, illustrated for N-cadherin. (B–D) Analyses showing that tunicamycin treatment at 0.5 μg/mL for 18 hours is not cytotoxic. (B) Cell viability by using the MTT assay for cells treated for 18 hours with a range of concentrations of tunicamycin. Data are means (error bars and numbers in the figure indicate SD) for 20 replicate culture wells per group from a representative experiment. (C and D) Analyses for apoptosis by using annexin V staining (C), and DNA fragmentation (D) showing a comparison of 18-hour treatment with tunicamycin (tuni) to the known apoptosis inducer staurosporine (stp). Concentrations are given in μg/mL. For annexin V staining, data were obtained as described in the Materials and Methods section and are mean staining intensities per cell in arbitrary units (error bars and numbers in the figure indicate SD). For DNA fragmentation, the first and last lanes show DNA standards.
Figure 6.
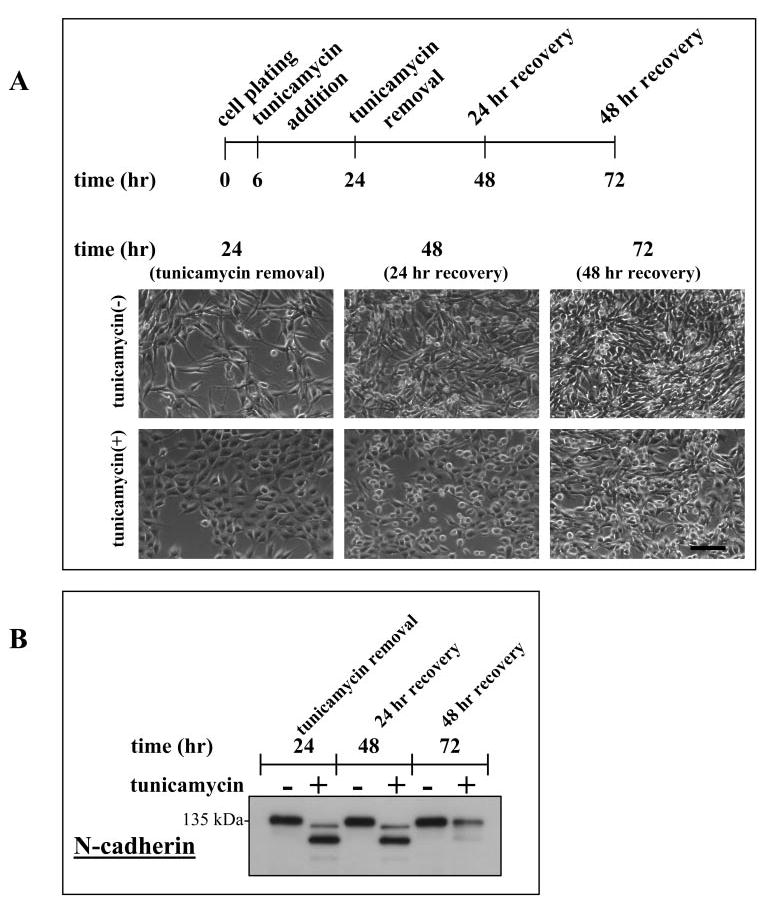
Changes in clone-YH phenotype with changes in protein glycosylation, illustrated by N-cadherin, with tunicamycin treatment, removal, and recovery. (A) Time line for the tunicamycin treatment protocol and phase contrast phenotype of clone-YH cells. Cells treated with tunicamycin are more epithelioid than untreated cells at the end of the tunicamycin incubation (t = 24 hours) but revert to a fusiform phenotype with recovery after tunicamycin removal (t = 72 hours). Scale bar, 100 μm. (B) Immunoblot of N-cadherin showing deglycosylation after tunicamycin treatment (t = 24 hours) and reglycosylation after removal of tunicamycin and recovery (t = 72 hours).
Incubation of early cultures of hTERT-RPE1 and clone-YH with tunicamycin, or with the O-glycosylation inhibitor BAG, showed lower molecular mass N-cadherin only after tunicamycin treatment (Fig. 5A), indicating that N-cadherin is N- but not O-glycosylated in both cell types. Incubation of extracts from untreated cultures with endoglycosidase H (endo) had no effect, but digestion with PNG produced lower molecular mass N-cadherin that comigrated on electrophoresis with the fastest migrating N-cadherin band generated by tunicamycin treatment (Fig. 5B). This band had the same electrophoretic mobility as the N-cadherin band in extracts of late clone-YH cultures (Fig. 3B), suggesting that N-cadherin in late cultures is deglycosylated. This possibility was confirmed by treating extracts of late clone-YH cultures with PNG, which had no further effect on N-cadherin molecular mass (Fig. 5C). The minor cadherin of clone-YH (E-cadherin) shows similar shifts in molecular mass on treatment of cultures with tunicamycin or treatment of extracts with glycosidases (Fig. 5B). Taken together these observations indicate that N-cadherin is N-glycosylated in early cultures of both hTERT-RPE1 and clone-YH cells, and, with time in culture, the cadherins of clone-YH, but not hTERT-RPE1, become deglycosylated.
Figure 5.
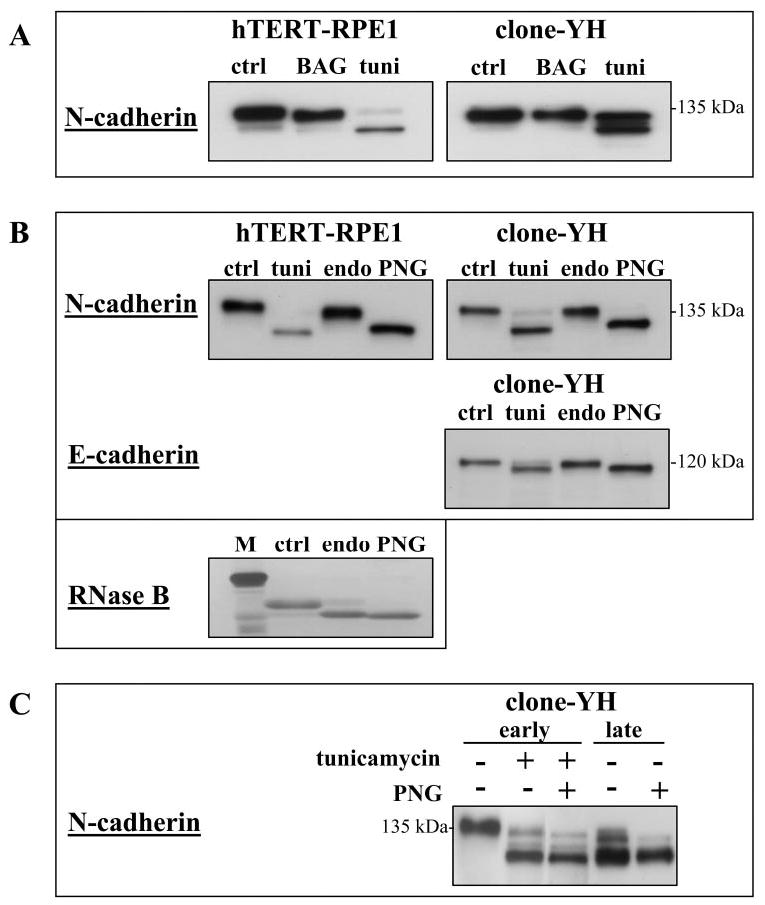
Cadherin glycosylation in hTERT-RPE1 and clone-YH cells. (A) Immunoblot analysis of N-cadherin after treatment of cells in early culture with inhibitors of N-glycosylation (0.5 μg/mL tunicamycin [tuni] for 18 hours) or O-glycosylation (2 mM benzyl-N-acetyl-α-galactosaminide [BAG] for 24 hours). Only tunicamycin produces a reduction in cadherin mass, although the extent of deglycosylation varied among experiments. (B) Cadherin immunoblots of early cultures that were untreated (control [ctrl]) or treated with tunicamycin (tuni). Extracts of control cultures were subsequently incubated with endoglycosidase H (endo) or peptide N-glycosidase F (PNG). Only PNG shows an effect. Gly-cosidase treatment of RNase B is shown as a positive control for the digestion protocols; M indicates molecular mass standard. (C) N-cadherin immunoblot of early and late clone-YH cultures. Early cultures were untreated or treated with tunicamycin. Extracts of early and late cultures were incubated without or with PNG. N-cadherin in tunicamycin treated early cultures comigrates with N-cadherin in late cultures. The migration position of N-cadherin in late cultures is unchanged by PNG treatment.
Tunicamycin treatment of early clone-YH cultures induced a phenotypic change in the cells from fusiform to more epithelioid (Figs. 6A, 7A), similar to the phenotypic change that occurs between early and late culture (Fig. 3A). The phenotypic change in clone-YH was reversible after tunicamycin withdrawal. A few elongate cell processes were seen at 24 hours after agent removal and an overall more fusiform phenotype at 48 hours (Fig. 6A), the time interval when the glycosylated form of N-cadherin becomes more abundant than deglycosylated cadherin (Fig. 6B). N-cadherin serves here as an indicator of the glycosylation state of cellular proteins, because tunicamycin inhibits total protein glycosylation. In clone-YH, therefore, changes in protein glycosylation produced changes in cell phenotype, with cells exhibiting a fusiform shape under conditions of normal glycosylation and an epithelioid shape when glycosylation is experimentally blocked or endogenously reduced over time in culture.
Figure 7.
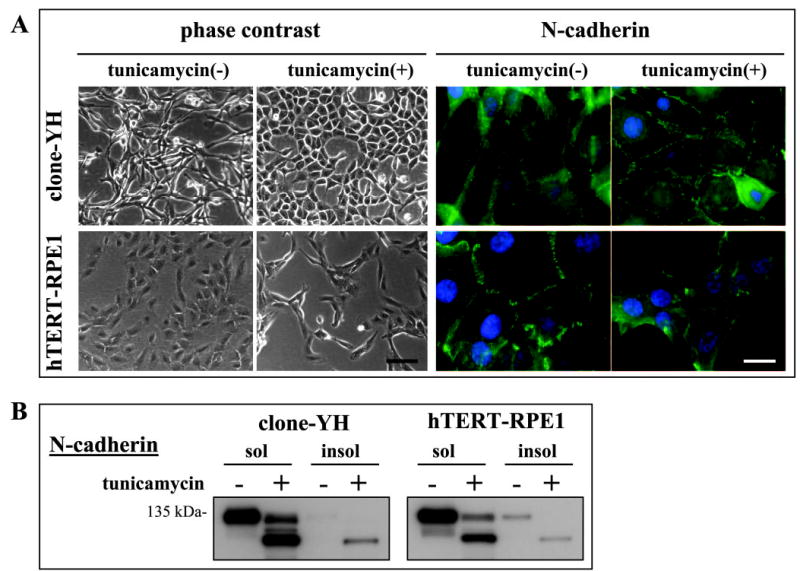
Cell-type differences in tunicamycin effects on phenotype and junctional localization of N-cadherin in early cultures of clone-YH and hTERT-RPE1 cells. (A) Phase contrast microscopy and N-cadherin immunostaining, showing a tunicamycin-induced increase in epithelial phenotype and N-cadherin junctional distribution in clone-YH, and a decrease in hTERT-RPE1. Nuclei are counterstained with DAPI. Scale bars, 100 μm for phase contrast, and 20 μm for immunostaining images. (B) N-cadherin immunoblot showing the partitioning of glycosylated and deglycosylated (after tunicamycin treatment) N-cadherin to the detergent soluble fraction (sol) or to the largely junctional detergent insoluble fraction (insol).
In contrast to the effects of tunicamycin on clone-YH cells, tunicamycin disrupted rather than induced an epithelial phenotype in hTERT-RPE1 cells (Fig. 7A). The two cell types also differed in tunicamycin-induced changes in N-cadherin distribution, which decreased in junctions in hTERT-RPE1 cells and increased in clone-YH (Fig. 7A), becoming more zonular in the latter cell type, as illustrated more clearly by confocal imaging (Fig. 8). The junctional enrichment in clone-YH was accompanied by a small increase in the amount of N-cadherin in the detergent insoluble fraction (Fig. 7B), consistent with a more stabilized association with the detergent-resistant cytoskeleton. Relatively little cadherin is insoluble in early cultures of either cell type when junctions are immature.
Figure 8.
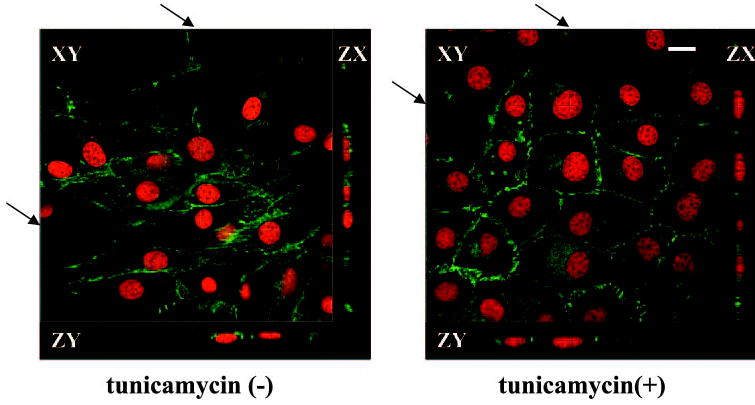
Confocal microscopy of clone-YH without or with tunicamycin treatment, showing the epithelioid phenotype and zonular distribution of N-cadherin after tunicamycin. The arrows indicate the faint lines on the composite en face images, which show the position of the cross-sectional ZX and ZY scans. Nuclei are counterstained with SYTOX Orange. Scale bar, 10 μm.
Because the glycosylation state of proteins differentially affected the junctional accumulation of N-cadherin in hTERT-RPE1 and clone-YH cells, cocultures were prepared to examine heterotypic junctions between the two cell types (Fig. 9). In cocultures without tunicamycin, N-cadherin had a complex distribution pattern, reflecting its localization at junctions between cells of each type, between cells of different types, and at nonjunctional sites in clone-YH. In tunicamycin-treated co-cultures, N-cadherin showed clear junctional staining between clone YH cells and diminished junctional staining between hTERT-RPE1, as seen in solitary cultures of each type (Fig. 7A). Despite the weak homotypic junctional staining among hTERT-RPE1 cells, heterotypic N-cadherin staining occurred between hTERT-RPE1 and clone-YH, suggesting that protein deglycosylation not only stabilizes homotypic N-cadherin junctions among clone-YH cells but also increases retention at heterotypic junctions with hTERT-RPE1.
Figure 9.
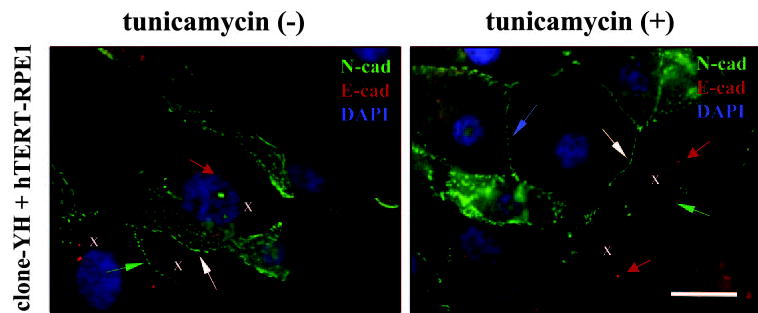
Early cocultures of clone-YH and hTERT-RPE1 without or with tunicamycin treatment co-stained for N-cadherin (N-cad, green), E-cadherin (E-cad, red), and DAPI (for nuclei, blue). hTERT-RPE1 cells were identified by their centrosomal-associated E-cadherin immunoreactivity (red arrows); some hTERT-RPE1 cells in the images are indicated by Xs. N-cadherin can be seen localizing to homotypic junctions between clone-YH cells (blue arrow) or between hTERT-RPE1 cells (green arrows). The junctions between hTERT-RPE1 in the treated cultures are poorly developed. N-cadherin also localizes prominently to heterotypic junctions between the two cell types (white arrows). Scale bar, 20 μm.
Although the protein glycosylation state differentially affects the junctional localization of N-cadherin in hTERT-RPE1 compared with clone-YH cells, the glycosylation state does not affect N-cadherin trafficking to the plasma membrane in either cell type. Both glycosylated and deglycosylated forms of N-cadherin are found in biotinylated cell surface fractions of both cell types (Fig. 10A).
Figure 10.
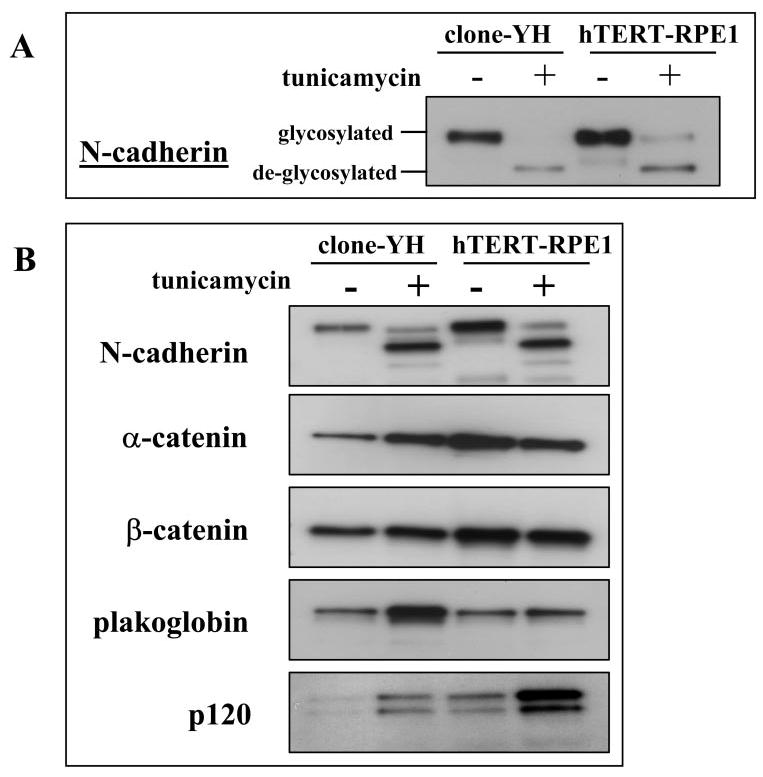
N-cadherin glycosylation state, cell-surface localization, and catenin complex composition. (A) Immunoblot analysis of N-cadherin in the biotinylated fraction of extracts prepared from early cultures of clone-YH or hTERT-RPE1, untreated or treated with tunicamycin, showing that both glycosylated and deglycosylated N-cadherin is found on the cell surface of both cell types. (B) N-cadherin immunoprecipitates of extracts from early cultures of clone-YH or hTERT-RPE1 cells, untreated or treated with tunicamycin, and blotted for the indicated proteins to illustrate the stoichiometry of catenins complexed with glycosylated and deglycosylated N-cadherin. For quantification, the catenin signal was normalized to the N-cadherin signal in the same lane.
Deglycosylated and glycosylated forms of N-cadherin also both form complexes with catenins. However, the stoichiometry of the catenins in the complexes differs with the cadherin glycosylation state and with cell type (Fig. 10B). Comparison of glycosylated N-cadherin-catenin complexes in control cultures (not treated with tunicamycin) of the two cell types shows nearly threefold more α-catenin in complexes from hTERT-RPE1 cells (0.88 ± 0.08) than from clone-YH (0.29 ± 0.04). (Data are the means ± SD in arbitrary densitometry units from scans of α-catenin blots in 3 separate experiments, each normalized to the N-cadherin signals in the same blot, as described in the Materials and Methods section.) A relative deficiency in this actin-binding catenin in clone-YH complexes is consistent with the observation that glycosylated N-cadherin in clone-YH is less likely to be stabilized at junctions, which involves linkage with the actin cytoskeleton. When clone-YH cells are tunicamycin treated to deglycosylate proteins, which induces a junctional distribution of N-cadherin, α-catenin increased more than twofold in the N-cadherin-catenin complex (to 0.65 ± 0.06 arbitrary densitometry units). The reverse occurred in hTERT-RPE1 in which tunicamycin treatment induced both a loss of N-cadherin from junctions (Fig. 7A) and a more than twofold reduction in α-catenin in N-cadherin complexes (to 0.385 ± 0.09 arbitrary densitometry units). In addition to differences in α-catenin, cadherin complexes in clone-YH with deglycosylated N-cadherin also had markedly higher amounts of plakoglobin than all other complexes that were examined. Another consistent observation was the high levels of p120 in complexes of deglycosylated N-cadherin in hTERT-RPE1 cells. β-catenin in the complexes showed no consistent differences with cadherin glycosylation state or with cell type.
Discussion
Normal Epithelial Cell Lines and Zonular Cadherins
Much of our understanding of cadherins in normal epithelial cells comes from studies of the MDCK cell line. These cells were, therefore, used to derive a clonal population for comparison with the RPE, aiming for MDCK-derived cells that resembled RPE by having N- rather than E-cadherin as the dominant endogenous cadherin. The most striking feature of the high N-cadherin subclone (clone-YH) that was generated from MDCK is the cell phenotype: clone-YH cells are prominently fusiform in subconfluent culture. Perhaps this phenotype was to be expected, given that even small amounts of N-cadherin induce a mesenchymal phenotype in both normal17 and carcinoma-derived E-cadherin– dominant epithelial cells.3,15 The fusiform phenotype of clone-YH cells proved to be transient, however, because the cells underwent a time-in-culture shift to an epithelioid shape, which coincided with a redistribution of N-cadherin from multiple punctate sites to a zonular pattern characteristic of normal epithelial cells. Although the mechanism by which this zonular end point was achieved appears to differ from RPE cells, N-cadherin was nonetheless compatible with an epithelial morphology in both clone-YH and RPE. Stated differently, the distribution of N-cadherin appears to be context specific, exhibiting an epithelial pattern in normal epithelial cells.
Cadherin dosage may also play a role in determining whether N-cadherin achieves a cell-type-specific distribution in epithelial cells. In clone-YH, N-cadherin replaced E-cadherin as the dominant endogenous cadherin, and N-cadherin formed a zonular adhesion in these cells. This is in contrast to related cell lines MDCK and TS- MDCK in which it is E-cadherin that dominates and forms the zonular adhesion.17
Not only does the dominant cadherin preferentially localize to junctions, the minor cadherin appears to be excluded. In the normal epithelial cells that we have examined here and previously,17 which have highly asymmetric accumulations of E- and N-cadherin protein, the minor cadherin traffics to the cell surface but does not accumulate at adhesive sites. Why minor cadherins are excluded from junctions is unknown, but occupancy of junctions by the major cadherin is an inadequate explanation, at least for clone-YH. In these cells, several days are required for N-cadherin to accumulate in a zonular junction, during which time the less abundant E-cadherin could theoretically achieve this pattern.
Protein Glycosylation
The deglycosylation of cadherins that was observed here in late cultures of clone-YH was unexpected. It did not occur in hTERT-RPE1 cells and was not seen in previous investigations of RPE or MDCK cells, even when cultures were maintained for extended periods (weeks).11,23 Glycosidase treatments indicated that cadherins in early cultures of both clone-YH and hTERT-RPE1 are not significantly O-glycosylated but are N-glycosylated, as previously shown for cadherins in other cells.24–30 Few details are known about the process of cadherin N-glycosylation,27,28,30 which can involve multiple enzymes in the endoplasmic reticulum, Golgi, and at the cell surface.31 The cadherins analyzed here were resistant to digestion with endoglycosidase H, indicating that most of the protein at steady state is in the medial Golgi or downstream compartments of the trafficking pathway, because only immature, high mannose oligosaccharides in pre-Golgi organelles are sensitive to this enzyme. The protein glycosylation state can affect peptide processing or transport, but cadherin trafficking to membranes in hTERT-RPE1 and clone-YH cells appears unaffected by glycosylation, in agreement with studies of cad-herin trafficking in other cell types.24
The decrease in cadherin glycosylation in clone-YH with culture time seen here resembles a previously reported decrease in glycosylation of another protein, lysosomal-associated membrane protein (LAMP)-2, in MDCK cells.32 LAMP-2 glycosylation differences were related to changes in Golgi transit time during postplating morphogenesis of the cells. It is possible that a similar mechanism is occurring here, although the mechanism and the specificity of the time-dependent cadherin glycosylation change in clone-YH has not yet been determined.
Analyses of glycosylation were pursued because endogenous cadherin glycosylation and the effect of tunicamycin on cell phenotype differed between the epithelial cell lines that were being compared. Protein glycosylation state plays a clear role in the development of the clone-YH (but not hTERT-RPE1) epithelial phenotype, because deglycosylation induced by tunicamycin reproducibly (and reversibly) shifts clone-YH phenotype to epithelioid. Further, in late clone-YH cultures (but not hTERT-RPE1), the shift to an epithelial phenotype was coincident with cadherin deglycosylation and the formation of a zonular junction of N-cadherin. Although it is tempting to conclude that deglycosylation of N-cadherin induces the phenotype changes, these events are not necessarily causatively linked. Deglycosylated N-cadherin is more likely than the glycosylated form in clone-YH to complex with the actin-binding protein α-catenin, to resist detergent extraction, to localize to a zonular junction, and to attract N-cadherin to sites of attachment with hTERT-RPE1. These observations collectively indicate that deglycosylated N-cadherin is preferentially enriched in a stable clone-YH junction, and cadherin glycosylation has been previously implicated in junctional stability, at least in experimental models of pathologic states.33–35 Nonetheless, the glycosylation state of proteins other than cadherins could change over time in clone-YH cultures and certainly change with tunicamycin treatment. Further, stable N-cadherin junction formation, especially a stable zonular junction, could be a consequence rather than a cause of epithelial phenotype development. Integrin-mediated cell-substrate attachment and cy-toskeletal organization are also powerful determinants of cell shape.36 One possibility, therefore, is that reorganization of the cytoskeleton to yield circumferential (rather than linear, stress fiber type) actin bundles confers on cells an epithelioid phenotype,37,38 thereby giving the dominant cadherin a zonular actin pattern with which to passively associate. Determining whether N-cadherin localization to a zonular junction induces or simply supports an epithelial phenotype will require dissecting complex interrelated events associated with cadherin adhesion and cadherin signaling, which may differ with cell type.
Conclusions
We conclude that N-cadherin is competent to form a zonular adhesion in normal epithelial cells. This occurs not only in RPE cells but also in clone-YH cells derived from an E-cadherin dominant cell line. The formation of an epithelial-type zonular adhesion of N-cadherin may depend on cellular background (occurring in normal epithelial cells) and on cadherin dosage (requiring high N-cadherin abundance). The mechanisms of formation of a zonular adhesion of N-cadherin, and the relation between N-cadherin adhesion formation and epithelial morphogenesis are currently unresolved. The N-cadherin dominant epithelial cell line characterized here, clone-YH, will provide a model for comparison with the RPE to dissect the events of epithelial phenotype development in epithelial cell types deficient in E-cadherin. The analyses of clone-YH shown here also focus attention on an underappreciated role for protein glycosylation in epithelial phenotype development.
Footnotes
Supported by National Eye Institute Grants R01 EY015284 and P30 EY01931 (JMB); the Posner Foundation (Milwaukee, Wisconsin); and an unrestricted grant from Research to Prevent Blindness.
Disclosure: Y.-H. Youn, None; J. Hong, None; J.M. Burke, None
References
- 1.Gumbiner BM. Cell adhesion: the molecular basis of tissue architecture and morphogenesis. Cell. 1996;84:345–357. doi: 10.1016/s0092-8674(00)81279-9. [DOI] [PubMed] [Google Scholar]
- 2.Wheelock MJ, Johnson KR. Cadherins as modulators of cell phenotype. Ann Rev Cell Dev Biol. 2003;19:207–235. doi: 10.1146/annurev.cellbio.19.011102.111135. [DOI] [PubMed] [Google Scholar]
- 3.Derycke LD, Bracke ME. N-cadherin in the spotlight of cell-cell adhesion, differentiation, embryogenesis, invasion and signalling. Int J Dev Biol. 2004;48:463–476. doi: 10.1387/ijdb.041793ld. [DOI] [PubMed] [Google Scholar]
- 4.Kang Y, Massague J. Epithelial-mesenchymal transitions: twist in development and metastasis. Cell. 2004;118:277–279. doi: 10.1016/j.cell.2004.07.011. [DOI] [PubMed] [Google Scholar]
- 5.Thoreson MA, Anastasiadis PZ, Daniel JM, et al. Selective uncoupling of p120 (ctn) from E-cadherin disrupts strong adhesion. J Cell Biol. 2000;148:189–202. doi: 10.1083/jcb.148.1.189. [DOI] [PMC free article] [PubMed] [Google Scholar]
- 6.Davis MA, Ireton RC, Reynolds AB. A core function for p120-catenin in cadherin turnover. J Cell Biol. 2003;163:525–534. doi: 10.1083/jcb.200307111. [DOI] [PMC free article] [PubMed] [Google Scholar]
- 7.Reynolds AB, Carnahan RH. Regulation of cadherin stability and turnover by p120ctn: implications in disease and cancer. Semin Cell Dev Biol. 2004;15:657–663. doi: 10.1016/j.semcdb.2004.09.003. [DOI] [PubMed] [Google Scholar]
- 8.Reynolds AB, Roczniak-Ferguson A. Emerging roles for p120-catenin in cell adhesion and cancer. Oncogene. 2004;23:7947–7956. doi: 10.1038/sj.onc.1208161. [DOI] [PubMed] [Google Scholar]
- 9.Gumbiner B, Stevenson B, Grimaldi A. The role of the cell adhesion molecule uvomorulin in the formation and maintenance of the epithelial junctional complex. J Cell Biol. 1988;107:1575–1587. doi: 10.1083/jcb.107.4.1575. [DOI] [PMC free article] [PubMed] [Google Scholar]
- 10.Lagunowich LA, Grunwald GB. Tissue and age-specificity of post-translational modifications of N-cadherin during chick embryo development. Differentiation. 1991;47:19–27. doi: 10.1111/j.1432-0436.1991.tb00217.x. [DOI] [PubMed] [Google Scholar]
- 11.McKay BS, Irving PE, Skumatz CM, Burke JM. Cell-cell adhesion molecules and the development of an epithelial phenotype in cultured human retinal pigment epithelial cells. Exp Eye Res. 1997;65:661–671. doi: 10.1006/exer.1997.0374. [DOI] [PubMed] [Google Scholar]
- 12.Kaida M, Cao F, Skumatz CM, Irving PE, Burke JM. Time at confluence for human RPE cells: effects on the adherens junction and in vitro wound closure. Invest Ophthalmol Vis Sci. 2000;41:3215–3224. [PubMed] [Google Scholar]
- 13.McNeill H, Ryan TA, Smith SJ, Nelson WJ. Spatial and temporal dissection of immediate and early events following cadherin-mediated epithelial cell adhesion. J Cell Biol. 1990;120:1217–1226. doi: 10.1083/jcb.120.5.1217. [DOI] [PMC free article] [PubMed] [Google Scholar]
- 14.Angres B, Barth A, Nelson WJ. Mechanism for transition from initial to stable cell-cell adhesion: kinetic analysis of E-cadherin-mediated adhesion using a quantitative adhesion assay. J Cell Biol. 1996;134:549–557. doi: 10.1083/jcb.134.2.549. [DOI] [PMC free article] [PubMed] [Google Scholar]
- 15.Islam S, Carey TE, Wolf GT, Wheelock MJ, Johnson KR. Expression of N-cadherin by human squamous carcinoma cells induces a scattered fibroblastic phenotype with disrupted cell–cell adhesion. J Cell Biol. 1996;135:1643–1654. doi: 10.1083/jcb.135.6.1643. [DOI] [PMC free article] [PubMed] [Google Scholar]
- 16.Hazan RB, Qiao RF, Keren R, Badano I, Suyama K. Cadherin switch in tumor progression. Ann NY Acad Sci. 2004;1014:155–163. doi: 10.1196/annals.1294.016. [DOI] [PubMed] [Google Scholar]
- 17.Youn YH, Hong J, Burke JM. Endogenous N-cadherin in a sub-population of MDCK cells: distribution and catenin complex composition. Exp Cell Res. 2005;303:275–286. doi: 10.1016/j.yexcr.2004.09.023. [DOI] [PubMed] [Google Scholar]
- 18.Laemmli UK. Cleavage of structural proteins during the assembly of the head of bacteriophage T4. Nature. 1970;227:680–685. doi: 10.1038/227680a0. [DOI] [PubMed] [Google Scholar]
- 19.Sordet O, Khan QA, Plo I, et al. Apoptotic topoisomerase I-DNA complexes induced by staurosporine-mediated oxygen radicals. J Biol Chem. 2004;279:50499–50504. doi: 10.1074/jbc.M410277200. [DOI] [PubMed] [Google Scholar]
- 20.Kakazu A, Chandrasekher G, Bazan HE. HGF protects corneal epithelial cells from apoptosis by the PI-3K/Akt-1/Bad- but not the ERK1/2-mediated signaling pathway. Invest Ophthalmol Vis Sci. 2004;45:3485–3492. doi: 10.1167/iovs.04-0372. [DOI] [PubMed] [Google Scholar]
- 21.Chae HJ, Kim HR, Xu C, et al. BI-1 regulates an apoptosis pathway linked to endoplasmic reticulum stress. Mol Cell. 2004;15:355–366. doi: 10.1016/j.molcel.2004.06.038. [DOI] [PubMed] [Google Scholar]
- 22.Boyce M, Bryant KF, Jousse C, et al. A selective inhibitor of eIF2alpha dephosphorylation protects cells from ER stress. Science. 2005;307:935–939. doi: 10.1126/science.1101902. [DOI] [PubMed] [Google Scholar]
- 23.Cao F, Burke JM. Protein insolubility and late-stage morphogenesis in long-term postconfluent cultures of MDCK epithelial cells. Biochem Biophys Res Commun. 1997;234:719–728. doi: 10.1006/bbrc.1997.6703. [DOI] [PubMed] [Google Scholar]
- 24.Shore EM, Nelson WJ. Biosynthesis of the cell adhesion molecule uvomorulin (E-cadherin) in Madin–Darby canine kidney epithelial cells. J Biol Chem. 1991;266:19672–19680. [PubMed] [Google Scholar]
- 25.Shirayoshi Y, Nose A, Iwasaki K, Takeichi M. N-linked oligosaccharides are not involved in the function of a cell-cell binding glycoprotein E-cadherin. Cell Struct Funct. 1986;11:245–252. doi: 10.1247/csf.11.245. [DOI] [PubMed] [Google Scholar]
- 26.Hutten JC, Christofori G, Chi WY, et al. Molecular cloning of mouse pancreatic islet R-cadherin: differential expression in endocrine and exocrine tissue. Mol Endocrinol. 1993;7:1151–1160. doi: 10.1210/mend.7.9.8247017. [DOI] [PubMed] [Google Scholar]
- 27.Geyer H, Geyer R, Odenthal-Schnittler M, Schnittler HJ. Characterization of human vascular endothelial cadherin glycans. Glycobiology. 1999;9:915–925. doi: 10.1093/glycob/9.9.915. [DOI] [PMC free article] [PubMed] [Google Scholar]
- 28.Ciolczyk-Wierzbicka D, Amoresano A, Casbarra A, Hoja-Lukowicz D, Litynska A, Laidler P. The structure of the oligosaccharides of N-cadherin from human melanoma cell lines. Glycoconj J. 2004;20:483–492. doi: 10.1023/B:GLYC.0000038294.72088.b0. [DOI] [PubMed] [Google Scholar]
- 29.Geng F, Shi BZ, Yuan YF, Wu XZ. The expression of core fucosy-lated E-cadherin in cancer cells and lung cancer patients: prognostic implications. Cell Res. 2004;14:423–433. doi: 10.1038/sj.cr.7290243. [DOI] [PubMed] [Google Scholar]
- 30.Balsamo J, Lilien J. N-cadherin is stably associated with and is an acceptor for a cell surface N-acetylgalactosaminylphosphotransferase. J Biol Chem. 1990;265:2923–2928. [PubMed] [Google Scholar]
- 31.Helenius A, Markus A. Roles of N-linked glycans in the endoplasmic reticulum. Ann Rev Biochem. 2004;73:1019–1049. doi: 10.1146/annurev.biochem.73.011303.073752. [DOI] [PubMed] [Google Scholar]
- 32.Nabi IR, Rodriguez-Boulan E. Increased LAMP-2 polylactosamine glycosylation is associated with its slower Golgi transit during establishment of a polarized MDCK epithelial monolayer. Mol Biol Cell. 1993;4:627–635. doi: 10.1091/mbc.4.6.627. [DOI] [PMC free article] [PubMed] [Google Scholar]
- 33.Yoshimura M, Ihara Y, Matsuzawa Y, Taniguchi N. Aberrant glycosylation of E-cadherin enhances cell-cell binding to suppress metastasis. J Biol Chem. 1996;271:13811–13815. doi: 10.1074/jbc.271.23.13811. [DOI] [PubMed] [Google Scholar]
- 34.Guo HB, Lee I, Kamar M, Pierce M. N-acetylglucosaminyltransferase V expression levels regulate cadherin-associated homotypic cell-cell adhesion and intracellular signaling pathways. J Biol Chem. 2003;278:52412–52424. doi: 10.1074/jbc.M308837200. [DOI] [PubMed] [Google Scholar]
- 35.George SK, Meyer TN, Abdeen O, Bush KT, Nigam SK. Tunicamycin preserves intercellular junctions, cytoarchitecture, and cell-substratum interactions in ATP-depleted epithelial cells. Biochem Biophys Res Commun. 2004;322:223–231. doi: 10.1016/j.bbrc.2004.07.097. [DOI] [PubMed] [Google Scholar]
- 36.Blystone SD. Integrating an integrin: a direct route to actin. Biochim Biophys Acta. 2004;1692:47–54. doi: 10.1016/j.bbamcr.2004.04.011. [DOI] [PubMed] [Google Scholar]
- 37.Pletjushkina OJ, Ivanova OJ, Kaverina IN, Vasiliev JM. Taxol-treated fibroblasts acquire an epithelioid shape and a circular pattern of actin bundles. Exp Cell Res. 1994;212:201–208. doi: 10.1006/excr.1994.1135. [DOI] [PubMed] [Google Scholar]
- 38.Yonemura S, Itoh M, Nagafuchi A, Tsukita S. Cell-to-cell adherens junction formation and actin filament organization: similarities and differences between non-polarized fibroblasts and polarized epithelial cells. J Cell Sci. 1995;108:127–142. doi: 10.1242/jcs.108.1.127. [DOI] [PubMed] [Google Scholar]


