

Abstract
The purpose of this study was: (i) to provide additional evidence regarding the existence of human voice parameters, which could be reliable indicators of a speaker's physical characteristics and (ii) to examine the ability of listeners to judge voice pleasantness and a speaker's characteristics from speech samples. We recorded 26 men enunciating five vowels. Voices were played to 102 female judges who were asked to assess vocal attractiveness and speakers' age, height and weight. Statistical analyses were used to determine: (i) which physical component predicted which vocal component and (ii) which vocal component predicted which judgment. We found that men with low-frequency formants and small formant dispersion tended to be older, taller and tended to have a high level of testosterone. Female listeners were consistent in their pleasantness judgment and in their height, weight and age estimates. Pleasantness judgments were based mainly on intonation. Female listeners were able to correctly estimate age by using formant components. They were able to estimate weight but we could not explain which acoustic parameters they used. However, female listeners were not able to estimate height, possibly because they used intonation incorrectly. Our study confirms that in all mammal species examined thus far, including humans, formant components can provide a relatively accurate indication of a vocalizing individual's characteristics. Human listeners have the necessary information at their disposal; however, they do not necessarily use it.
Keywords: voice perception, voice production, vocal tract, formant frequencies
1. Introduction
The honest signal hypothesis of sexual selection assumes that females choose their partners according to signals that reliably indicate a male's qualities (Zahavi 1977; Johnstone 1995). Formal models have suggested that acoustic signals are likely to provide females with honest information on the quality or condition of the signaller (Clutton-Brock & Albon 1979; Johnstone 1995). Many studies have shown that animals from numerous species, either vertebrate or invertebrate, use sounds produced by conspecifics to assess characteristics of a sound-producer (Ryan & Keddy-Hector 1992; Fitch 1997; Reby & McComb 2003).
The ‘source-filter’ theory stipulates that, in mammals (including humans), vocalizations result from a source signal generated by vibrations of the vocal folds and are then filtered in the cavities of the vocal tract (Fant 1960). The basic pitch of a vocalization, i.e. its fundamental frequency (F0), is determined mainly by the length of the vocal folds (Titze 1994). When the signal goes through the vocal tract, some frequencies are selectively amplified: these frequencies are called ‘formants’ (Fant 1960). This selected amplification depends on the size of the vocal tract and the volume of its cavities (Fant 1960). Relationships between acoustic parameters of vocalization and characteristics of the signaller, especially his body size have been studied in a number of mammal species (Morton 1977; McComb 1991; Masataka 1994; Fitch 1997). A number of researchers have studied whether fundamental frequency provides an accurate cue to body size (McComb 1991; Masataka 1994): they predicted that larger males emit lower frequency sounds. This prediction, which is based on the hypothesis that the length of the vocal folds increases with body size (Titze 1994), has been verified across species: larger species produce lower-pitched vocalization than smaller ones (Hauser 1993). However, within mammal species, this is not the case (McComb 1991; Masataka 1994). Recently, a number of studies have suggested that formant frequencies may provide a more reliable indication of body size (Fitch 1997; Owren et al. 1997; Reby & McComb 2003) and may also provide an indication of the signaller's age (Reby & McComb 2003).
The question of whether or not information about physical characteristics may be contained in the human speech signal has also been investigated. It can be expected that, as in animals, certain human anatomical conditions, such as vocal folds dimensions and vocal tract length, delimit certain ranges of average frequency, formant components and other parameters (Laver & Trugdill 1979; Nolan 1983). These voice features have no linguistic function and are, therefore, called ‘extra linguistic’ (Laver & Trugdill 1979). Studies have been conducted to examine the ability of listeners to judge a speaker's sex (Bennett & Montero-Diaz 1982; Childers & Wu 1991), age (Ptacek & Sander 1966; Hartman & Danhauer 1975) and build (Lass et al. 1980; van Dommelen & Moxness 1995; Collins 2000; Krauss et al. 2002) from speech samples. These studies indicate first that listeners are consistent in estimating these characteristics. Moreover, in these studies, the listeners have also been found to be able to identify speakers' characteristics, i.e. with better than chance-guessing accuracy. This was taken as an indication that the speakers' voice contained certain features that could be used by the listeners in a consistent and appropriate way. Three studies investigated which features are used for build estimation (Fitch (1994) with computer synthesized vowels; van Dommelen & Moxness (1995) and Collins (2000) with real speech). Fitch (1994) created vowels with different pitches and apparent vocal tract lengths and showed that both fundamental frequency and formant dispersion played a role in body size judgment. van Dommelen & Moxness (1995) used text paragraphs for speech samples and showed the use of speech rate for build estimation. Collins (2000), with isolated vowels, showed that this estimation is based on pitch. van Dommelen & Moxness (1995) showed significant negative correlation between a male speaker's actual weight and speech rate, whereas Collins (2000) found no correlation between acoustic parameters and male speakers' actual height or weight. However, Collins & Missing (2003) showed a significant correlation between female speakers' actual height and average formant dispersion; women with small formant dispersion were taller. Furthermore, Collins & Missing (2003) and Gonzalez (2004) found a weak although significant relationship between female or male speakers' height and formant parameters.
From the perspective of the honest signal theory, we wanted to determine if certain vocal parameters could be considered as reliable indicators in speakers' characteristics estimation (height, weight, age). Moreover, to our knowledge, only four studies deal with voice pleasantness, more precisely male voice pleasantness (Varosanec-Skaric 1999; Collins 2000; Hughes et al. 2004; Feinberg et al. 2005). Our approach concurs with van Dommelen & Moxness' (1995) and Collins' (2000) approach insofar as we associate the study of male vocal production, the study of judgments which follow from male voice perception and the study of male speakers' actual characteristics. Following the example of Collins (2000) and Van Dommelen (1995), we postulate that possible relations between some physical characteristics and some perceptual judgments can be mediated by simple acoustics parameters. Lastly, it is well known that testosterone affects vocal production in higher vertebrates, primates and humans (Beckford et al. 1985; Ziztmann & Nieschlag 2001). However, there is no clear relationship between testosterone and body height or size in humans (Ziztmann & Nieschlag 2001). Contrary to previous research, we studied the link between male-speakers' vocal production and hormonal status, more precisely testosterone level.
2. Material and methods
(a) Speakers and recording
We used 26 male speakers, 18–32 years old (mean 24.2 years), all French native speakers, without regional accents (Floccia et al. 2004). The absence of regional accent was judged separately by two of the authors. The speakers were selected from the student population of Paris. Every speaker had normal speech characteristics and no reported hearing difficulties. At the time of the recording session, the speakers' height (range 1.65–1.90 m), weight (range 60–90 kg), shoulder width (range 35–55 cm), chest circumference (range 88–110 cm), neck circumference (range 36–46 cm) and neck length (range 8–13 cm) were measured. The speakers' height was correlated with their weight (r=0.51, p<0.01). Body surface area (with Boyd's (1935) formula, range 2.04–1.73: ) and body mass index (BMI=weight (kg)/height (m2); Quetelet 1835; Bray 1978), range 20.5–26.2 were calculated. Voices were recorded individually in a small, isolated and quiet room (sound-level between 20 and 25 dB) at the University of Nanterre by the same experimenter using a Sharp MD-MT99H tape recorder and Sennheiser EMU 4535 microphone. The microphone was held at 15 cm from the mouth and a constant recording sound level was used. Each speaker was asked to repeat the series of five vowels (A[a], E[oe], I[i], O[o], U[y] in this order) twice using his natural voice, at a constant rate. The overall amplitude of voices was equalized across speakers with Avisoft 4.1 SAS Lab Sound Analysis program.
(b) Saliva collection and testosterone assay
We collected the saliva of the speakers, in order to measure their testosterone level, which allowed us to have a good estimate of the plasma testosterone concentration (Vining & Mc Ginley 1987; Port 1991; Lac et al. 1993). Each subject rinsed his mouth out with water and chewed a stick of flavoured sugar-free Trident gum for 2 min so as to stimulate the saliva flow (Dabbs 1991). We used a cotton-based material (Sarstedt) to absorb saliva from the subjects' mouth (Shirtcliff et al. 2000): subjects kept the cotton in their mouth for 1 min (without chewing it), then the cotton was taken out and placed in an appropriate plastic test tube closed with a plastic stopper. Each sample was stored at −20 °C until analysis. Plasma concentrations of testosterone were determined by radioimmunoassays at the CEBC (CNRS). Testosterone extraction from saliva (0.5 ml) consisted of adding 3 ml of diethyl ether to the diluted sample, vortexing for 1 min and centrifuging for 5 min (4 °C, 2000 rpm). The ether phase was decanted after snap-freezing the tube in an alcohol bath at −30 °C, and evaporated. The dried extract was redissolved in 300 μL of PBS–BSA buffer. Tritiated testosterone (1000 cpm) was added to the samples for the calculation of extraction recovery. Duplicate aliquots of the extracts, redissolved in phosphate-buffered saline (pH 7.4) containing 0.1% bovine albumin were incubated overnight at 4 °C with approximately 6000 cpm of 3H-testosterone and a specific antibody. Bound and free fractions were separated by adsorption with dextran-coated charcoal and centrifuged. Aliquots of the bound fractions were counted in a liquid scintillator counter. The recovery values for all the saliva samples were over 95%. The minimal levels of testosterone detected were 60 pg ml−1. The mean intra-assay coefficient of variation was 5.84%.
(c) Listeners and experimental sessions
The subjects were 102 female students of the University of Nanterre (Paris), aged 18–32 years (mean 25.6 years), all French natives with French as their mother tongue. They were divided randomly into five groups of judges (18–22 listeners per group). In order to reduce the listening time for the judges, we created five groups of five speakers from the 26 voices. Collins (2000) observed that when judges were asked to rate voices they would use the first as a ‘standard’, so in order to investigate the agreement of judgment on voice pleasantness between the five groups of listeners; we used the twenty-sixth voice for this use. This 26th voice was included into each group; we called it ‘the control voice’. Each group of speakers was thus made up of six voices. Each female subject listened to the six voices one after the other. The first voice listened to was always the ‘control voice’; the order of the five other voices was randomized in every group. For each voice, the second series of vowels recorded (in the same order A E I O U) was played five times through headphones (SONY SRS A35) at constant amplitude. We used the second series as some speakers hesitated during the first series. The five tests were conducted by the same experimenter in the same quiet room (sound-level between 20 and 30 dB) at the University of Nanterre. During experimental sessions, we did not use headphones; female judges were exposed to male voices in ‘natural’ listening conditions. The female listeners were given written instructions which explained the purpose of the experimentation, i.e. to investigate the impression of pleasantness conveyed by a person's voice. We asked them to estimate, in this order: voice pleasantness (giving a mark from 0=not pleasant at all, to 10=very pleasant), height (giving a number between 1.50 and 2.00 m), weight (giving a number between 50 and 120 kg) and age (giving a number between 15 and 80 years) of the speakers, according to their first impression. The listeners were instructed to mention whether they knew the speaker. None of the listeners recognized any speaker.
(d) Acoustic analysis of vowels
Because we wanted to get a general measure of vocal range, we used means for vocal measurements across the five vowels (which is more representative of a speaker's vocalizations and reduce statistical dispersion). We used Praat 4.2.07 software, P. Boersma and D. Weenink, http://www.praat.org. In addition to mean pitch (between the five vowels), we measured the overall temporal variation of pitch, i.e. pitch variation between the beginning and the end of the vowel, which permitted us to evaluate the intonation, we also calculated the speed of utterance according to the number of vowels emitted per second. We measured the peak frequencies of the first five formants (F1–F5) of each vowel and then calculated their means across the five vowels (FFT spectrum, Fourier method, all parameters were default values recommended by the authors of Praat: 5-ms Gaussian window, 2-ms time step, 20 Hz frequency step, 50 dB dynamic range, 5000 Hz maximum frequency). Moreover, we calculated overall formant dispersion, i.e. mean interval between formant frequencies, for each vowel and the overall formant dispersion between the five vowels. We also calculated the overall formant dispersion with only the fourth and fifth formant because these two formants are less likely to be dependent on the kind of vowel (Fant 1960); this parameter was measured in previous studies (Collins 2000; Collins & Missing 2003).
(e) Statistical analyses
We used Kendall coefficient of concordance to test the agreement of listener judgment within each group. We used two one-way ANOVAs: one to test the agreement of judgment between the five groups (using the control voice) and the second to test the homogeneity in body or vocal characteristics. We used two principal composant analyses (PCA) to reduce the original set of variables in order to do regression analyses. The first PCA was made with body measures (excluding age and testosterone levels) and the second PCA was done with vocal parameters. Regression analysis (general tests) allowed us to determine: (i) which morphological component predicted which vocal component and (ii) which vocal component predicted which judgment. Then we tested more specifically (specific tests with Pearson correlations) whether formant information was related to testosterone levels, to age (as suggested by Huber et al. 1999) and to height (as suggested by Fitch & Giedd 1999; Gonzalez 2004). We also tested whether pleasantness was related to physical and hormonal measures. Last of all, we used a correlation analysis (Pearson) to test the concordance between the speakers' physical characteristics and the listeners' physical estimates. All the statistical analyses were made using Statistica 5 software.
3. Results
(a) Agreement within and between-groups
For each voice the mean pleasantness, estimated weight, height and age were calculated. For the five groups, judges within each group agreed on these four items (Kendall coefficient of concordance, see table 1). For each item, a one-way ANOVA was done to test the agreement of judgment on the control voice between the five groups. The analysis showed no group effect on listener's judgment: pleasantness F(4,97)=1.86, p=0.12; age F(4,97)=0.78, p=0.53; weight F(4,97)=1.05, p=0.38; height F(4,97)=1.73, p=0.15. Moreover, there were no differences between the five groups of speakers concerning body or vocal characteristics (ANOVA: all NS). For all these reasons, the five groups were combined into one group of 26 voices (the five voices of each group plus the ‘control voice’) for the statistical analyses.
Table 1.
Kendall coefficients of concordance, showing agreement between judges within groups.
| group | pleasantness | age estimation | weight estimation | height estimation | |
|---|---|---|---|---|---|
| group 1 (N=21) | X2 | 49.5 | 94.1 | 38.5 | 15.6 |
| P | 0.001 | 0.001 | 0.001 | 0.01 | |
| W | 0.27 | 0.5 | 0.2 | 0.1 | |
| group 2 (N=22) | X2 | 52.84 | 57.12 | 24.3 | 43.8 |
| P | 0.001 | 0.001 | 0.005 | 0.001 | |
| W | 0.36 | 0.4 | 0.016 | 0.3 | |
| group 3 (N=21) | X2 | 34.9 | 57.8 | 33.9 | 32.1 |
| P | 0.001 | 0.001 | 0.005 | 0.005 | |
| W | 0.27 | 0.41 | 0.25 | 0.23 | |
| group 4 (N=18) | X2 | 55.12 | 41.2 | 54.2 | 61.24 |
| P | 0.001 | 0.001 | 0.001 | 0.001 | |
| W | 0.34 | 0.25 | 0.34 | 0.38 | |
| group 5 (N=20) | X2 | 40.7 | 44.2 | 44.4 | 29.5 |
| P | 0.001 | 0.001 | 0.001 | 0.005 | |
| W | 0.28 | 0.3 | 0.34 | 0.2 |
(b) Principal component analyses (PCA)
One analysis was done on morphological measures and the second on vocal parameters. We kept the first three components of each PCA: (i) morphological parameters PCA: component 1=‘body size component’ explains 51.5% of the variance, taller men with a considerable body surface area and large shoulders have a high score. Component 2=‘body shape component’ explains 25.1% of the variance, heavy men with a considerable BMI and large chest circumference have a high score. Component 3=‘neck component’ explains 16.2% of the variance, men with a long and stocky neck have a high score. (ii) Vocal parameters PCA: component 1=‘formant component’ explains 28.4% of the variance, voices with higher F1, F4 formant frequencies, wider formant dispersion for the vowels A, E, O and wider overall formant dispersion have a high score. Component 2=‘intonation component’ explains 17.1% of the variance, voices with a considerable decreasing temporal variation of fundamental frequency have a high score. Component 3=‘pitch component’ explains 12.1% of the variance; high frequency voices have a high score.
(c) Acoustic parameters and characteristics of the speakers
General tests (regressions analyses): all regression analyses on judgment were conducted with the ‘morphological components’ as independent variables (body size, body shape, neck) and ‘acoustical components’ as dependent variables (formant, intonation, pitch). There were no significant relations.
Specific tests (Pearson correlations): correlations showed that men with a low score for the formant component (i.e. low-frequency formant and small formant dispersion) tended to be older (p<0.05; r=−0.39; N=26, see figure 1) and tended to have a high level of testosterone (p<0.05; r=−0.41, N=26, see figure 2). Moreover, men with low-frequency formant and small formant dispersion tended to be taller but this result did not reach statistical significance (p=0.06; r=−0.36; N=26).
Figure 1.
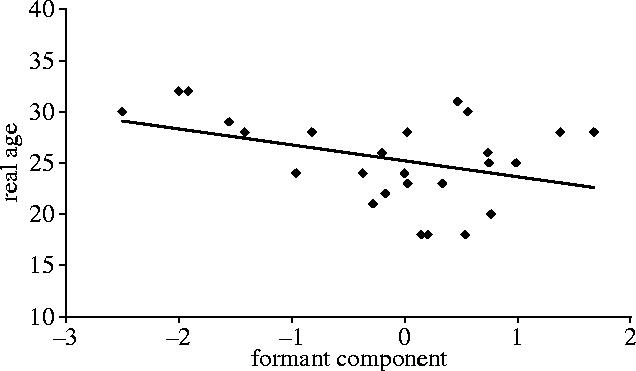
Relation between real age and formant component.
Figure 2.

Relation between testosterone level and formant component.
(d) Acoustic parameters and listeners' judgments
All regression analyses on judgment were conducted with the ‘acoustical component’ as independent variables (formant, intonation, pitch) and listeners' judgment (pleasantness, estimated age, weight, height) as dependent variables. Female listeners based their judgment of pleasantness on intonation: pleasantness was predicted by the intonation component (F(1,24)=12.6; R2=0.34; p<0.005, see figure 3). Voices with an increasing temporal pitch are judged more pleasant than voices with constant or decreasing pitch. We separated the 26 voices by creating two categories of intonation: increasing pitch (15 voices) versus constant/decreasing pitch (11 voices). Within the ‘increasing pitch category’, pleasantness and mean pitch (original measure) were correlated: men with low-pitched voices were more appreciated than men with high-pitched voices (Pearson correlation, p<0.01; r=−0.65), no other significant correlation was found. In the other category, no correlation was found (Pearson correlation, p=0.85). Height judgment was predicted by the intonation component (F(1,24)=9.9; R2=0.29; p<0.005). Age judgment was predicted by the formant component (F(1,24)=4.11; R2=0.16; p<0.05). Weight judgment was not predicted by any acoustical component.
Figure 3.

Relation between voice pleasantness and intonation component.
(e) Listeners' judgments and speakers' real characteristics
The pleasantness judgment was not correlated with any physical characteristic (Pearson correlation, all NS); moreover, the pleasantness judgment was not correlated with testosterone level (Pearson correlation, p=0.64; r=−0.09). The estimated weight was correlated with actual weight of the speakers (Pearson correlation, p<0.05; r=0.4, N=26). The estimated age was correlated with actual age (Pearson correlation, p<0.01; r=0.5, N=26). Lastly, there was no correlation between estimated and actual height (p=0.16).
4. Discussion
(a) Pleasantness judgment
Female listeners made a number of judgments about men based on their spoken vowel sounds: women are consistent in their pleasantness judgment and in their height, weight, age estimates. Concerning the pleasantness judgment, we found that female listeners mainly based their judgment on intonation. Women were found to prefer voices with an increasing pitch rather than voices with a constant or decreasing pitch. This result is not in agreement with those of Varosanec-Skaric (1999), Collins (2000) and Feinberg et al. (2005). Varosanec-Skaric (1999) studied male voice pleasantness with standardized texts and showed that low-frequency formant voices were more often considered as pleasant. However, it is important to point out that listeners were instructed to read the text neutrally. Collins (2000) and Feinberg et al. (2005) with vowel samples, showed that male low-pitched voices were judged as the most pleasant. Nevertheless, these authors had obliterated the intonation factor by giving explicit instructions relative to pronunciation. In the present study, among increasing-pitched voices, low-pitched voices were judged as more pleasant than high-frequency voices, this result agrees with those of Collins (2000) and Feinberg et al. (2005).
(b) Age estimate and the correct use of formant information
In our study, the female listeners gave correct estimations of male speakers' actual age. In previous studies of age perception, subjects were asked to estimate the speaker's age, then the correlation between the perceived age and the actual age was calculated; these correlations are often significant (Shipp & Hollien 1969; Ryan & Burk 1974; Hartman 1979; Neiman & Applegate 1990). In the present study, female listeners used formant components (formant frequencies and formant dispersion) and both the actual and estimated age were correlated with formant components. These results contrast with those of Biemans et al. (1995) and Collins (2000) in which listeners used pitch for such estimations, but agree with those of Linville & Fisher (1985). In humans (Peterson & Barney 1952; Kent & Former 1979; Hillenbrand et al. 1995; Huber et al. 1999; Lee et al. 1999), many acoustical studies about changes in formant frequencies with real age have been completed. First, second and third formant frequencies have been found to be the highest in children, decreasing with increasing age, and to be lower in adult men (Huber et al. 1999). It has been suggested that, in adults, the larynx may lower in the neck with age, and so vocal tract increases in length, as a result of the stretching of ligaments and atrophy of neck strap muscles (Wilder 1978; Linville & Fisher 1985). In conclusion, formant components could provide reliable information about the maturity and size of the vocal tract (Huber et al. 1999) and so permit us to estimate speakers' age.
(c) Speakers' height/testosterone level and formant components
Our study showed that taller individuals tend to have voices with low-frequency formants and little formant dispersion. This result agrees with those of Collins & Missing (2003) and Gonzalez (2004) but contrasts with others; van Dommelen & Moxness (1995) and Collins (2000) found no correlation between formant frequencies and speakers' body length. Our results agree also with those from non-human mammal species: Fitch 1997 (monkey), Riede & Fitch 1999 (dog) and Reby & McComb 2003 (red deer) showed negative significant correlations between formant dispersion and body length. The correlation between formant component and body length can be explained by both the fact that the most important determinant of formant components in mammals (including humans) is the length of the vocal tract (Fant 1960) and the fact that body length is correlated with vocal tract length in humans (Fitch & Giedd 1999) and in a variety of mammalian species (Fitch 2000). Our study also shows that individuals with high testosterone levels tend to have voices with low-frequency formants and little formant dispersion. It is well known that testosterone affects vocal production in higher vertebrates, primates and humans (Beckford et al. 1985; Ziztmann & Nieschlag 2001). This result could be explained by the fact that, during puberty, testosterone increases vocal tract dimensions by a secondary descent of the larynx (Fant 1975). Dabbs & Malinger (1999) showed that men with low-pitched voices do have higher testosterone levels, this result was not observed here. Our study tends to indicate that formant information could provide a relatively accurate indication of a vocalizing individual's body length and testosterone level and so could be considered as an honest signal.
(d) Height and weight estimates
In our study, female listeners were able to correctly judge a male speaker's weight but not height. For height estimate, female listeners used intonation incorrectly because intonation was not correlated with the actual height. Female listeners have the necessary information at their disposal, i.e. formant component; however, they do not use it. In contrast, female listeners were able to estimate weight quite correctly, as in van Dommelen & Moxness (1995) and Collins (2000), but we were not able to determine which acoustic parameters they used. Numerous studies showed that human listeners take low F0 as an indication of large body dimensions (Lass & Davies (1976); Lass & Brown (1978); Kunzel (1989); Hollien et al. (1994); Collins (2000)). Indeed, in these studies, mean pitch was found to vary a lot among speakers, however, showed no correlation with speakers' actual height or weight. We cannot rule out the fact that cultural tradition can interfere and increase the influence of some acoustical cues, like pitch, to the detriment of other cues, i.e. formant, that are more important for estimating body length. In occidental society, films and television often show taller men with deeper voices and shorter men with sharper voices. This may reflect preconceptions or may give rise to those preconceptions.
In conclusion, our study and those cited previously reveal that in all mammal species examined thus far, including humans, formant components could provide a relatively accurate indication of a vocalizing individual's characteristics. Human listeners have at their disposal the necessary information; however, they do not necessarily use it. In a future project, we will study the judgments on male voices by male listeners in order to determine whether the same judgments are made.
Acknowledgments
Thanks to Laurent Nagle, Philippe Lenouvel, Magalie Pastot for their help. Thanks to Marie Monbureau for English style correction, to Jacques Poitevineau and Thierry Meyer for statistical advice and Colette Trouvé for hormonal analysis. We thank the three anonymous referees for their insightful comments on the manuscript.
References
- Beckford N.S, Schain D, Roor S.R, Schanbacher B. Androgen stimulation and laryngeal development. Ann. Otol. Rhinol. Laryngol. 1985;94:634–640. doi: 10.1177/000348948509400622. [DOI] [PubMed] [Google Scholar]
- Bennett S, Montero-Diaz L. Children's perception of speaker sex. J. Phon. 1982;10:113–121. [Google Scholar]
- Biemans, M., van Bezooijen, R. & Rietveld T. 1995 Suitability of judgment of pitch as a function of age. In Proc. XIII Int. Conf. in Phonetic Sciences, Stockholm, vol 3. pp. 476–477.
- Boyd, E. 1935 Growth of the surface area of the human body. Ph.D. thesis, University of Minnesota P., Minneapolis.
- Bray G.A. Definition, measurement, and classification of the syndromes of obesity. Int. J. Obes. 1978;2:99–112. [PubMed] [Google Scholar]
- Childers D.G, Wu K. Gender recognition from speech 2. Fine analysis. J. Acoust. Soc. Am. 1991;90:1841–1856. doi: 10.1121/1.401664. [DOI] [PubMed] [Google Scholar]
- Clutton-Brock T.H, Albon S.D. The roaring of reed deer and the evolution of honest advertising. Behaviour. 1979;69:145–170. [Google Scholar]
- Collins S.A. Men's voices and women's choices. Anim. Behav. 2000;40:773–780. doi: 10.1006/anbe.2000.1523. 10.1006/anbe.2000.1523 [DOI] [PubMed] [Google Scholar]
- Collins S.A, Missing C. Vocal and visual attractiveness are related in women. Anim. Behav. 2003;65:997–1004. 10.1006/anbe.2003.2123 [Google Scholar]
- Dabbs J.M. Salivary testosterone measurements: collecting, storing and mailing saliva samples. Physiol. Behav. 1991;42:815–817. doi: 10.1016/0031-9384(91)90323-g. 10.1016/0031-9384(91)90323-G [DOI] [PubMed] [Google Scholar]
- Dabbs J.M, Malinger A. Hight testosterone level predict low voice pitch among men. Pers. Indiv. Differ. 1999;27:801–804. 10.1016/S0191-8869(98)00272-4 [Google Scholar]
- Fant G. Mouton & Co; The Hague: 1960. Acoustic theory of speech production. [Google Scholar]
- Fant G. Non-uniform vowel normalization. Speech Trans. Lab. Q. Progr. Status Rep. 1975;2-3:1–19. [Google Scholar]
- Feinberg D.R, Jones B.C, Little A.C, Burt D.M, Perrett D.I. Manipulations of fundamental and formant frequencies influence the attractiveness of human male voices. Anim. Behav. 2005;69:561–568. 10.1016/j.anbehav.2004.06.012 [Google Scholar]
- Fitch, W. T. 1994 Vocal tract length perception and the evolution of language. Ph.D. thesis, Brown University, Providence, RI.
- Fitch W.T. Vocal tract length and formant frequency dispersion correlate with body size in rhesus macaques. J. Acoust. Soc. Am. 1997;102:1213–1222. doi: 10.1121/1.421048. 10.1121/1.421048 [DOI] [PubMed] [Google Scholar]
- Fitch W.T. Skull dimensions in relation to body size in nonhuman mammals: the cause bases for acoustic allometry. Zoology. 2000;103:40–55. [Google Scholar]
- Fitch W.T, Giedd J. Morphology and development of the human vocal tract: a study using magnetic resonance imaging. J. Acoust. Soc. Am. 1999;106:1511–1522. doi: 10.1121/1.427148. 10.1121/1.427148 [DOI] [PubMed] [Google Scholar]
- Floccia, C., Goslin, J. & Girard, F. 2004 Processing inter-speaker variability: the case of regional accents. In Proc. ‘Journées d'Etudes Linguistiques’, pp. 51–56. University of Nantes.
- Gonzalez J. Formant frequencies and body size of speaker: a weak relationship in adult humans. J. Phon. 2004;32:277–287. 10.1016/S0095-4470(03)00049-4 [Google Scholar]
- Hartman D. The perceptual identity and characteristics of aging in normal male adult speakers. J. Commun. Dis. 1979;12:53–61. doi: 10.1016/0021-9924(79)90021-2. 10.1016/0021-9924(79)90021-2 [DOI] [PubMed] [Google Scholar]
- Hartman D.E, Danhauer J.L. Perceptual features of speech for males in four perceived age decades. J. Acoust. Soc. Am. 1975;59:713–715. doi: 10.1121/1.380894. 10.1121/1.380894 [DOI] [PubMed] [Google Scholar]
- Hauser M.D. The evolution of non-human primate vocalisations: effects of phylogeny, body weight and social context. Am. Nat. 1993;142:528–542. doi: 10.1086/285553. 10.1086/285553 [DOI] [PubMed] [Google Scholar]
- Hillenbrand J, Getty L.A, Clark M.J, Wheeler K. Acoustic characteristics of American English vowels. J. Acoust. Soc. Am. 1995;97:3099–3111. doi: 10.1121/1.411872. [DOI] [PubMed] [Google Scholar]
- Hollien H, Green R, Massey K. Longitudinal research on adolescent voice change in males. J. Acoust. Soc. Am. 1994;96:2646–2654. doi: 10.1121/1.411275. [DOI] [PubMed] [Google Scholar]
- Huber J.E, Stathopoulos E.T, Curione G.M, Ash T.A, Johnson K. Formants of children, women, and men: the effects of vocal intensity variation. J. Acoust. Soc. Am. 1999;106:1532–1542. doi: 10.1121/1.427150. 10.1121/1.427150 [DOI] [PubMed] [Google Scholar]
- Hughes S.M, Dispenza F, Gallup G.G., Jr Ratings of voice attractiveness predict sexual behaviour and body configuration. Evol. Hum. Behav. 2004;25:295–304. 10.1016/j.evolhumbehav.2004.06.001 [Google Scholar]
- Johnstone R.A. Sexual selection, honest advertisement and the handicap principle: reviewing the evidence. Biol. Rev. 1995;70:1–65. doi: 10.1111/j.1469-185x.1995.tb01439.x. 10.1086/418864 [DOI] [PubMed] [Google Scholar]
- Kent R.D, Former L.L. Developmental study of vowel formant frequencies in an imitation task. J. Acoust. Soc. Am. 1979;65:208–217. doi: 10.1121/1.382237. 10.1121/1.382237 [DOI] [PubMed] [Google Scholar]
- Krauss R.M, Freyberg R, Morsella E. Inferring speakers' physical attributes from their voices. J. Exp. Soc. Psychol. 2002;38:618–625. 10.1016/S0022-1031(02)00510-3 [Google Scholar]
- Kunzel H.J. How well does average fundamental frequency correlate with speaker height and weight? Phonetica. 1989;46:117–125. doi: 10.1159/000261832. [DOI] [PubMed] [Google Scholar]
- Lac G, Lac N, Robert A. Steroid assays in saliva: a method to detect plasmatic contaminations. Arch Int. Physiol. Biochim. Biophys. 1993;101:257–262. doi: 10.3109/13813459309003921. [DOI] [PubMed] [Google Scholar]
- Lass N.J, Brown W.S. Correlational study of speakers' heights, weights, body surface areas and speaking fundamental frequencies. J. Acoust. Soc. Am. 1978;63:1218–1220. doi: 10.1121/1.381808. 10.1121/1.381808 [DOI] [PubMed] [Google Scholar]
- Lass N.J, Davies M. An investigation of speaker height and weight identification. J. Acoust. Soc. Am. 1976;59:700–703. doi: 10.1121/1.381142. 10.1121/1.381142 [DOI] [PubMed] [Google Scholar]
- Lass N.J, Brong G.W, Ciccoella S.A, Walter S.C, Maxwell E.L. An investigation of speaker height and weight discriminations by means of paired comparison judgments. J. Phon. 1980;8:205–212. [Google Scholar]
- Laver J, Trugdill P. Phonetic and linguistic markers in speech. In: Sherer K.R, Giles H, editors. Social markers in speech. Cambridge University Press; Cambridge, UK: 1979. pp. 1–32. [Google Scholar]
- Lee S, Potamianos A, Narayanan S. Acoustic of children's speech: developmental changes of temporal and spectral parameters. J. Acoust. Soc. Am. 1999;105:1455–1468. doi: 10.1121/1.426686. 10.1121/1.426686 [DOI] [PubMed] [Google Scholar]
- Linville S.E, Fisher H.B. Acoustic characteristics of perceived versus actual vocal age in controlled phonation by adult females. J. Acoust. Soc. Am. 1985;78:40–48. doi: 10.1121/1.392452. [DOI] [PubMed] [Google Scholar]
- Masataka N. Lack of correlation between body size and frequency of vocalisation in young female Japanese macaques (Macaca fuscata) Folia primatol. 1994;63:115–118. doi: 10.1159/000156803. [DOI] [PubMed] [Google Scholar]
- McComb K.E. Female choice for high roaring rate in red deer (Cervus elaphus) Anim. Behav. 1991;41:79–88. [Google Scholar]
- Morton E.S. On the occurence and significance of motivation–structural rules in some birds and mammals sounds. Am. Nat. 1977;111:855–869. 10.1086/283219 [Google Scholar]
- Neiman G, Applegate J. Accuracy of listener judgment of perceived age and relative to chronological age in adults. Folia Phon. 1990;42:327–330. doi: 10.1159/000266090. [DOI] [PubMed] [Google Scholar]
- Nolan F. Cambridge University Press; Cambridge, UK: 1983. The phonetic bases of speaker recognition. [Google Scholar]
- Owren M.J, Seyfarth R.M, Cheney D.L. The acoustic features of vowels-like grunt calls in chacma baboons (Papio cynocephalus ursinus): implications for production processes and functions. J. Acoust. Soc. Am. 1997;101:2951–2963. doi: 10.1121/1.418523. 10.1121/1.418523 [DOI] [PubMed] [Google Scholar]
- Peterson G.E, Barney H.L. Control methods used in a study of the vowels. J. Acoust. Soc. Am. 1952;24:175–184. 10.1121/1.1906875 [Google Scholar]
- Port K. Serum and saliva cortisol responses and blood lactate accumulating during incremental exercise testing. Int. J. Sports Med. 1991;12:490–494. doi: 10.1055/s-2007-1024720. [DOI] [PubMed] [Google Scholar]
- Ptacek P.H, Sander E.K. Age recognition from voice. J. Speech Hear. Res. 1966;9:273–277. doi: 10.1044/jshr.0902.273. [DOI] [PubMed] [Google Scholar]
- Quetelet L.A.J. Bachelier; Paris: 1835. Sur l'homme et le développement de ses facultés, ou essai de physique sociale. [Google Scholar]
- Reby D, McComb K. Anatomical constraints generate honesty: acoustical cues to age and weight in the roars of red deer stags. Anim. Behav. 2003;65:519–530. 10.1006/anbe.2003.2078 [Google Scholar]
- Riede T, Fitch W.T. Vocal tract length and acoustics of vocalization in the domestic dog (Canis familiaris) J. Exp. Biol. 1999;202:2859–2867. doi: 10.1242/jeb.202.20.2859. [DOI] [PubMed] [Google Scholar]
- Ryan M.J, Keddy-Hector A. Directional patterns of female mate choice and the role of sensory biases. Am. Nat. 1992;139:S4–S35. 10.1086/285303 [Google Scholar]
- Ryan W, Burk K. Perceptual and acoustic correlates of aging in the speech of males. J. Commun. Dis. 1974;7:181–192. doi: 10.1016/0021-9924(74)90030-6. 10.1016/0021-9924(74)90030-6 [DOI] [PubMed] [Google Scholar]
- Shipp T, Hollien H. Perception of aging male voice. J. Speech Hear. Res. 1969;12:703–710. doi: 10.1044/jshr.1204.703. [DOI] [PubMed] [Google Scholar]
- Shirtcliff E.A, Granger D.A, Schwartz E.B, Curran M.J, Overman W. Assessing oestradiol in biobehavioral studies using saliva and blood spots: simple radioimmunoassay protocols, reliability, and comparative validity. Horm. Behav. 2000;38:137–147. doi: 10.1006/hbeh.2000.1614. 10.1006/hbeh.2000.1614 [DOI] [PubMed] [Google Scholar]
- Titze I.R. Prentice Hall; Englewood Cliffs, NJ: 1994. Principles of voice production. [Google Scholar]
- van Dommelen W.A, Moxness B.H. Acoustic parameters in speaker height and weight identification: sex specific behaviour. Lang. Speech. 1995;38:267–287. doi: 10.1177/002383099503800304. [DOI] [PubMed] [Google Scholar]
- Varosanec-Skaric, G. 1999 Relation between voice pleasantness and distribution of the spectral energy. In Proc. XIV Conf. in Phonetic Sciences, San Francisco, pp. 1013–1016.
- Vining R.F, Mc Ginley R.A. The measurement of hormones in saliva: possibilities and pitfalls. J. Steroid Biochem. 1987;27:81–94. doi: 10.1016/0022-4731(87)90297-4. 10.1016/0022-4731(87)90297-4 [DOI] [PubMed] [Google Scholar]
- Wilder C. Vocal aging. In: Weinberg B, editor. Transcripts of the Seventh Symp. Care of the Professional Voice. Part II. Life-Span Changes in the Human Voice. The Voice Foundation; New York: 1978. [Google Scholar]
- Zahavi A. The cost of honesty (further remarks on the handicap principle) J. Theor. Biol. 1977;67:603–605. doi: 10.1016/0022-5193(77)90061-3. [DOI] [PubMed] [Google Scholar]
- Ziztmann M, Nieschlag E. Testosterone levels in healthy men and the relation to behavioural and physical characteristics: facts and constructs. Eur. J. Endocrinol. 2001;144:183–197. doi: 10.1530/eje.0.1440183. 10.1530/eje.0.1440183 [DOI] [PubMed] [Google Scholar]