

Abstract
We show the negative link between genome size and metabolic intensity in tetrapods, using the heart index (relative heart mass) as a unified indicator of metabolic intensity in poikilothermal and homeothermal animals. We found two separate regression lines of heart index on genome size for reptiles–birds and amphibians–mammals (the slope of regression is steeper in reptiles–birds). We also show a negative correlation between GC content and nucleosome formation potential in vertebrate DNA, and, consistent with this relationship, a positive correlation between genome GC content and nuclear size (independent of genome size). It is known that there are two separate regression lines of genome GC content on genome size for reptiles–birds and amphibians–mammals: reptiles–birds have the relatively higher GC content (for their genome sizes) compared to amphibians–mammals. Our results suggest uniting all these data into one concept. The slope of negative regression between GC content and nucleosome formation potential is steeper in exons than in non-coding DNA (where nucleosome formation potential is generally higher), which indicates a special role of non-coding DNA for orderly chromatin organization. The chromatin condensation and nuclear size are supposed to be key parameters that accommodate the effects of both genome size and GC content and connect them with metabolic intensity. Our data suggest that the reptilian–birds clade evolved special relationships among these parameters, whereas mammals preserved the amphibian-like relationships. Surprisingly, mammals, although acquiring a more complex general organization, seem to retain certain genome-related properties that are similar to amphibians. At the same time, the slope of regression between nucleosome formation potential and GC content is steeper in poikilothermal than in homeothermal genomes, which suggests that mammals and birds acquired certain common features of genomic organization.
Keywords: C-value paradox, non-coding DNA, nucleosome formation potential, nuclear size, metabolic rate, ecophysiological genomics
1. Introduction
The role of non-coding DNA, which constitutes the greater part of the eukaryotic genome (e.g. above 98% in the human genome; IHGSC 2001; Venter et al. 2001) remains unclear. The larger genome is associated with a number of phenotypic traits, the most prominent of which are the larger nuclear and cell sizes, longer cell cycle and development and lower metabolic rate (reviewed by Bennett 1998; Petrov 2001; Vinogradov 2004a). The latter trait is of special interest because it might have a clear adaptive significance: the more economical physiology should allow a species to occupy a niche with a low energy supply (Szarski 1983; Vinogradov 1998a, 2005a). However, the link between metabolic rate and genome size was demonstrated only in amniotes (in reptiles, on a limited dataset; Vinogradov 1995, 1997; Gregory 2002; Waltari & Edwards 2002; Olmo 2003; Vinogradov & Anatskaya 2004). The studies of anamniotes were inconclusive, notwithstanding a much broader range of genome sizes (Licht & Lowcock 1991; Waltari & Edwards 2002; Gregory 2003). The obvious problem with the demonstration of a possible link between genome size and metabolic rate in poikilotherms is a strong dependence of the latter parameter on temperature and the adaptation of different species to different temperatures. Thus, it was shown in the example of cell cycle duration that a careful choice of compromise temperature can dramatically increase the strength of its correlation with genome size in closely related species (Vinogradov 1999). However, it is hardly possible to find such a temperature for a diverse dataset of unrelated species. Here, we circumvent this problem and show the link between genome size and heart index as a unified indicator of metabolic rate in poikilothermal and homeothermal vertebrates.
The heart index, or relative heart mass (ratio of heart mass to body mass), is an indicator of intensity of metabolism and is more general than the basal metabolic rate (measured by oxygen consumption) that was studied in relation to genome size in the previous works. The data obtained on amphibians, reptiles, birds and mammals demonstrated that relative heart mass reflects the basal and maximal metabolic rates, cardiac performance, the ability to undertake extended submaximal exercise without oxygen debt and the daily energy expenditure (Clark 1927; Garland 1984; Walsberg et al. 1986; Daan et al. 1990; Weibel et al. 1991; Bishop & Butler 1995; Bishop 1997; Hammond & Diamond 1997; Meerlo et al. 1997; Hoppeler & Weibel 1998; Machida & Aohagi 2001). The comparison between homeotherms and poikilotherms, as well as between birds and mammals, confirms that heart index may be applied as a uniform indicator of metabolic activity for animals belonging to different taxonomic groups (Poupa & Lindström 1983; Else & Hulbert 1985; Bishop 1999; Ostadal et al. 1999). Moreover, it was demonstrated that relative heart mass is a better predictor for animal metabolic activity than other physiological features, such as body mass, pulse rate, haematocrit, haemoglobin concentration, metabolic enzyme activity and blood volume (Jurgens et al. 1981; Else & Hulbert 1983; Walsberg et al. 1986; Meerlo et al. 1997; Hammond et al. 2001). Being a fundamental parameter of organismal design, the heart index shows what part of resources is allocated for oxidative metabolism (and general metabolite turnover at the organismal level) and thus allows the comparison of species in which metabolism proceeds at different temperatures. Although heart design is more advanced in the more complex (higher) vertebrates (as well as the metabolic rate is higher in homeotherms), so is the design of other organs. Therefore, the fraction of overall organismal resources allocated for a specific function can be compared across disparate organisms on the ground of relative mass of the organ responsible for this function.
2. Material and Methods
The heart masses and body masses were measured in the present work or taken from the literature (and provided in Supplementary table 1, see electronic supplementary material). Only wild species were used, because it is known that physiology-related measurements (including relative heart mass) obtained on domesticated animals may not accurately reflect the normal physiological state in the wild (e.g. Clark 1927; Morris & Froelicher 1991; Constable et al. 1998). The heart index (relative heart mass) was estimated as the ratio of heart mass to body mass (expressed as percentage). The data on genome sizes were taken from the Animal Genome Size Database (http://www.genomesize.com/); the data by different of authors for the same species were averaged.
The nucleosome formation potential was determined using the method by Levitsky and co-workers, which was developed and verified on the basis of large experimental datasets of nucleosome positioning sequences (Levitsky et al. 2001a; Levitsky 2004). The genomic contigs, which present the results of high throughput sequencing projects, were downloaded from the genomic section of GenBank (http://www.ncbi.nih.gov/Genbank/) and Ensembl (http://www.ensembl.org/) databases (for human, mouse, chicken, zebrafish Danio rerio and tetraodon Tetraodon nigrovidis) and DoE Joint Genome Institute (http://www.jgi.doe.gov/) (for clawed frog Xenopus tropicalis). For each species, the nucleosome formation potential was determined for 10 000 randomly chosen sequences of 10 kb length extracted from genomic contigs. Also, it was determined separately for coding (exons) and non-coding (introns and intergenic spacers) sequences. For this purpose, the randomly chosen exons, introns and intergenic spacers (10 000 of each sequence type for each species) were extracted from genomic contigs using GenBank and Ensembl annotations. Because nucleosome formation potential is determined in a sliding frame of 160 bp length, only sequences longer than 320 bp were taken to ensure at least twofold prevalence over frame length (the results were similar when the shorter sequences were included, but the statistical scatter was higher). The nucleosome formation potential and GC content were averaged for each sequence over its length. The data on vertebrate erythrocyte nuclear volume were taken from Olmo (1983); the data on genome GC content were taken from Vinogradov (1998b). The statistical analyses were done using Statgraphics (Statistical Graphics Co.) and Statistica (StatSoft, Inc.) software.
3. Results and discussion
We found two separate regression lines of heart index on genome size for two classes of homeothermal vertebrates (mammals and birds; figure 1). The difference between regression lines is highly significant (p<10−4). These separate regression lines of heart index on genome size correspond to the two separate regression lines of basal metabolic rate on genome size for mammals and birds: birds have a higher basal metabolic rate (body mass-corrected) and a lower genome size than mammals, but their metabolic rate is not high enough for their points to lie on the continuation of regression line for mammals (fig. 5 in Vinogradov (1995)), similar to what is seen in figure 1. Surprisingly, the two classes of poikilothermal vertebrates (amphibians and reptiles) append separately to the two regression lines for homeotherms (mammals and birds, respectively; figure 1), which suggests that each of them has a relationship between intensity of metabolism and genome size that is similar to its homeothermal counterpart. (Although the slopes of regression for mammals and amphibians slightly differ, the amphibian slope is much closer to mammalian than to reptilian–avian, and it deviates from the mammalian in the direction opposite to reptilian–avian.) It is noteworthy that the reptiles–birds and the amphibians–mammals regression lines seem to converge at the same uppermost limit of heart index, with bats being the closest mammals to birds (figure 1). The negative correlation between heart index and genome size holds in separate tetrapod groups (legend to figure 1).
Figure 1.

Regression of heart index (ratio of heart mass to body mass) on genome size (circles, birds; squares, reptiles; triangles, mammals; diamonds, amphibians). Both lines are approximated by second-order polynomial regression (note that even in this case the regression for reptiles–birds looks linear). If approximated by linear regression, for reptiles–birds: r=−0.89, p<10−8, n=72; for amphibians–mammals: r=−0.92, p<10−8, n=66 (the difference between slopes of regression lines is highly significant, p<10−8). The regression holds within separate phylogenetic groups: birds, r=−0.58, p<10−4, n=53 (Spearman r=−0.53, p<10−4); reptiles, r=−0.82, p<10−4, n=19 (Spearman r=−0.75, p<10−3); mammals, r=−0.76, p<10−6, n=40 (Spearman r=−0.73, p<10−4); amphibians, r=−0.88, p<10−6, n=26 (Spearman r=−0.90, p<10−4); anurans, r=−0.61, p<0.01, n=16 (Spearman r=−0.73, p<0.01); caudata, r=−0.71, p<0.02, n=10 (Spearman r=−0.59, p<0.05). The significance levels for pair-wise differences between the slopes of regression lines: birds versus reptiles, p>0.8; mammals versus amphibians, p<0.01; anurans versus caudata, p>0.9. (Dotted lines, confidence intervals for p=0.95.) If controlled for body mass using multiple regression analysis, the picture was similar.
In turn, the two separate regression lines of heart index on genome size correspond to the two separate regression lines of GC content on genome size for amphibians–mammals and reptiles–birds: reptiles and birds have the relatively higher GC content (for their genome sizes) than amphibians and mammals, which suggests a distinct pattern of evolutionary dynamics of the genome (figs. 2B and 4A in Vinogradov (1998b)).
It is now widely accepted that there was a fundamental split in the evolution of early tetrapods between Synapsida (mammals and their extinct relatives) and Reptilia (reptiles and birds) soon after the appearance of stem tetrapods (Dilkes & Reisz 1996; Kumar & Hedges 1998; Rubidge & Sidor 2001; Ruta et al. 2003). Contrary to the popular name ‘mammal-like reptiles’, early synapsids are not reptiles in the phylogenetic sense (Dilkes & Reisz 1996). It is plausible that the reptiles–birds clade evolved special relationships between the intensity of metabolism and genome size, and between GC content and genome size, whereas synapsids retained the amphibian-like relationships.
How can the GC content of genome be related to metabolic rate? The GC content is supposed to negatively correlate with chromatin condensation because certain physical properties of the DNA helix (such as bendability and curvature), which are important for chromatin condensation, depend on GC content (Vinogradov 2001, 2003a). In human and chicken cells, the GC-rich DNA sequences tend to be located in the diffuse, open chromatin of the interphase nuclei, whereas the GC-poor sequences tend to be located in the more condensed chromatin (Saccone et al. 2002). It was recently shown that chromatin condensation negatively and very strongly (r=−0.97) correlates with GC content in human cells (Gilbert et al. 2004). The nucleosome formation potential of DNA sequence in the human genome was recently found to correlate negatively with GC content (Vinogradov 2005b). Here, we show that the latter is true for all model vertebrate genomes (figure 2). (Because only a few poikilothermal genomes are sequenced, we also studied fish genomes to confirm the generality of this correlation.)
Figure 2.

Regression of nucleosome formation potential on GC content in vertebrate genomes (green, human, r=−0.70, p<10−8; blue, chicken, r=−0.68, p<10−8; yellow, mouse, r=−0.68, p<10−8; red, clawed frog, r=−0.67, p<10−8; brown, zebrafish, r=−0.73, p<10−8; violet, tetraodon, r=−0.92, p<10−8). For each species, the nucleosome formation potential and GC content were determined for 10 000 sequences of 10 kb length, randomly extracted from genomic contigs (and averaged for each sequence over its length). (Dashed lines, confidence intervals for p=0.95.)
It is known that a high local concentration of nucleosomes is necessary for the higher-order chromatin condensation and that the higher chromatin condensation correlates with a lower nuclear size (e.g. Belmont et al. 1984; Jenuwein & Allis 2001; Horn & Peterson 2002; Hill et al. 2004). Therefore, it can be expected that the GC-richer genomes have the more open chromatin and form the relatively larger nuclei. We found that this is true: there are two separate regression lines of erythrocyte nuclear volume on genome size for reptiles–birds and for amphibians (mammals cannot be used because they have erythrocytes without nuclei). The nuclear volumes of reptiles–birds are relatively larger for their genome sizes (figure 3), which is in agreement with the negative dependence of chromatin condensation on GC content. Also, we found a positive correlation between erythrocyte nuclear volume and genome GC content at fixed genome size (partial r=0.32, p<10−3, n=24). Thus, it seems that genome GC content can modulate nuclear size independently of genome size.
Figure 3.
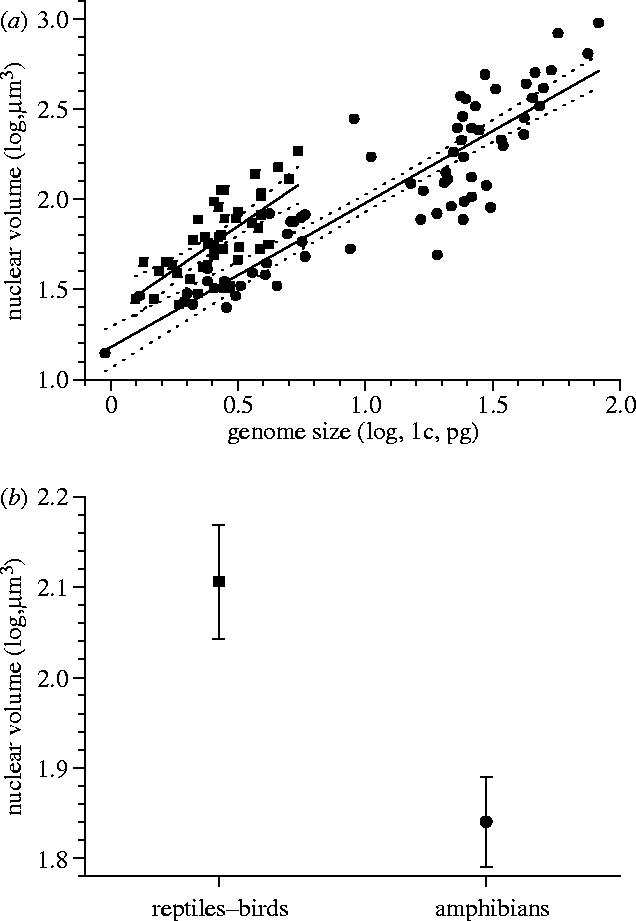
Genome size and erythrocyte nuclear volume. (a) Regression of nuclear volume on genome size (squares, reptiles–birds; circles, amphibians). For reptiles–birds: r=0.70, p<10−6, n=47; for amphibians: r=0.90, p<10−8, n=68. In linear regression, the difference between the intercepts is highly significant (p<10−4). (Dotted lines, confidence intervals for p=0.95.) (b) The difference in mean nuclear volume between the reptiles–birds and amphibians with the effect of genome size being removed using GLM (general linear model): means with 95% LSD (least significant difference) intervals (for difference, p<10−6).
It is noteworthy that the slope of regression between nucleosome formation potential and GC content is steeper in poikilothermal than in homeothermal genomes (figure 2). The latter fact is possibly relevant to the isochoric structure (relatively homogenous genomic regions differing in GC content), which is characteristic for homeothermal genomes and which might evolve in the ancestor amniote genome or be acquired independently in the evolution of mammals and birds (reviewed in Bernardi (2004)). The slope is practically equal in the human and chicken genomes, whereas it is steeper in the mouse genome (figure 2), which is in agreement with the fact that the isochoric structure is less pronounced in rodents compared to other mammals (e.g. Douady et al. 2000; Smith & Eyre-Walker 2002; Vinogradov 2003b). In the human genome, the slope of regression between nucleosome formation potential and GC content is steeper in exons as compared to non-coding DNA (introns and intergenic spacers; Vinogradov 2005b). Here, we show that this is true for all sequenced vertebrate genomes (see figure 4 in the electronic supplementary material). (In amphibians, this distinction cannot be studied because there is as yet no annotation on intron–exon boundaries for the clawed frog.) Also, introns and intergenic spacers generally have the lower GC content than exons, and, correspondingly, the higher nucleosome formation potential (see figure 4 in the electronic supplementary material). These facts support the notion that non-coding DNA plays a special role in the orderly chromatin formation (e.g. Trifonov 1993; Zuckerkandl 1997; Levitsky et al. 2001b; Vinogradov 2005b).
The redundant non-coding DNA is supposed to serve for adjustment of metabolic rate mediated by a change in general cellular parameters (such as nuclear size, chromatin condensation, nucleocytoplasmic ratio), which in multicellulars can be independent of body size (Szarski 1983; Cavalier-Smith 1985; Vinogradov 1995, 1997, 1998a; Gregory 2002; Kozlowski et al. 2003; Olmo 2003; Vinogradov & Anatskaya 2004; Vinogradov 2005a). The link between genome size and metabolic rate can be considered as an example of the symmorphosis, a general principle of evolutionary biology defined as a quantitative match of structural design and functional demand (Weibel et al. 1991; Diamond & Hammond 1992; Weibel 2000). The non-coding DNA was also supposed to play a ‘buffering’ role, damping the effect of solvent fluctuations on the nuclear machinery (Vinogradov 1998a). Recently, it was shown in comparison of two closely related amphibian species differing in genome size that chromatin condensation was steadier and its reaction to changes in solvent composition (caused by elevated extracellular salinity) was more inertial in species with the larger genome, which is in agreement with the buffering model (Vinogradov 2005a). The ability of DNA to act as ‘buffer’ to control the concentration of DNA-binding proteins and smaller solutes was even used for the development of experimental methods for investigation of histone–DNA interaction and DNA thermostability (Thastrom et al. 2004; Volker & Breslauer 2005). It was also found that both the ratio of non-coding to coding DNA lengths and the nucleosome formation potential are higher in (and around) the tissue-specific genes compared to housekeeping genes, which indicates that non-coding DNA can be involved in chromatin-mediated gene suppression in those tissues where a given gene should not be expressed (Vinogradov 2004b, 2005b; Ganapathi et al. 2005).
Although it was recently shown that in plants larger genomes can increase the risk of extinction, in vertebrates the picture is more complicated (Vinogradov 2003c, 2004c). Interestingly, the relationship between genome size and extinction risk also distinguishes the reptiles–birds versus amphibians–mammals: it is unambiguously shown only in the former (Vinogradov 2004c). The reptiles–birds have the smallest genomes among tetrapods, which suggests that their selection against the accumulation of redundant DNA is generally stronger. The steeper regression slope of heart index on genome size in reptiles–birds compared to amphibians–mammals (figure 1) also indicates that changes of genome size are more critical in them. Therefore, it is possible that genome enlargement can be beneficial in reptiles–birds only in a relatively short evolutionary time-frame, but later it might become maladaptive at the species and lineage levels. It is noteworthy that each main tetrapod group seems to occupy a separate space on the plot of genome size versus heart index (figure 1). This partitioning of ‘physiological space’ may reflect some fundamental features of ecospace partitioning in tetrapod evolution.
4. Conclusion
Our results show that the negative link between genome size and metabolic intensity (body mass-corrected) exists in all tetrapods. They help explain the biological significance of two separate regression lines between metabolic rate and genome size for birds and mammals (Vinogradov 1995), and between GC content and genome size for reptiles–birds and amphibians–mammals (Vinogradov 1998b), and suggest integrating all these data into one concept. The chromatin condensation and nuclear size are supposed to be key parameters that accommodate the effects of both genome size and GC content and connect them with metabolic intensity. Furthermore, these data suggest that mammals (unlike reptiles and birds), although evolving a more complex general organization, retained certain genome-related properties that seem to be similar to those of amphibians. At the same time, the slope of regression between GC content and nucleosome formation potential is steeper in poikilothermal than in homeothermal genomes, which indicates that mammals and birds acquired certain common features of genomic organization.
Acknowledgments
We thank N. N. Smirnova and S. N. Litvinchuk for kindly providing a number of animals, and L. A. Merriam for measuring of Necturus body mass and heart index. This work was supported by the Russian Foundation for Basic Research (RFBR) and by the Programme of the Presidium of the Russian Academy of Sciences ‘Molecular and Cellular Biology’ (MCB RAS).
Supplementary Material
References
- Belmont A, Kendall F.M, Nicolini C. Three-dimensional intranuclear DNA organization in situ: three states of condensation and their redistribution as a function of nuclear size near the G1-S border in HeLa S-3 cells. J. Cell Sci. 1984;65:123–138. doi: 10.1242/jcs.65.1.123. [DOI] [PubMed] [Google Scholar]
- Bennett M.D. Plant genome values: how much do we know? Proc. Natl Acad. Sci. USA. 1998;95:2011–2016. doi: 10.1073/pnas.95.5.2011. 10.1073/pnas.95.5.2011 [DOI] [PMC free article] [PubMed] [Google Scholar]
- Bernardi G. Elsevier; Amsterdam: 2004. Structural and evolutionary genomics. Natural selection in genome evolution. [Google Scholar]
- Bishop C.M. Heart mass and the maximum cardiac output of birds and mammals: implications for estimating the maximum aerobic power input of flying animals. Phil. Trans. R. Soc. B. 1997;352:447–456. 10.1098/rstb.1997.0032 [Google Scholar]
- Bishop C.M. The maximum oxygen consumption and aerobic scope of birds and mammals: getting to the heart of the matter. Proc. R. Soc. B. 1999;266:2275–2281. doi: 10.1098/rspb.1999.0919. 10.1098/rspb.1999.0919 [DOI] [PMC free article] [PubMed] [Google Scholar]
- Bishop C.M, Butler P.J. Physiological modeling of oxygen consumption in birds during flight. J. Exp. Biol. 1995;198:2153–2163. doi: 10.1242/jeb.198.10.2153. [DOI] [PubMed] [Google Scholar]
- Cavalier-Smith T. Cell volume and the evolution of eukaryote genome size. In: Cavalier-Smith T, editor. The evolution of genome size. Wiley; Chichester: 1985. pp. 105–184. [Google Scholar]
- Clark A.J. Macmillan; New York: 1927. Comparative physiology of the heart. [Google Scholar]
- Constable P, Hinchcliff K, Demma N, Callahan M, Dale B, Fox K, Adams L, Wack R, Kramer L. Electrocardiographic consequences of a peripatetic lifestyle in gray wolves Canis lupus. Comp. Biochem. Physiol. A Mol. Integr. Physiol. 1998;120:557–563. doi: 10.1016/s1095-6433(98)10066-1. 10.1016/S1095-6433(98)10066-1 [DOI] [PubMed] [Google Scholar]
- Daan S, Masman D, Groenewold A. Avian basal metabolic rates: their association with body composition and energy expenditure in nature. Am. J. Physiol. 1990;259:R333–R340. doi: 10.1152/ajpregu.1990.259.2.R333. [DOI] [PubMed] [Google Scholar]
- Diamond J, Hammond K. The matches, achieved by natural selection, between biological capacities and their natural loads. Experientia. 1992;48:551–557. doi: 10.1007/BF01920238. 10.1007/BF01920238 [DOI] [PubMed] [Google Scholar]
- Dilkes D.W, Reisz R.R. First record of a basal synapsid ‘mammal-like reptile’ in Gondwana. Proc. R. Soc. B. 1996;263:1165–1170. [Google Scholar]
- Douady C, Carels N, Clay O, Catzeflis F, Bernardi G. Diversity and phylogenetic implications of CsCl profiles from rodent DNAs. Mol. Phylogenet. Evol. 2000;17:219–230. doi: 10.1006/mpev.2000.0838. 10.1006/mpev.2000.0838 [DOI] [PubMed] [Google Scholar]
- Else P.L, Hulbert A.J. A comparative study of the metabolic capacity of hearts from reptiles and mammals. Comp. Biochem. Physiol. A. 1983;76:553–557. doi: 10.1016/0300-9629(83)90457-7. 10.1016/0300-9629(83)90457-7 [DOI] [PubMed] [Google Scholar]
- Else P.L, Hulbert A.J. An allometric comparison of the mitochondria of mammalian and reptilian tissues: the implications for the evolution of endothermy. J. Comp. Physiol. B. 1985;156:3–11. doi: 10.1007/BF00692920. [DOI] [PubMed] [Google Scholar]
- Ganapathi M, Srivastava P, Das Sutar S.K, Kumar K, Dasgupta D, Pal Singh G, Brahmachari V, Brahmachari S.K. Comparative analysis of chromatin landscape in regulatory regions of human housekeeping and tissue specific genes. BMC Bioinform. 2005;6:126. doi: 10.1186/1471-2105-6-126. 10.1186/1471-2105-6-126 [DOI] [PMC free article] [PubMed] [Google Scholar]
- Garland T., Jr Physiological correlates of locomotory performance in a lizard: an allometric approach. Am. J. Physiol. 1984;247:R806–R815. doi: 10.1152/ajpregu.1984.247.5.R806. [DOI] [PubMed] [Google Scholar]
- Gilbert N, Boyle S, Fiegler H, Woodfine K, Carter N.P, Bickmore W.A. Chromatin architecture of the human genome: gene-rich domains are enriched in open chromatin fibers. Cell. 2004;118:555–566. doi: 10.1016/j.cell.2004.08.011. 10.1016/j.cell.2004.08.011 [DOI] [PubMed] [Google Scholar]
- Gregory T.R. A bird's-eye view of the C-value enigma: genome size, cell size, and metabolic rate in the class Aves. Evolution. 2002;56:121–130. doi: 10.1111/j.0014-3820.2002.tb00854.x. [DOI] [PubMed] [Google Scholar]
- Gregory T.R. Variation across amphibian species in the size of the nuclear genome supports a pluralistic, hierarchical approach to the C-value enigma. Biol. J. Linn. Soc. 2003;79:329–339. 10.1046/j.1095-8312.2003.00191.x [Google Scholar]
- Hammond K.A, Diamond J. Maximal sustained energy budgets in human and animals. Nature. 1997;386:457–462. doi: 10.1038/386457a0. 10.1038/386457a0 [DOI] [PubMed] [Google Scholar]
- Hammond K.A, Szewczak J, Krol E. Effects of altitude and temperature on organ phenotypic plasticity along an altitudinal gradient. J. Exp. Biol. 2001;204:1991–2000. doi: 10.1242/jeb.204.11.1991. [DOI] [PubMed] [Google Scholar]
- Hill D.A, Chiosea S, Jamaluddin S, Roy K, Fischer A.H, Boyd D.D, Nickerson J.A, Imbalzano A.N. Inducible changes in cell size and attachment area due to expression of a mutant SWI/SNF chromatin remodeling enzyme. J. Cell Sci. 2004;117:5847–5854. doi: 10.1242/jcs.01502. 10.1242/jcs.01502 [DOI] [PubMed] [Google Scholar]
- Hoppeler H, Weibel E.R. Limits for oxygen and substrate transport in mammals. J. Exp. Biol. 1998;201:1051–1064. doi: 10.1242/jeb.201.8.1051. [DOI] [PubMed] [Google Scholar]
- Horn P.J, Peterson C.L. Molecular biology. Chromatin higher order folding—wrapping up transcription. Science. 2002;297:1824–1827. doi: 10.1126/science.1074200. 10.1126/science.1074200 [DOI] [PubMed] [Google Scholar]
- IHGSC (International Human Genome Sequencing Consortium) Initial sequencing and analysis of the human genome. Nature. 2001;409:860–921. doi: 10.1038/35057062. 10.1038/35057062 [DOI] [PubMed] [Google Scholar]
- Jenuwein T, Allis C.D. Translating the histone code. Science. 2001;293:1074–1080. doi: 10.1126/science.1063127. 10.1126/science.1063127 [DOI] [PubMed] [Google Scholar]
- Jurgens K.D, Bartels H, Bartels R. Blood oxygen transport and organ weights of small bats and small non-flying mammals. Respir. Physiol. 1981;45:243–260. doi: 10.1016/0034-5687(81)90009-8. 10.1016/0034-5687(81)90009-8 [DOI] [PubMed] [Google Scholar]
- Kozlowski J, Konarzewski M, Gawelczyk A.T. Cell size as a link between noncoding DNA and metabolic rate scaling. Proc. Natl Acad. Sci. USA. 2003;100:14 080–14 085. doi: 10.1073/pnas.2334605100. 10.1073/pnas.2334605100 [DOI] [PMC free article] [PubMed] [Google Scholar]
- Kumar S, Hedges S.B. A molecular timescale for vertebrate evolution. Nature. 1998;392:917–920. doi: 10.1038/31927. 10.1038/31927 [DOI] [PubMed] [Google Scholar]
- Levitsky V.G. RECON: a program for prediction of nucleosome formation potential. Nucleic Acids Res. 2004;32:W346–W349. doi: 10.1093/nar/gkh482. 10.1093/nar/gkh187 [DOI] [PMC free article] [PubMed] [Google Scholar]
- Levitsky V.G, Podkolodnaya O.A, Kolchanov N.A, Podkolodny N.L. Nucleosome formation potential of eukaryotic DNA: calculation and promoters analysis. Bioinformatics. 2001a;17:998–1010. doi: 10.1093/bioinformatics/17.11.998. 10.1093/bioinformatics/17.11.998 [DOI] [PubMed] [Google Scholar]
- Levitsky V.G, Podkolodnaya O.A, Kolchanov N.A, Podkolodny N.L. Nucleosome formation potential of exons, introns, and Alu repeats. Bioinformatics. 2001b;17:1062–1064. doi: 10.1093/bioinformatics/17.11.1062. 10.1093/bioinformatics/17.11.1062 [DOI] [PubMed] [Google Scholar]
- Licht L.E, Lowcock L.A. Genome size and metabolic rate in salamanders. Comp. Biochem. Physiol. B. 1991;100:83–92. 10.1016/0305-0491(91)90089-V [Google Scholar]
- Machida N, Aohagi Y. Electrocardiography, heart rates, and heart weights of free-living birds. J. Zoo Wildl. Med. 2001;32:47–54. doi: 10.1638/1042-7260(2001)032[0047:EHRAHW]2.0.CO;2. [DOI] [PubMed] [Google Scholar]
- Meerlo P, Bolle L, Visser G.H, Masman D, Daan S. Basal metabolic rate in relation to body composition and daily energy expenditure in the field vole, Microtus agrestis. Physiol. Zool. 1997;70:362–369. doi: 10.1086/639616. [DOI] [PubMed] [Google Scholar]
- Morris C.K, Froelicher V.F. Cardiovascular benefits of physical activity. Herz. 1991;16:222–236. [PubMed] [Google Scholar]
- Olmo E. Nucleotype and cell size in vertebrates: a review. Basic Appl. Histochem. 1983;27:227–254. [PubMed] [Google Scholar]
- Olmo E. Reptiles: a group of transition in the evolution of genome size and of the nucleotypic effect. Cytogenet. Genome Res. 2003;101:166–171. doi: 10.1159/000074174. 10.1159/000074174 [DOI] [PubMed] [Google Scholar]
- Ostadal B, Ostadalova I, Dhalla N.S. Development of cardiac sensitivity to oxygen deficiency: comparative and ontogenetic aspects. Physiol. Rev. 1999;79:635–659. doi: 10.1152/physrev.1999.79.3.635. [DOI] [PubMed] [Google Scholar]
- Petrov D.A. Evolution of genome size: new approaches to an old problem. Trends Genet. 2001;17:23–28. doi: 10.1016/s0168-9525(00)02157-0. 10.1016/S0168-9525(00)02157-0 [DOI] [PubMed] [Google Scholar]
- Poupa O, Lindström L. Comparative and scaling aspects of heart and body weights with reference to blood supply of cardiac fibers. Comp. Biochem. Physiol. A. 1983;76:413–421. doi: 10.1016/0300-9629(83)90441-3. 10.1016/0300-9629(83)90441-3 [DOI] [PubMed] [Google Scholar]
- Rubidge B.S, Sidor C.A. Evolutionary patterns among Permo-Triassic therapsids. Annu. Rev. Ecol. Syst. 2001;32:449–480. 10.1146/annurev.ecolsys.32.081501.114113 [Google Scholar]
- Ruta M, Coates M.I, Quicke D.L. Early tetrapod relationships revisited. Biol. Rev. Camb. Phil. Soc. 2003;78:251–345. doi: 10.1017/s1464793102006103. 10.1017/S1464793102006103 [DOI] [PubMed] [Google Scholar]
- Saccone S, Federico C, Bernardi G. Localization of the gene-richest and the gene-poorest isochores in the interphase nuclei of mammals and birds. Gene. 2002;300:169–178. doi: 10.1016/s0378-1119(02)01038-7. 10.1016/S0378-1119(02)01038-7 [DOI] [PubMed] [Google Scholar]
- Smith N.G, Eyre-Walker A. The compositional evolution of the murid genome. J. Mol. Evol. 2002;55:197–201. doi: 10.1007/s00239-002-2316-2. 10.1007/s00239-002-2316-2 [DOI] [PubMed] [Google Scholar]
- Szarski H. Cell size and the concept of wasteful and frugal evolutionary strategies. J. Theor. Biol. 1983;105:201–209. doi: 10.1016/s0022-5193(83)80002-2. [DOI] [PubMed] [Google Scholar]
- Thastrom A, Lowary P.T, Widom J. Measurement of histone–DNA interaction free energy in nucleosomes. Methods. 2004;33:33–44. doi: 10.1016/j.ymeth.2003.10.018. 10.1016/j.ymeth.2003.10.018 [DOI] [PubMed] [Google Scholar]
- Trifonov E.N. Spatial separation of overlapping messages. Comput. Chem. 1993;117:27–31. 10.1016/0097-8485(93)80026-A [Google Scholar]
- Venter J.C, et al. The sequence of the human genome. Science. 2001;291:1304–1351. doi: 10.1126/science.1058040. 10.1126/science.1058040 [DOI] [PubMed] [Google Scholar]
- Vinogradov A.E. Nucleotypic effect in homeotherms: body mass-corrected basal metabolic rate of mammals is related to genome size. Evolution. 1995;49:1249–1259. doi: 10.1111/j.1558-5646.1995.tb04451.x. [DOI] [PubMed] [Google Scholar]
- Vinogradov A.E. Nucleotypic effect in homeotherms: body mass-independent resting metabolic rate of passerine birds is related to genome size. Evolution. 1997;51:220–225. doi: 10.1111/j.1558-5646.1997.tb02403.x. [DOI] [PubMed] [Google Scholar]
- Vinogradov A.E. Buffering: a possible passive-homeostasis role for redundant DNA. J. Theor. Biol. 1998a;193:197–199. doi: 10.1006/jtbi.1997.0629. 10.1006/jtbi.1997.0629 [DOI] [PubMed] [Google Scholar]
- Vinogradov A.E. Genome size and GC-percent in vertebrates as determined by flow cytometry: the triangular relationship. Cytometry. 1998b;31:100–109. doi: 10.1002/(sici)1097-0320(19980201)31:2<100::aid-cyto5>3.0.co;2-q. 10.1002/(SICI)1097-0320(19980201)31:2%3C100::AID-CYTO5%3E3.0.CO;2-Q [DOI] [PubMed] [Google Scholar]
- Vinogradov A.E. Genome in toto. Genome. 1999;42:361–362. 10.1139/gen-42-2-361 [Google Scholar]
- Vinogradov A.E. Bendable genes of warm-blooded vertebrates. Mol. Biol. Evol. 2001;18:2195–2200. doi: 10.1093/oxfordjournals.molbev.a003766. [DOI] [PubMed] [Google Scholar]
- Vinogradov A.E. DNA helix: the importance of being GC-rich. Nucleic Acids Res. 2003a;31:1838–1844. doi: 10.1093/nar/gkg296. 10.1093/nar/gkg296 [DOI] [PMC free article] [PubMed] [Google Scholar]
- Vinogradov A.E. Isochores and tissue-specificity. Nucleic Acids Res. 2003b;31:5212–5220. doi: 10.1093/nar/gkg699. 10.1093/nar/gkg699 [DOI] [PMC free article] [PubMed] [Google Scholar]
- Vinogradov A.E. Selfish DNA is maladaptive: evidence from the plant Red List. Trends Genet. 2003c;19:609–614. doi: 10.1016/j.tig.2003.09.010. 10.1016/j.tig.2003.09.010 [DOI] [PubMed] [Google Scholar]
- Vinogradov A.E. Evolution of genome size: multi-level selection, mutation bias or dynamical chaos? Curr. Opin. Genet. Dev. 2004a;14:620–626. doi: 10.1016/j.gde.2004.09.007. 10.1016/j.gde.2004.09.007 [DOI] [PubMed] [Google Scholar]
- Vinogradov A.E. Compactness of human housekeeping genes: selection for economy or genomic design? Trends Genet. 2004b;20:248–253. doi: 10.1016/j.tig.2004.03.006. 10.1016/j.tig.2004.03.006 [DOI] [PubMed] [Google Scholar]
- Vinogradov A.E. Genome size and extinction risk in vertebrates. Proc. R. Soc. B. 2004c;271:1701–1705. doi: 10.1098/rspb.2004.2776. 10.1098/rspb.2004.2776 [DOI] [PMC free article] [PubMed] [Google Scholar]
- Vinogradov A.E. Genome size and chromatin condensation in vertebrates. Chromosoma. 2005a;113:362–369. doi: 10.1007/s00412-004-0323-3. 10.1007/s00412-004-0323-3 [DOI] [PubMed] [Google Scholar]
- Vinogradov A.E. Noncoding DNA, isochores and gene expression: nucleosome formation potential. Nucleic Acids Res. 2005b;33:559–563. doi: 10.1093/nar/gki184. 10.1093/nar/gki184 [DOI] [PMC free article] [PubMed] [Google Scholar]
- Vinogradov A.E, Anatskaya O.V. Phenological resonance and quantum life history. J. Theor. Biol. 2004;228:417–420. doi: 10.1016/j.jtbi.2004.02.003. 10.1016/j.jtbi.2004.02.003 [DOI] [PubMed] [Google Scholar]
- Volker J, Breslauer K.J. Communication between noncontacting macromolecules. Annu. Rev. Biophys. Biomol. Struct. 2005;34:21–42. doi: 10.1146/annurev.biophys.33.110502.133332. 10.1146/annurev.biophys.33.110502.133332 [DOI] [PubMed] [Google Scholar]
- Walsberg G.E, Lea M.S, Hillman S.S. Individual variation in maximum aerobic capacity: cardiovascular and enzymatic correlates in Rana catesbeiana. J. Exp. Zool. 1986;239:1–5. doi: 10.1002/jez.1402390102. 10.1002/jez.1402390102 [DOI] [PubMed] [Google Scholar]
- Waltari E, Edwards S.V. Evolutionary dynamics of intron size, genome size, and physiological correlates in archosaurs. Am. Nat. 2002;160:539–552. doi: 10.1086/342079. 10.1086/342079 [DOI] [PubMed] [Google Scholar]
- Weibel E.R. Harvard University Press; Boston: 2000. Symmorphosis. [Google Scholar]
- Weibel E.R, Taylor C.R, Hoppeler H. The concept of symmorphosis: a testable hypothesis of structure–function relationship. Proc. Natl Acad. Sci. USA. 1991;88:10 357–10 361. doi: 10.1073/pnas.88.22.10357. [DOI] [PMC free article] [PubMed] [Google Scholar]
- Zuckerkandl E. Junk DNA and sectorial gene repression. Gene. 1997;205:323–343. doi: 10.1016/s0378-1119(97)00543-x. 10.1016/S0378-1119(97)00543-X [DOI] [PubMed] [Google Scholar]
Associated Data
This section collects any data citations, data availability statements, or supplementary materials included in this article.