Abstract
Classic problems in historical biogeography are where did penguins originate, and why are such mobile birds restricted to the Southern Hemisphere? Competing hypotheses posit they arose in tropical–warm temperate waters, species-diverse cool temperate regions, or in Gondwanaland ∼100 mya when it was further north. To test these hypotheses we constructed a strongly supported phylogeny of extant penguins from 5851 bp of mitochondrial and nuclear DNA. Using Bayesian inference of ancestral areas we show that an Antarctic origin of extant taxa is highly likely, and that more derived taxa occur in lower latitudes. Molecular dating estimated penguins originated about 71 million years ago in Gondwanaland when it was further south and cooler. Moreover, extant taxa are inferred to have originated in the Eocene, coincident with the extinction of the larger-bodied fossil taxa as global climate cooled. We hypothesize that, as Antarctica became ice-encrusted, modern penguins expanded via the circumpolar current to oceanic islands within the Antarctic Convergence, and later to the southern continents. Thus, global cooling has had a major impact on penguin evolution, as it has on vertebrates generally. Penguins only reached cooler tropical waters in the Galapagos about 4 mya, and have not crossed the equatorial thermal barrier.
Keywords: penguins, divergence time, biogeography, nuclear DNA, mitochondrial DNA
1. Introduction
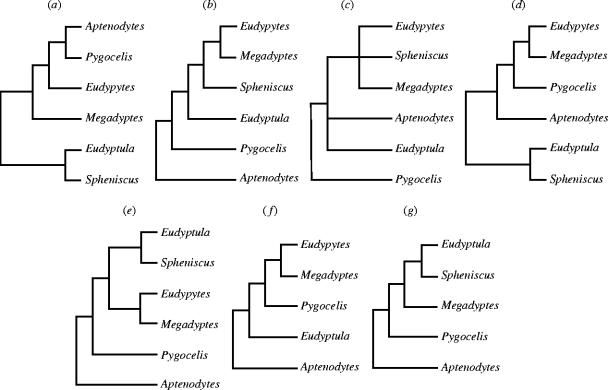
The penguins (Spenisciformes: Spheniscidae) are classified into 18 recent species and more than 40 fossil species extending back 45–60 mya (Stonehouse 1975a; Simpson 1976; Fordyce & Jones 1990; Williams 1995; Clarke et al. 2003). Extant species are assigned to six clearly defined genera comprising the emperor and king penguins (Aptenodytes), six species of crested penguins (Eudyptes) and three species of pygoscelid penguins (Pygoscelis) in Antarctica and cool temperate waters of the Southern Ocean, four species of spheniscid penguins (Spheniscus) of southern Africa and South America, the rare yellow-eyed penguin (Megadyptes) in the New Zealand region, and the little blue and white-flippered penguins of Australia and New Zealand (Eudyptula). Despite an abundance of unique morphological characters that support the monophyly of the Sphenisciformes (Coues 1872; Shufeldt 1901; Meister 1962; Schreiweis 1982; O'Hara 1989; McKitrick 1991), relationships among extant genera remain unresolved. Phenetic studies have been conducted on myology (Schreiweis 1982; O'Hara 1989; McKitrick 1991), behaviour (Jouventin 1982), external morphology and skeletal morphometrics (Livezey 1989), DNA–DNA hybridization data (Sibley & Ahlquist 1990) and cladistic studies on osteology (McKitrick 1991) and integumentary and breeding characters (Giannini & Bertelli 2004), all with different results (figure 1). For example, Aptenodytes is basal is all the phenetic trees, but is more derived in the cladistic trees. Pygoscelis is basal in the cladistic analysis of McKitrick (1991), but is highly derived in that of O'Hara (1989), and is phylogenetically intermediate in other analyses. Megadyptes is closely related to or is the sister taxon of Eudyptes in all trees except the DNA–DNA hybridization one, where Eudyptes was not sampled. The phylogenetic position of Eudyptula also is problematical, appearing as the sister taxon to Spheniscus in the DNA–DNA hybridization and osteological trees (O'Hara 1989; Sibley & Ahlquist 1990), but not in the myology, behaviour and morphometric trees (Schreiweis 1982; Jouventin 1982; Livezey 1989).
Figure 1.
Alternative phylogenetic hypothesis proposed for all extant genera of penguins. Hypothesis including all genera were based on (a) morphological (O'Hara 1989), (b) behavioural (Jouventin 1982), (c) myological (McKitrick 1991), (d) integumentary and breeding (Giannini & Bertelli 2004) and were compared to the topology we obtained with (e) nuclear and mitochondrial DNA sequences. Hypothesis based on (f) myology (Schreiweis 1982) and (g) DNA hybridization studies (Sibley & Ahlquist 1990) did not include all genera and, therefore, were not compared in the AU test.
The lack of concordance in phylogenetic relationships prohibits any reconstruction of ancestral areas needed to infer the possible centre of origin of extant penguins. Competing hypotheses posit that they arose in tropical–warm temperate waters (Stonehouse 1975b), species-diverse cool temperate regions (Sparks & Soper 1987), or in Gondwanaland (Kooyman 2002). We, therefore, obtained nucleotide sequences of the mitochondrial ribosomal RNA genes 12S (668 bp), 16S (905 bp), cytochrome b (cyt b) (1014 bp), COI genes (462 bp) and a nuclear exon of RAG-1 (2802 bp) to estimate phylogenetic relationships among the extant species of penguins, estimate divergence time among species and infer ancestral areas, where penguins may have possibly originated.
2. Material and methods
(a) DNA sequencing
PCR products for nuclear RAG-1 (Groth & Barrowclough 1999), and for mitochondrial 12S and 16S rDNA, COI and cyt b (Pereira & Baker 2004) were sequenced on a LI-COR 4200 bi-directional automated DNA sequencer for all 18 recognized species of penguins and two outgroups (common name; ROM voucher code): Aptenodytes forsteri (emperor penguin; EG3), Aptenodytes patagonicus (king penguin; KI2), Eudyptes chrysocome (rockhopper penguin; JDO2A), Eudyptes chrysolophus (macaroni penguin; MacPen1), Eudyptes pachyrhynchus (fiordland penguin; FC47), Eudyptes robustus (Snares penguin; SCS1), Eudyptes schlegeli (royal penguin; R13M), Eudyptes sclateri (erect-crested penguin; ECHP), Eudyptula minor (little blue penguin; CIB6), Eudyptula albosignata (white-flippered penguin; WFred), Megadyptes antipodes (yellow-eyed penguin; JD64A), Pygoscelis adeliae (adelie penguin; B59), Pygoscelis antarctica (chinstrap penguin; CH1), Pygoscelis papua (gentoo penguin; GPB1), Spheniscus demersus (black-footed penguin; JAP10), Spheniscus humboldti (Peruvian penguin; PCL9), Spheniscus magellanicus (magellanic penguin; MM5), Spheniscus mendiculus (Galapagos penguin; GalPenF), Gavia immer (common loon; 1B-105) and Diomedea exulans (wandering albatross; 1B-111). Sequences are deposited in GenBank under accession numbers DQ137147–DQ137247. Additional outgroups (GenBank accession numbers) were Anser albifrons (DQ137227 obtained for this study, NC_004539), Gallus gallus (M58530, NC_001323), and Struthio camelus (AF143727, NC_002785). The final concatenated alignment, excluding alignment gaps and ambiguously aligned positions, had 5571 nucleotides.
(b) Phylogenetic inference
Heuristic-search bootstrap in maximum parsimony was performed in PAUP v.4.0b10 (Swofford 2001) for 100 replicates and 10 random taxon-additions, with tree-bisection–reconnection branch swapping algorithm in effect. In maximum likelihood (ML) and Bayesian analyses (BA) the DNA substitution model was chosen with the Akaike Information Criterion in Modeltest v.3.0 (Posada & Crandall 1998) for the concatenated dataset (for ML) or for each gene individually (for BA). Bootstrapping in ML was performed in Phyml v.2.1b (Guindon & Gascuel 2003) with 100 replicates assuming a proportion of invariable sites of 0.67, gamma-distributed rate variation of 0.64 and four categories under the general time-reversible substitution model. Partitioned likelihood BA with Markov Chain Monte Carlo sampling was performed in MrBayes v.3.0b4 (Ronquist & Huelsenbeck 2003). Three runs were performed to ensure that the likelihood of independent chains had converged to similar values. Runs were set for two million generations, with one cold and three heated chains, and burn-in was determined by the time to convergence of the likelihood scores. One tree was sampled in every 1000 to guard against autocorrelation among successive samples. Flat priors were assumed for all parameters of the model.
(c) Hypothesis testing
Previous phylogenetic hypotheses for all genera of penguins based on non-molecular characters are depicted in figure 1. The significance of the differences in genus-level relationships among our tree and these hypotheses was evaluated using an approximately unbiased (AU) test (Shimodaira 2002). We estimated site likelihood for the concatenated molecular dataset for each of the competing hypothesis in PAUP 4.0 b10 (Swofford 2001) and applied the AU test as implemented in the program Consel v.0.1f (Shimodaira & Hasegawa 2001).
(d) Mapping ancestral areas
To infer ancestral areas we categorized southernmost breeding ranges of species into broad regions radiating away from the centre of Antarctica, as follows: (0)—Antarctica or any island within the Antarctic convergence, (1)—between this area and latitude 45 °S, (2)—within 45 °S and 30 °S, (3)—below 30 °S. We then used Simmap (Huelsenbeck et al. 2003) to reconstruct and estimate a Bayesian posterior probability of ancestral states for the most basal node for each one of the three alternative genus-level trees obtained in the BA, which were: (i) Aptenodytes as a sister group to all other penguins; (ii) Pygoscelis as sister to all other penguins and (iii) a clade of Aptenodytes and Pygoscelis as sister to all other penguins. We accounted for phylogenetic and mapping uncertainty by weighting this probability by the posterior density distribution of alternative BA trees, which were 0.924, 0.020 and 0.056, respectively. As trees (1) and (2) are identical regarding the ancestral state of the most basal node, their posterior probabilities were summed in further analyses.
(e) Divergence times
For each data partition (mitochondrial, RAG-1 and both combined) we estimated the parameters of the DNA substitution model and branch lengths for the Bayesian topology obtained for the combined dataset in PAUP v.4.0b10 (Swofford 2001) under ML criterion. These branch estimates were then used to obtain divergence times and 95% confidence intervals in r8s v.1.6 under a semi-parametric penalized likelihood approach, using the truncated Newton algorithm (Sanderson 2002). A cross-validation criterion was used to estimate the best smoothing parameter for each partition (Sanderson 2002). Although there is a comparatively rich fossil record for penguins including even larger taxa than present, the phylogenetic placement of these fossil taxa has not been resolved, but they appear to be in the stem group basal to modern crown-group taxa (Clarke et al. 2003). Thus, they are not useful as deep anchor-points in molecular dating (van Tuinen & Hedges 2001) analyses, other than one likely crown-group fossil attributed to Eudyptula dated at 24 mya. We, therefore, used well corroborated external anchor-points from previous molecular dating studies (van Tuinen & Hedges 2001; Paton et al. 2002; van Tuinen & Dyke 2004), which date the common ancestry of Galloanserae and other Neognath birds at 104 mya, and the divergence of Galliformes from Anseriformes at 90 mya.
3. Results and discussion
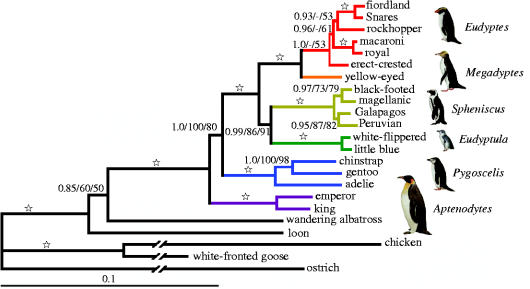
Bayesian analysis under partitioned likelihood, with separate models of evolution estimated for each gene of the 18 extant taxa and a range of outgroup taxa, recovered a well resolved phylogeny with high posterior probabilities at all ingroup nodes (figure 2). Trees with the same topology and strong bootstrap support were also constructed with maximum parsimony and ML, attesting to the robustness of the phylogeny. With the exception of the tree inferred with behavioural data (Jouventin 1982), all previous hypotheses of relationships (figure 1) among extant taxa were rejected (p<0.05) with the AU test (Shimodaira 2002). Behavioural characters are also phylogenetically informative in other birds (e.g. McCracken & Sheldon 1997; Johnson et al. 2000). The genera-level scaffold in the DNA–DNA hybridization tree (Sibley & Ahlquist 1990) was recovered in the consensus tree from each of the other tree-building methods.
Figure 2.
Bayesian estimate of phylogenetic relationships of modern penguins. Phylogenetic reconstruction was based on 2802 bp of RAG-1 and 2889 bp of mitochondrial 12S and 16S rDNA, cyt b and COI, excluding gaps and ambiguously aligned positions. Numbers above branches are Bayesian posterior probabilities/ML bootstrap proportions/MP bootstrap proportion, which are represented as open star when (1.0/100/100). Branches for more distant outgroups were shortened for graphic purposes. A bar represents the expected number of DNA substitutions per site. Each genus is colour-coded. Penguin drawings were modified from del Hoyo et al. (1992), with permission, from Lynx Edicions, Barcelona, Spain.
The genera breeding in the Antarctic region (≥60 °S) (Aptenodytes and Pygoscelis) were basal in all 1951 trees in the Bayesian posterior distribution, whereas clades of more derived genera (Eudyptula, Spheniscus, Megadyptes, Eudyptes) include tip-species that now breed in lower latitudes in cool temperate to tropical areas (figure 2). In the region of New Zealand and surrounding subantarctic islands, Megadyptes is sister to the Eudyptes clade of crested species, and this clade is a sister group to the Spheniscus banded penguins of South America and southern Africa and the little penguins (Eudyptula) of New Zealand and Australia.
Because reconstruction of ancestral areas involves phylogenetic uncertainty we employed Bayesian inference that accounts for this source of error to estimate where extant penguins originated. With respect to the biogeographic node of interest at the root of the penguin phylogeny, the posterior tree distribution was composed only of trees with Aptenodytes, or Pygoscelis or Aptenodytes+Pygoscelis diverging basally. Mapping of geographic regions as binary characters on all trees in the posterior distribution of these tree types gave a posterior probability of 0.967 that the ancestral area of extant penguins was in the Antarctic region (figure 3).
Figure 3.
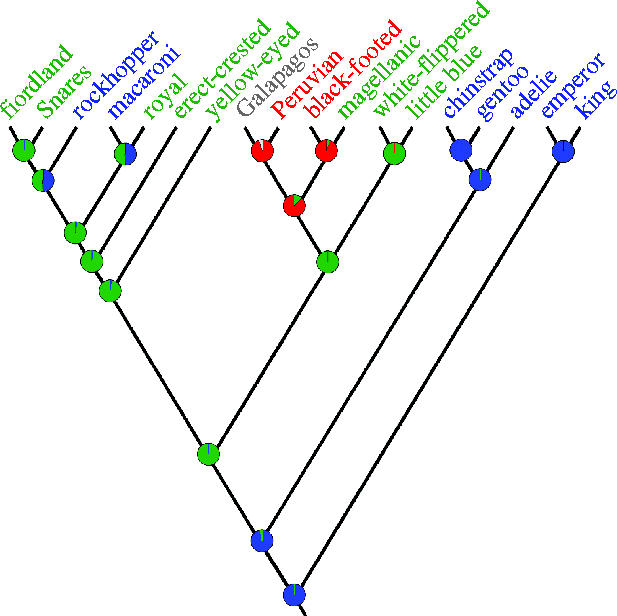
Bayesian estimates of ancestral areas. Areas were defined as southernmost breeding regions for each species within Antarctica and the Antarctic Convergence (blue), outside Antarctic convergence and up to latitude 45 °S (green), between 45 °S and 30 °S (red), and north of 30 °S (grey). Posterior probabilities for each state are shown as a pie diagram in each internal node.
Given this strong inference of an origin in the Antarctic region, the temporal framework of divergence among extant taxa is another key component in reconstructing the historical biogeography of penguins, and specifically in testing the hypothesis of a subsequent radial expansion to account for their present circumpolar distribution. Penalized likelihood rate-smoothing, in which rates of evolution were allowed to vary on different branches of the phylogeny (Sanderson 2002), estimated that penguins and albatrosses shared a common ancestor approximately 71 mya (95% CI 62.4–77.3 mya; figure 4). Similar estimates were obtained using nuclear or mtDNA genes and both combined, indicating that they are robust to choice of genes (table 1). The estimates fit within the speculated time frame of 130–65 mya for the origin of penguins (Williams 1995), and more importantly support the hypothesis of a centre of origin in the core of Gondwanaland (Kooyman 2002) when Antarctica was still attached to Australia and South America, and New Zealand was still relatively close to the supercontinent (ODSN 2004). Additionally, this hypothesis explains why large extinct taxa of fossil penguins have been found on all these fragmented portions of Gondwanaland, having evolved there when the landmasses were closer together. However, by 70 mya the part of Gondwanaland on which penguins probably originated had drifted much further south, and thus would have been cooler than the more northerly location ∼100 mya postulated by Kooyman (2002).
Figure 4.
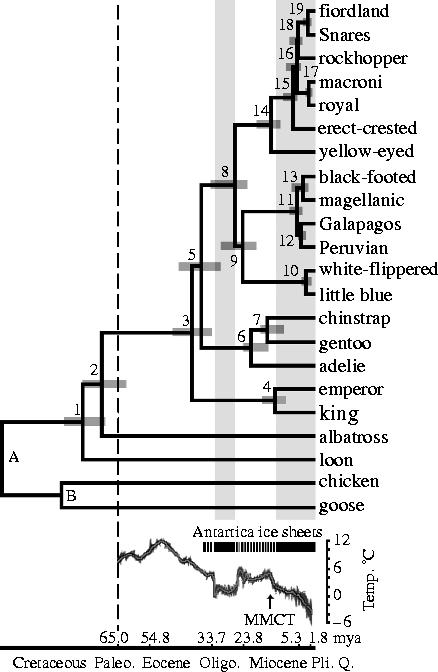
Chronogram of penguin diversification. Nodes A and B were fixed at 104 and 90 myr. Credibility intervals (95%) are indicated by grey bars at numbered internal nodes. Vertical dashed line indicates the K/T boundary. Periods that Antarctica was ice-covered (black continuous bars) are projected as shaded grey rectangles in the chronogram. Ocean temperature is based on high-resolution deep-sea oxygen isotope records. The MMCT is indicated by an arrow. Geological time scale is given as defined by the Geological Society of America.
Table 1.
Estimates of divergence time (and 95% confidence intervals) in million of years ago for the nuclear, mtDNA and both datasets combined. (Nodes are numbered as in figure 4. N.E., not estimated due to identical sequences between species.)
| node | combined | RAG1 | mtDNA |
|---|---|---|---|
| 1 | 77.0 (69.9–83.1) | 77.1 (65.9–85.9) | 77.1 (70.3–83.1) |
| 2 | 70.6 (62.4–77.3) | 70.7 (60.0–80.4) | 68.8 (61.8–75.4) |
| 3 | 40.5 (34.2–47.6) | 40.7 (22.9–51.1) | 41.8 (35.7–48.2) |
| 4 | 13.5 (9.9– 18.2) | 14.4 (8.9–22.0) | 14.4 (10.8–18.9) |
| 5 | 37.7 (31.6–44.7) | 37.8 (29.3–48.3) | 38.5 (32.8–44.9) |
| 6 | 19.2 (15.4–23.9) | 20.7 (15.0–30.5) | 21.4 (17.5–26.3) |
| 7 | 14.1 (10.8–18.3) | 15.2 (10.3–21.9) | 15.9 (12.5–20.1) |
| 8 | 27.8 (22.5–34.4) | 27.8 (20.6–37.3) | 29.6 (24.6–35.3) |
| 9 | 25.1 (20.1–31.2) | 25.3 (17.5 –34.2) | 27.2 (22.5–32.8) |
| 10 | 2.7 (1.4–4.5) | N.E. | 2.9 (1.6–4.7) |
| 11 | 6.1 (4.3–8.4) | 5.9 (3.5–9.3) | 6.3 (4.6–8.5)) |
| 12 | 4.0 (2.9–4.8) | 4.4 (2.1–7.5) | 4.1 (3.1 –4.9) |
| 13 | 3.5 (2.3–4.5) | 3.6 (1.9–4.9) | 3.5 (2.4–4.6) |
| 14 | 15.3 (11.9–19.5) | 16.8 (11.7–23.9) | 16.0 (12.8–19.8) |
| 15 | 8.2 (6.5–11.2) | 9.0 (5.9–14.6) | 8.5 (6.5–11.2) |
| 16 | 7.3 (5.5–9.7) | 7.3 (4.7–10.8) | 7.4 (5.6–9.8) |
| 17 | 1.4 (0.7–2.4) | 1.5 (0.5–3.0) | 1.6 (2.7–2.6) |
| 18 | 6.6 (4.8–8.9) | 6.4 (3.9–9.8) | 6.9 (5.2–9.1) |
| 19 | 1.8 (1.0–2.9) | 1.8 (0.7–3.1) | 1.9 (1.1–2.8) |
The common ancestry of extant penguins dates to about 40 mya (95% CI 34.2–47.6 mya) when Aptenodytes diverged as the basal lineage. Approximately 38 mya (95% CI 31.6–44.7 mya) the Pygoscelis lineage branched off, and later diversified into the adelie penguin (19 mya; 15.4–23.9 mya) and the chinstrap and gentoo penguins (14.1 mya; 10.8–18.3 mya). The common ancestry of the remaining genera was estimated at 27.8 mya (22.5–34.4 mya), followed by the split between Spheniscus and Eudyptula about 25 mya (20.1–31.2 mya). Speciation within Spheniscus is recent, with the two species pairs originating almost contemporaneously in the Pacific and Atlantic oceans in approximately the last 4 myr. Divergence of the white-flippered and little blue penguin dates to about 2.7 mya (1.4–4.5 mya). The yellow-eyed penguin (Megadyptes) diverged from the crested penguins (Eudyptes) about 15 mya (10.3–16.9 mya), which in turn speciated within about the last 8 myr. The fiordland–Snares crested penguin and royal–macaroni penguin species pairs diverged within the last 2 myr, coinciding with the onset of the Pleistocene glaciations.
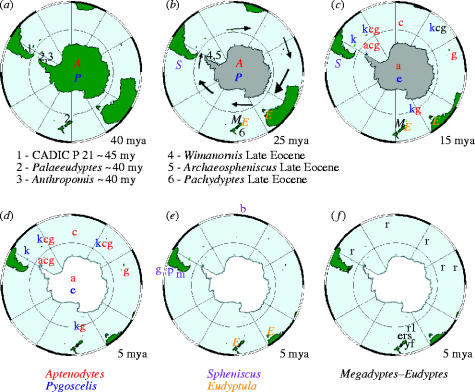
The demise of the larger-bodied putative stem-group taxa near the end of the Eocene about 40 mya coincides roughly with the origin of Antarctic-breeding extant taxa (Aptenodytes and Pygoscelis) in the crown-group, and with the beginning of a general cooling in global climate (figures 4 and 5a). Additionally, this was approximately the time the fish-eating cetaceans evolved, and it has been hypothesized they may have out-competed these larger penguins which probably relied on the same food source (Fordyce & Jones 1990; Williams 1995). Two abrupt cooling periods resulting in the formation of large ice sheets in Antarctica are associated with the diversification of penguin taxa. The first cooling occurred about 34–25 mya, when Spheniscus, Eudyptes and Eudyptula diverged from the older Antarctic genera (figure 5b). These latter ancestral lineages may have dispersed northward by the newly formed circumpolar current, judging from the occurrence of a Eudyptula fossil in New Zealand about 24 mya. As surface waters in the Southern Oceans continued to cool towards the middle Miocene, and the flow of the circumpolar current around Antarctica intensified, another rapid climate transition, the middle miocene climate transition (MMCT) and subsequent increase in Antarctic ice volume occurred between 14 and 12 mya (Shevenell et al. 2004). The MMCT was accompanied by a second bout of cladogenesis that gave rise to multiple species of extant penguins (figure 4) distributed at even lower latitudes (figure 5c), including tips of southern continents (figure 5d–f). If this scenario is run backwards in the future, continued global warming might be expected to drive temperate-adapted species out of lower latitudes towards their ancestral distribution, possibly causing multiple extinctions of existing species.
Figure 5.
Polar stereographic projection to 35 °S at 40, 25, 15 and 5 mya. Reconstructions have continents represented by present-day shorelines (ODSN 2004). Antarctica is indicated as partially (b–c) and fully covered in ice (d–f) (Shevell et al. 2004). Genera are represented by different coloured capital letters, following the coloured names indicated at the bottom. As they start to diversify, species are represented by small letters according to the first letter of common names given in figure 2, except royal penguin represented by r1. Oldest and biggest penguin fossils (Simpson 1976; Clarke et al. 2004) are numbered 1–6 and projected at (a) 40 and (b) 25 mya. The Antarctic circumpolar current, indicated by arrows in the reconstruction at 25 mya only, was formed at the end of the Oligocene.
Although there are uncertainties in molecular clock calibrations and fossil age estimates, it is remarkable that the two episodes of taxon diversification in extant penguins coincide with the major global cooling events when Antarctica was ice-encrusted. We hypothesize that the northwards dispersal and isolation of penguins in widely separated islands and continents in the temperate regions of the southern oceans promoted allopatric speciation, thus accounting for current species diversity. Only representatives of the Aptenodytes and Pygoscelis lineages stayed in Antarctica and adapted to the colder conditions, although they too would have exited during the glacial maxima of the Pleistocene when breeding areas were unreachable.
Furthermore, the restriction of penguins to the Southern Hemisphere, a geographic distribution that has long puzzled biogeographers, is hereby explained. The only species to penetrate into the tropics, the Galapagos penguin, is estimated to have diverged from the Peruvian penguin about 4 mya along the Pacific coast of South America. Thus, penguins have only recently arrived in the tropics, aided by cool waters from the Humboldt Current, long after alcids had radiated to occupy equivalent ecological niches in the Northern Hemisphere (Friesen et al. 1996). Nevertheless, competitive exclusion is unlikely to have restricted penguins to south of the equator, but instead warmer tropical seas apparently constitute a thermal barrier to an invasion of the northern hemisphere by cool-temperate adapted modern taxa.
Acknowledgments
For the collection of blood or tissue samples we thank Dee Boersma, Colleen Cassidy-St Clair, John Cooper, John Croxall, John Darby, Kyra Mills, Graham Robertson and Sue Triggs. This work was supported by an operating grant to A. J. B. from the Natural Sciences and Engineering Research Council of Canada, the Royal Ontario Museum Foundation and the National Science Foundation (AToL). Penguin drawings were modified from del Hoyo et al. (1992; Handbook of the birds of the world. vol. 1. Ostrich to ducks. Barcelona, Spain: Lynx Edicions) with the kind permission of the publisher.
References
- Clarke J.A, Olivero E.B, Puerta P. Description of the earliest fossil penguin from South America and the first Paleogene vertebrate locality of Tierra del Fuego, Argentina. Am. Mus. Novitates. 2003;3423:1–18. 10.1206/0003-0082(2003)423%3C0001:DOTEFP%3E2.0.CO;2 [Google Scholar]
- Coues E. Material for a monograph of the Spheniscidae. Proc. Acad. Nat. Sci. Philad. 1872;1872:170–212. [Google Scholar]
- del Hoyo J, Elliot A, Sargatal J, editors. Handbook of the birds of the world. Ostrich to ducks. vol. 1. Lynx Edicions; Barcelona, Spain: 1992. pp. 140–160. [Google Scholar]
- Fordyce R.E, Jones C.M. Penguin history and new fossil material from New Zealand. In: Davis L.S, Darby J.T, editors. Penguin biology. Academic Press; San Diego, CA: 1990. pp. 419–446. [Google Scholar]
- Friesen V.L, Baker A.J, Piatt J.F. Phylogenetic relationships within the Alcidae (Charadriiformes: Aves) inferred using total molecular evidence. Mol. Biol. Evol. 1996;13:359–367. doi: 10.1093/oxfordjournals.molbev.a025595. [DOI] [PubMed] [Google Scholar]
- Giannini N.P, Bertelli S. Phylogeny of extant penguins based on integumentary and breeding characters. The Auk. 2004;121:422–434. [Google Scholar]
- Groth J.G, Barrowclough G.F. Basal divergence in birds and the phylogenetic utility of the nuclear RAG-1 gene. Mol. Phylogenet. Evol. 1999;12:115–123. doi: 10.1006/mpev.1998.0603. 10.1006/mpev.1998.0603 [DOI] [PubMed] [Google Scholar]
- Guindon S, Gascuel O. A simple, fast and accurate method to estimate large phylogenies by maximum-likelihood. Syst. Biol. 2003;52:696–704. doi: 10.1080/10635150390235520. 10.1080/10635150390235520 [DOI] [PubMed] [Google Scholar]
- Huelsenbeck J.P, Nielsen R, Bollback J.P. Stochastic mapping of morphological characters. Syst. Biol. 2003;52:131–158. doi: 10.1080/10635150390192780. [DOI] [PubMed] [Google Scholar]
- Johnson K.P, McKinney F, Wilson R, Sorenson M.D. The evolution of postcopulatory displays in dabbling ducks (Anatini): a phylogenetic perspective. Anim. Behav. 2000;59:953–963. doi: 10.1006/anbe.1999.1399. 10.1006/anbe.1999.1399 [DOI] [PubMed] [Google Scholar]
- Jouventin P. Visual and vocal signals in penguins, their evolution and adaptive characters. Adv. ethol. 1982;24:1–149. [Google Scholar]
- Kooyman G.L. Evolutionary and ecological aspects of some Antarctic and sub-Antarctic penguin distributions. Oecologia. 2002;130:485–495. doi: 10.1007/s00442-001-0836-x. 10.1007/s00442-001-0836-x [DOI] [PubMed] [Google Scholar]
- Livezey B.C. Morphometric patterns in recent and fossil penguins (Aves, Sphenisciformes) J. Zool. 1989;219:269–307. doi: 10.1111/j.1469-7998.1989.tb02582.x. [DOI] [PMC free article] [PubMed] [Google Scholar]
- McCracken K.G, Sheldon F.H. Avian vocalizations and phylogenetic signal. Proc. Natl Acad. Sci. USA. 1997;94:3833–3836. doi: 10.1073/pnas.94.8.3833. 10.1073/pnas.94.8.3833 [DOI] [PMC free article] [PubMed] [Google Scholar]
- McKitrick M.C. Phylogenetic analysis of avian hindlimb musculature. Misc. Pub. Mus. Zool., Univ. Mich. 1991;179 1–89. [Google Scholar]
- Meister W. Histological structure of the long bones of penguins. Anat. Rec. 1962;143:377–388. doi: 10.1002/ar.1091430408. 10.1002/ar.1091430408 [DOI] [PubMed] [Google Scholar]
- ODSN—Ocean Drilling Stratigraphic Network. 2004 ODSN Plate Tectonic Reconstruction Service. http://www.odsn.de/odsn/services/paleomap/paleomap.html (last accessed December 16, 2004).
- O'Hara R.J. An estimate of the phylogeny of the living penguins (Aves: Spheniscidae) Am. Zool. 1989;29:11A. [Google Scholar]
- Paton T, Haddrath O, Baker A.J. Complete mitochondrial DNA genome sequences show that modern birds are not descended from transitional shorebirds. Proc. R. Soc. B. 2002;269:839–846. doi: 10.1098/rspb.2002.1961. 10.1098/rspb.2002.1961 [DOI] [PMC free article] [PubMed] [Google Scholar]
- Pereira S.L, Baker A.J. Vicariant speciation of curassows (Aves, Cracidae): a hypothesis based on mitochondrial DNA phylogeny. Auk. 2004;121:682–694. [Google Scholar]
- Posada D, Crandall K.A. Modeltest: testing the model of DNA substitution. Bioinformatics. 1998;14:817–818. doi: 10.1093/bioinformatics/14.9.817. 10.1093/bioinformatics/14.9.817 [DOI] [PubMed] [Google Scholar]
- Ronquist F.R, Huelsenbeck J.P. MrBayes: Bayesian phylogenetic inference under mixed models. Bioinformatics. 2003;19:1572–1574. doi: 10.1093/bioinformatics/btg180. 10.1093/bioinformatics/btg180 [DOI] [PubMed] [Google Scholar]
- Sanderson M.J. Estimating absolute rates of molecular evolution and divergence times: a penalized likelihood approach. Mol. Biol. Evol. 2002;19:101–109. doi: 10.1093/oxfordjournals.molbev.a003974. [DOI] [PubMed] [Google Scholar]
- Schreiweis D.O. A comparative study of the appendicular musculature of penguins (Aves: Sphenisciformes) Smithson. Contrib. Zool. 1982;341:1–46. [Google Scholar]
- Shevenell A.E, Kennett J.P, Lea D.W. Middle Miocene southern ocean cooling and Antarctic cryosphere expansion. Science. 2004;305:1766–1770. doi: 10.1126/science.1100061. 10.1126/science.1100061 [DOI] [PubMed] [Google Scholar]
- Shimodaira H. An approximately unbiased test of phylogenetic tree selection. Syst. Biol. 2002;51:492–508. doi: 10.1080/10635150290069913. 10.1080/10635150290069913 [DOI] [PubMed] [Google Scholar]
- Shimodaira H, Hasegawa M. Consel: for assessing the confidence of phylogenetic tree selection. Bioinformatics. 2001;17:1246–1247. doi: 10.1093/bioinformatics/17.12.1246. 10.1093/bioinformatics/17.12.1246 [DOI] [PubMed] [Google Scholar]
- Shufeldt R.W. Osteology of penguins. J. Anat. Physiol., Lond. 1901;15:390–404. [PMC free article] [PubMed] [Google Scholar]
- Sibley C.G, Ahlquist J.E. Yale University Press; New Haven, CT: 1990. Phylogeny and classification of birds: a study in molecular evolution. [Google Scholar]
- Simpson G.G. Yale University Press; New Haven, CT: 1976. Penguins: past and present, here and there. [Google Scholar]
- Sparks J, Soper T. David and Charles; London: 1987. Penguins. [Google Scholar]
- Stonehouse B. MacMillan Press Ltd; London: 1975a. Penguin biology. [Google Scholar]
- Stonehouse B. Adaptation in polar and subpolar penguins (Spheniscidae) In: Holdgate M.W, editor. Antarctic ecology. Academic Press; San Diego, CA: 1975b. pp. 526–541. [Google Scholar]
- Swofford D.L. Sinauer Associates, Inc; Sunderland, MA: 2001. PAUP*: Phylogenetic analysis using parsimony (*and other methods) Version 4.0b10. [Google Scholar]
- van Tuinen M, Dyke G.J. Calibration of galliform molecular clocks using multiple fossils and genetic partitions. Mol. Phylogenet. Evol. 2004;30:74–86. doi: 10.1016/s1055-7903(03)00164-7. 10.1016/S1055-7903(03)00164-7 [DOI] [PubMed] [Google Scholar]
- van Tuinen M, Hedges S.B. Calibration of avian molecular clocks. Mol. Biol. Evol. 2001;18:206–213. doi: 10.1093/oxfordjournals.molbev.a003794. [DOI] [PubMed] [Google Scholar]
- Williams T.D. Oxford University Press; Oxford, UK: 1995. The penguins. [Google Scholar]


