

Abstract
Genetic variance in characters under natural selection in natural populations determines the way those populations respond to that selection. Whether populations show temporal and/or spatial constancy in patterns of genetic variance and covariance is regularly considered, as this will determine whether selection responses are constant over space and time. Much less often considered is whether characters show differing amounts of genetic variance over the life-history of individuals. Such age-specific variation, if present, has important potential consequences for the force of natural selection and for understanding the causes of variation in quantitative characters. Using data from a long-term study of the mute swan Cygnus olor, we report the partitioning of phenotypic variance in timing of breeding (subject to strong natural selection) into component parts over 12 different age classes. We show that the additive genetic variance and heritability of this trait are strongly age-dependent, with higher additive genetic variance present in young and, particularly, old birds, but little evidence of any genetic variance for birds of intermediate ages. These results demonstrate that age can have a very important influence on the components of variation of characters in natural populations, and consequently that separate age classes cannot be assumed to be equivalent, either with respect to their evolutionary potential or response.
Keywords: additive genetic variance, age-dependence, animal model, heritability, senescence
1. Introduction
Understanding evolution by natural selection, in particular prediction of its pace and direction, requires understanding of the genetic and environmental influences on a character, as well as the form of selection on that character (Lynch & Walsh 1998). This fundamental principle is translated into the breeder's equation (Falconer & Mackay 1996), derived from quantitative genetic theory, in which the extent of evolutionary response in a quantitative trait is proportional to the force of selection and heritability (h2) of a trait. This relationship was originally used by animal breeders to optimize genetic selection in domestic cattle (Cameron 1997), but recently, there has been increased interest in applying this methodology to natural populations in order to understand their evolutionary dynamics and potential (e.g. Grant & Grant 1995; Geber & Griffen 2003; Kruuk 2004). As most studies of wild populations are limited to a single location, and over a relatively short-time span, the variance–covariance matrix for focal traits is assumed to be stable over time and space, for the sake of simplicity. The validity of this assumption has been the subject of much debate (e.g. Roff & Mousseau 1999; Steppan et al. 2002; Björklund 2004).
An additional source of variation that is less often considered is that patterns of genetic variance might change with respect to the age of individuals. Several types of study in laboratory or domestic animal species point to the possibility of age-dependence in the expression of genetic variation, including work on changes in additive genetic variance (VA) and maternal effects variance (VM) during ontogeny in mice (e.g. Cheverud et al. 1983; Atchley 1984) and age-related variation in heritability and genetic correlations for body weight in cattle (e.g. Snyman et al. 1995; Albuquerque & Meyer 2001a,b). Finally, evolutionary biologists interested in the evolution of senescence have measured age-specific genetic variance and covariance for various life-history traits in Drosophila melanogaster to test predictions from evolutionary theories of senescence (e.g. Tatar et al. 1996; Hughes et al. 2002; Snoke & Promislow 2003). Hence, there is repeated evidence from laboratory-based studies for changes in genetic variances and covariances over ages, although the first two types of study concentrate on morphological traits, and on early ontogeny.
Despite this evidence, age-specific genetic variance has rarely been investigated in natural populations. Those studies of which we are aware (see table 1) are largely restricted to analyses of body mass or other morphometric traits, in an attempt to uncover effects of genes on growth early in life. Age-specific estimates for later life stages include two long-term studies of birds (van Noordwijk et al. 1988; Potti & Merino 1994) where heritability of a size trait was compared between measures on nestlings and measures on recruits, the difference between the two being explained by post-fledging selection affecting levels of environmental variance. Also, in a 25-year study of the bighorn sheep (Ovis canadensis), Réale et al. (1999) found heritability of body mass to be moderate for lambs and yearlings, very low for two-year-olds and then increasing for older age classes. Finally, in the only attempt known to us to estimate heritability of a non-morphological trait at different ages from wild individuals, King et al. (2004) showed age-dependence in the heritability of testosterone level during the first year of life of male garter snakes (Thamnophis sirtalis).
Table 1.
Studies estimating age-specific heritabilities in natural populations.
| species | trait | number of age classes | age classes | method of estimating heritability | reference |
|---|---|---|---|---|---|
| Geospiza fortis | body mass, beak length, beak depth | 2 | 8–9 days, 7–10 weeks | full-sib ANOVA | Price & Grant (1985) |
| Parus major | body mass | 3 | nestling, recaptured fledgling, adult | parent–offspring regression | van Noordwijk et al. (1988) |
| Parus major | body mass | 15 | 1–15 days | full-sib ANOVA on cross-fostering design | Gebhardt-Henrich & van Noordwijk (1994) |
| Ficedula hypoleuca | tarsus length | 2 | fledgling, adult | parent–offspring regression | Potti & Merino (1994) |
| Sturnus vulgaris | body mass | 4 | 1, 4, 7, 14 days | full-sib ANOVA on cross-fostering design | Smith & Wettermark (1995) |
| Parus caeruleus | body size | 5 | 2, 5, 8, 11, 14 days | parent–offspring regression | Bjorklund (1997) |
| Ovis canadensis | body mass | 6 | Lamb, yearling, 2, 3, 4, 5–11 years | REML animal model | Réale et al. (1999) |
| Carpodacus mexicanus | bill length, bill depth, bill width, wing length, tarsus length, body mass | 9 | 2, 6, 8, 10, 12, 14, 16, 33, 50 days | parent–offspring regression | Badyaev & Martin (2000) |
| Parus caeruleus | tarsus length, body mass, wing length, body condition | 7 | 4, 6, 8, 10, 12, 14, 15 days | GLMM on cross-fostering design | Kunz & Ekman (2000) |
| Thamnophis sirtalis | testosterone level in males | 3 | 195, 318, 437 days | analysis of covariance | King et al. (2004) |
If age-dependence in genetic variance for characters is present in natural populations, it has important consequences, both for understanding the sources of variation in these characters, but also for our understanding of how selection acts in the wild. For example, evolutionary theories of senescence predict that additive genetic variance will be age-dependent, either owing to accumulation of mutations acting late in life (mutation accumulation: Medawar 1952), or owing to the fixation of pleiotropic alleles with antagonistic effects that are favourable early in life and less favourable late in life (antagonistic pleiotropy: Williams 1957). Strong age-dependence in genetic variance for a character might also result from the ability of individuals to compensate, e.g. due to learning or compensatory growth, over the course of their lifespan, for alleles with deleterious effects. This would suggest a form of genotype-by-environment interaction, where the environmental component relates to individual age. Lastly, age-dependent genetic variance would have important implications for the force of natural selection on a character, given the usual decline in the force of natural selection with age (Williams 1957; Hamilton 1966; but see Baudisch 2005), depending on the ages at which genetic variance is relatively elevated or reduced. The increasing interest in understanding evolutionary dynamics of phenotypic traits in natural populations suggests that it is important to understand the influence of age on natural selection and genetic variance of individual characters.
In this paper, we analyse age-dependence in the expression of genetic variation in laying date using powerful pedigree analyses applied to a long-term dataset. We chose this trait for analysis for four reasons: (i) in many birds timing of reproduction is under strong natural selection (see e.g. Lack 1968; Price et al. 1988; Ludwigs & Becker 2002; Sheldon et al. 2003); (ii) this character is very variable both within and between populations: this high phenotypic variance facilitates analysis; (iii) timing of breeding shows marked age-dependence in its mean in many populations, including this one (figure 1; Perrins et al. 1994); and (iv) there is considerable interest in the evolutionary dynamics of this character, given evidence of marked changes in mean phenotype in response to recent climatic change (e.g. McCleery & Perrins 1998; Przybylo et al. 2000; Visser et al. 2003). We show that components of the total phenotypic variance in laying date, and its heritability are highly variable over age classes and we discuss the causes and consequences of this variation.
Figure 1.
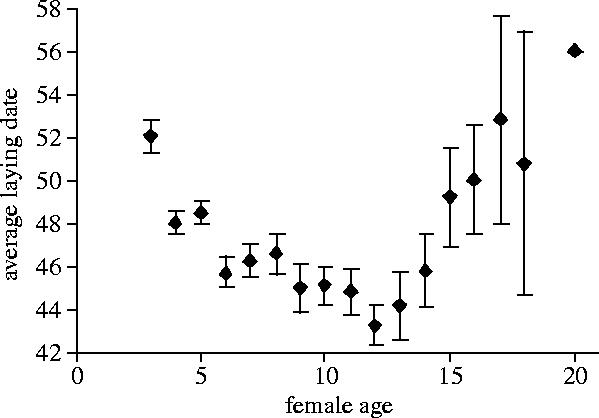
Average age-specific laying dates for female mute swans in Abbotsbury. Bars represent one standard error of the mean.
2. Material and Methods
(a) Study species and data collection
We studied a population of mute swans (Cygnus olor) breeding colonially at Abbotsbury (50°35′N, 2°30′W), on the southern coast of England, individuals of which have been individually monitored since 1976 (Perrins & Ogilvie 1981). The colony has existed at least since the 14th century, but detailed population censuses were not carried out before the 1960s. In the last 25 years, the number of breeding pairs in the colony has varied between 27 and 163. Supplementary food is provided during the breeding season, as well as occasionally during the winter. Also, up to one-third of the cygnets are placed in rearing pens, where they are protected from adult aggression. As a consequence, their survival to fledging is considerably increased compared to cygnets reared outside pens (Perrins & Ogilvie 1981). However, as there was no effect of pen rearing on subsequent laying date for all data combined, or for each age class separately (ANOVA combining all age classes, on 2135 breeding attempts: no significant effect of pen rearing, F1,2133=1.25, p=0.264; ANOVAs for each age class separately: all p>0.8), this factor was not included in our quantitative genetic analyses.
During the breeding season, nests were visited daily and the exact date of the first egg laid and hatching date, in addition to clutch size, were recorded for all broods. All cygnets were web-tagged one or two days after hatching, and ringed in early October with a unique metal BTO ring and a numbered plastic ring. Recruitment rate to the colony has averaged around 11%. Age at first breeding is variable, with 27% of females starting to breed at 3 years old, 31% at 4 years old and 42% between 5 and 8 years old. Annual survival of breeders varies from 52 to 97% and the oldest female found breeding in the colony to date was 20 years old. Only 5% of breeding females in the colony are immigrants, i.e. birds not born at Abbotsbury.
We considered a total of 1992 breeding attempts recorded between 1979 and 2003 for which the female was related to at least one other bird in the pedigree, and for which a precise laying date had been recorded. In 70% of these attempts, the female's mother was known, which allowed us to study the effect of maternal effects on reproductive traits. The pedigree of breeding individuals used in the quantitative genetics analyses included a total of 862 individuals, with 210 fathers and 190 mothers. The longest family branch included six successive generations.
(b) Quantitative genetic analysis of laying date
An ‘animal model’ was fitted to the pedigree of breeding swans (Lynch & Walsh 1998; Kruuk 2004); it is a form of mixed model with fixed and random effects which partitions individual phenotypic values for a quantitative character into different variance components (Knott et al. 1995; Lynch & Walsh 1998; Kruuk 2004). The software ASReml Release 1.0 (Gilmour et al. 2002) runs the animal model by using all the pedigree information combined with the phenotypic records to estimate the variance components with a restricted estimate maximum likelihood procedure (REML).
Standard linear models showed that year of breeding, year of birth (McCleery et al. 2002) and age of the female, all three factors fitted as categorical variables (each year or each age as a distinct class), had highly significant effects on laying date (year of breeding: F23,1921=19.53, p<0.0001; year of birth: F28,1921=2.25, p=0.0002; age: F17,1921=5.69, p<0.0001). These three factors were, therefore, fitted as fixed effects in the following animal model. Hence, the analysis concerns the breeding date of an individual, relative to the means for the year of observation, the year of birth, and the average age-specific breeding date. The dataset included 417 females, many of which bred several times. This allowed us to account for, and estimate, the variance due to persistent differences between individuals not attributable to the additive genetic variance (permanent environment effect). Maternal identity was also fitted as an additional random effect, to estimate the maternal environmental effect. Maternal genetic effects, i.e. the influence of the mother's genotype on maternal effects, were first fitted in the model but never proved to be significantly different from zero. The total phenotypic variance (VP) was hence partitioned as: , with VA, additive genetic variance; VM, maternal effect variance; VPE, permanent environment effect variance and VR, residual variance. Standard errors for all variance components and for their ratio over VP were computed by ASReml. Variance components were constrained to positive values, resulting in a narrow sense heritability (h2=VA/VP) varying between 0 and 1. Hence, in some cases where the best fitted model would have returned a negative variance component, this component was set to zero without any associated standard error.
The breeding data were then separated into 12 age classes of breeding females, in order to estimate age-specific heritabilities. The age classes consisted of ages three to 11, separately for each year, with females aged 12–13 years, 14–15 years and 16–20 years grouped in order to ensure reasonable sample sizes in these groups. The number of observations in an age-class varied from 39 (16–20 year olds) to 288 (5 year olds; figure 2a). For the last three age classes where different ages were pooled, phenotypic variance was partitioned using a similar animal model as previously described, run on the full pedigree. For all other age classes, only year of breeding was fitted as fixed factor, and . Variance components and their associated standard errors were compared between age classes using two-tailed t-tests. For comparisons between age classes, we also estimated the coefficient of additive genetic variance CVA (Houle 1992) in which the additive genetic variance is scaled by the trait mean : . This scaling controls for the variation in average laying date across age (figure 1).
Figure 2.

Quantitative genetic parameters (and standard errors) for laying date in female mute swans across 12 age classes: (a) number of observations; (b) total phenotypic variance was partitioned using an animal model into (c) residual variance, (d) additive genetic variance, and (e) maternal effect variance; (f) heritability and (g) coefficient of additive genetic variance.
(c) Age-specific selection for laying date
We used standard selection analyses (Arnold & Wade 1984) to correlate laying date with the number of hatchlings and the number of recruited offspring following each breeding attempt. For number of hatchlings, we used 2135 breeding attempts recorded between 1979 and 2003. When using the number of recruited offspring as a measure of fitness, we restricted the data to the breeding attempts recorded between 1979 and 1999, allowing for the majority of the offspring of a female to recruit in the population. The sample size for the latter analysis was reduced to 1576 records, with relatively few observations from the very old age classes as these were inevitably mainly recorded in the latest years of the study. Laying date was standardized within each age class, and fitness was converted to relative fitness, following standard procedures for selection analyses. There was no evidence for nonlinear selection on laying date, hence only linear selection differentials are reported.
3. Results and discussion
The first surprising result from this study is that a mixed model analysis of variance (animal model; Knott et al. 1995; Kruuk 2004) using all the long-term data combined showed no significant additive genetic variance in laying date in this mute swan population (table 2). This is not congruent with many other studies of heritability of laying date in birds (e.g. van Noordwijk et al. 1981; Merilä & Sheldon 2001; Sheldon et al. 2003). Strong selection in the past may have depleted additive genetic variance (Falconer & Mackay 1996), although laboratory studies show that VA can be maintained despite intense selection for many generations (review in Pomiankowski & Møller 1995). In the case of no VA, laying date in this population would not be expected to evolve, even under strong directional selection. On the other hand, total phenotypic variance in laying date was explained to a large degree by the repeated environmental conditions experienced by each female (the permanent environment explained 29.3% of the variance); there was no evidence for a significant maternal effect on laying date, although the estimated maternal effect accounted for 4.8% of the total phenotypic variance. The strong permanent environment effect illustrates the importance of between-individual differences that persist between years, such as non-additive genetic effects, or territory or mate quality.
Table 2.
Components of phenotypic variance for mute swan laying date: all ages combined. (Year of breeding, year of birth and age of females were fitted as categorical fixed effects in the animal model. ***p<0.001.)
| source | variance component±s.e. | proportion of total±s.e. |
|---|---|---|
| VR | 71.02±2.90*** | 0.656±0.032*** |
| VA | 0.25±5.79 | 0.002±0.054 |
| VM | 5.19±4.71 | 0.048±0.043 |
| VPE | 31.74±5.98*** | 0.293±0.050*** |
In contrast to this absence of heritability in laying date when all female ages were combined, estimation of age-specific heritabilities using a similar animal model approach revealed an interesting pattern in VA and heritability (figure 2d,f). Heritability of laying date is weak for very young breeders, nil for birds of intermediate age, and high for very old breeders (see electronic supplementary material, section 1 for pairwise statistical comparisons between age classes). The estimated heritability showed a significant quadratic relationship with age (using midpoints of age classes, weighted regression with age, age2 and their interaction as explanatory variables: F3,8=4.32, p=0.043; quadratic term: t1,8=2.83, p=0.022). This pattern, which is similar in the CVA after controlling for age-specific means (figure 2g), is strikingly similar to variation in heritability of female fecundity (Tatar et al. 1996) and male fertility (Snoke & Promislow 2003) over the lifespan in D. melanogaster. We are unaware of any similar investigation from wild populations. Below, we discuss the potential origin, and consequences, of these age-dependent effects.
What causes age-dependence in heritability? Decreasing heritability after the first reproductive year is perhaps most likely to be explained by the increasing importance of environmental effects and experience gained by the females, diminishing the relative importance of the genotype on the laying date. This is illustrated by the pattern of VR, steadily increasing between age 3 and 9 (figure 2c). Many studies of wild populations suggest that age-specific breeding performance improves with age (see e.g. reviews in Saether 1990; Forslund & Pärt 1995; Martin 1995), and it would also seem reasonable to expect environmental variance to accumulate more over the life-history of individuals (Price & Schluter 1991). However, the increase in heritability of laying date in later years, mainly after 12 years old, is unexpected. We discuss six potential explanations for this increase below: (i) biased estimation; (ii) age-dependent maternal effects; (iii) age-specific infidelity; (iv) selection; (v) environmental change; and (vi) accumulation of alleles with late-acting effects as a consequence of evolution of optimal ageing. One should note, however, that only the first and the last two hypotheses can explain changes in the additive genetic variance, the three others implying changes in other variance components.
Although, the use of an animal model allows us to control for different fixed and random effects acting on the total phenotypic variance in laying date, methodological artefacts biasing the estimation of VA and heritability are still possible. In particular, in the late age classes with small sample sizes (figure 2a), estimates of VA could rely mostly on sib comparisons, and hence be confounded by dominance variance, more so than earlier age classes comprising many cohorts. In fact, a close look at the age-specific datasets reveals that while the very old age classes include fewer cohorts than earlier ages, the structure of the relationships between individuals is still more complex than only sib-ships. For example, the 16–20 age class comprises females born from nine different cohorts, between 1977 and 1987. In the two other age classes where significant heritability was found (12–13 and 14–15), data were collected from 13 and 16 different cohorts, respectively. Hence, we believe that higher dominance effects confounded with VA are unlikely to explain the observed patterns.
An important factor which can influence patterns of heritability is an age-specific influence of maternal effects (Priest et al. 2002). Maternal effects occur when the phenotype of the mother affects the phenotype of her offspring (Falconer & Mackay 1996). Maternal care and investment in offspring growth and development, can play a major role early in life (Mousseau & Fox 1998), whereas later on, offspring phenotype is determined mainly by the genotype and/or the environment (e.g. Cheverud 1984; Price & Grant 1985; Heath et al. 1999). Figure 2e shows this appears to be the case for maternal effects acting on offspring laying date, although the estimated maternal effects for individual age classes are non-significant. Declining maternal effects are sometimes associated with increasing heritability with age (e.g. in mice: Cheverud 1984), yet this is clearly not the case here, either for early or late life heritability.
Some cases of decreasing heritability with respect to maternal age have been hypothesized to result from higher infidelity of old females (Qvarnstrom 1999). For example, if certain age-classes of females are more involved in extra-pair mating, the resemblance between perceived parents and offspring will decrease in these classes because of misrecording of the paternal links. The rate of extra-pair paternity (EPP) has not been estimated in this mute swan population. However, a simulation study has shown that rates of EPP typical for birds, and specifically for species closely related to the mute swan (15% of extra-pair cygnets in the black swan Cygnus atratus; Kraaijeveld et al. 2004), are not sufficient to trigger biases in heritability estimates high enough to generate null heritabilities over ages 5–11 (Charmantier & Réale 2005). For EPP to explain the observed pattern of heritability over age, there would need to be changes in EPP rates over age, with exceptionally high rates for females of intermediate age, and no EPP for very old females. We consider this highly unlikely, although only an extensive molecular genotyping study could fully reject this explanation.
Age-specific changes in heritability might result as a consequence of selection, if selection differentially targets components of the phenotypic variance of a trait. This could occur if, for example, the correlation between a focal trait and fitness results from mutual correlation with a third, environmentally determined variable that is under selection (Fisher 1930; Price et al. 1988; Merilä et al. 2001). In this case where selection acts on environmental deviations, the reduction of environmental variance for a trait would lead to increased heritability. However, this seems unlikely to be relevant in the present case, as viability selection on laying date would have to be extremely strong to generate the change in heritability observed with age, and there is little evidence of viability selection on this trait in this population (unpublished data).
Temporal changes in environmental conditions could potentially explain changes in heritability, since heritabilities are known to vary across environments (Hoffmann & Merilä 1999; Charmantier & Garant 2005). These temporal changes would be especially important if they concerned cohorts which contribute extensively to certain age classes (Tatar et al. 1996). In the present study, the majority of the data collected on very old females were recorded at the end of the study period, whereas earlier age classes combine data more evenly spread. In a recent meta-analysis of studies conducted in the wild, heritability of morphological traits increased in favourable conditions, with a similar (though non-significant) trend for life-history traits (Charmantier & Garant 2005). Although, the environmental factors controlled by staff managing this population, such as the amount of supplemented feeding, have not changed between 1979 and 2003, we cannot rule out the influence of changes in other conditions such as the climate. However, the influence of such effects on heritability would have to be very marked to explain the age-specific patterns documented here. Although each of the first five factors were considered unlikely to explain the patterns in age-specific heritabilities on their own, we cannot rule out the possibility that they would act simultaneously, hence inducing potentially important changes in heritability across age.
Lastly, increasing heritability in late life could arise as a consequence of senescence: the decline in fitness later in life, manifested through reduced survival and reproductive performance (Rose 1991). Two theories explain the evolution of senescence: mutation accumulation (MA) and antagonistic pleiotropy (AP); both rely on the decline in the force of selection with adult age (Charlesworth 1994). In the MA theory, this decline favours the accumulation of alleles with late-acting deleterious effects (Medawar 1952), and predicts increasing VA, dominance variance (VD) and inbreeding depression effects with age (Charlesworth 1990; Charlesworth & Hughes 1996). The AP theory predicts the accumulation of alleles with beneficial early effects and detrimental late effects (Williams 1957), leading to age-specific increases in VA and negative genetic covariance between early and late life-history traits (Rose 1991). Tests of these two hypotheses have mainly focused on the study of age-specific mortality rates, either in controlled laboratory environments (e.g. Snoke & Promislow 2003), or more rarely in natural populations (e.g. Bryant & Reznick 2004). Investigations in nature remain scarce because of the difficulty of controlling for extrinsic sources of mortality (Partridge & Barton 1996; Kirkwood & Austad 2000; but see e.g. Hendry et al. 2004). In this swan population, senescence is illustrated by an age-related increase in laying date (i.e. the birds breed later) after 12 years of age (figure 1). The evidence presented here, of an increase in VA (figure 2d) later in life, is consistent with the predictions of both MA and AP. We have also tested the prediction from the AP theory that negative genetic correlations occur between early and late life-history traits; laying date at 4 years of age is significantly negatively genetically correlated with laying date at ages 16–20 (p=0.039), but all the other genetic correlations between early and late laying date were not significantly different from zero. In any case, sample sizes for the older ages are limited, and the power of this analysis will be low. On balance, the evidence suggests that the age-specific pattern of genetic variance documented for this population may reflect the outcome of selection for an optimal life-history in the face of mortality. Further analyses of long-term datasets with reasonable numbers of very old individuals may shed light on how general these patterns are.
How do age-dependent heritabilities affect evolutionary potential? As we previously pointed out, estimates of age-specific heritabilities in the wild are rare because very few individuals survive to old ages (Kirkwood & Austad 2000). As a consequence, studies of the evolutionary dynamics of characters in the wild commonly use a single estimate of heritability over all age classes. Our results indicate that this approach may well be flawed. Predictions can be further complicated by age-specific variation in selection acting on the focal trait (Baudisch 2005). In this population, laying date is under strong negative directional selection, with no consistent differences in selection apparent at different age classes (electronic supplementary material, section 2). Hence, the significant heritability in laying date of old females suggests that some microevolution of the trait is possible. However, the evolutionary response will be limited by the inevitable demographic fact that very few individuals survive to the age at which genetic variation for breeding time is apparent. Hence, the magnitude of a response to selection for advanced laying date will remain small even after considering the differences in heritability across ages. More generally, for traits with age-specific variation, such as those that show senescence, a classic quantitative genetics approach becomes insufficient, since it does not reflect the complexity of age-dependent effects. Indeed, a combination of changing selection and changing VA over different age classes can trigger complex evolutionary responses which may be overlooked or misunderstood when all ages are pooled (see e.g. Kirkpatrick et al. 1990). Hence, the possibility of age-dependence in the expression of genetic variation needs to be accounted for in future studies of quantitative genetics, using appropriate models dealing with function-valued characters (Kirkpatrick & Heckman 1989; Meyer & Hill 1997; Pletcher & Geyer 1999).
In conclusion, our study shows that the sources of phenotypic variance for traits under strong natural selection can vary according to age, and in this case, we have argued that these effects are most likely to be caused by an adaptive life-history evolution. These are encouraging results for the understanding of ageing in wild populations, because previously, studies of the expression of genetic variance, and consequently tests of some of the predictions of evolutionary models of senescence have largely focused on life-history characters in Drosophila in controlled conditions. In this regard, existing long-term pedigrees of wild animals such as birds are a potentially very valuable source of knowledge (Holmes & Ottinger 2003; Holmes et al. 2003). Our results also stress the importance of estimating age-specific components of genetic variation and age-specific selection for any study of microevolution on a function-valued trait.
Acknowledgments
We are extremely grateful to Mrs Charlotte Townshend for permission to study the swans. We thank D. Garant, P. Jarne, D. Promislow and two referees for discussion and comments, and all the people who participated in the long-term monitoring of the swans, especially Dave Wheeler. AC was funded by a Marie-Curie Intra-European Fellowship, and BCS by a Royal Society University Research Fellowship.
Supplementary Material
References
- Albuquerque L.G, Meyer K. Estimates of covariance functions for growth from birth to 630 days of age in Nelore cattle. J. Anim. Sci. 2001a;79:2776–2789. doi: 10.2527/2001.79112776x. [DOI] [PubMed] [Google Scholar]
- Albuquerque L.G, Meyer K. Estimates of direct and maternal genetic effects for weights from birth to 600 days of age in Nelore cattle. J. Anim. Breed. Genet. 2001b;118:83–92. 10.1046/j.1439-0388.2001.00279.x [Google Scholar]
- Arnold S.J, Wade M.J. On the measurement of natural and sexual selection: theory. Evolution. 1984;38:709–719. doi: 10.1111/j.1558-5646.1984.tb00344.x. [DOI] [PubMed] [Google Scholar]
- Atchley W.R. Ontogeny, timing of development, and genetic variance–covariance structure. Am. Nat. 1984;123:519–540. 10.1086/284220 [Google Scholar]
- Badyaev A.V, Martin T.E. Individual variation in growth trajectories: phenotypic and genetic correlations in ontogeny of the house finch (Carpodacus mexicanus) J. Evol. Biol. 2000;13:290–301. 10.1046/j.1420-9101.2000.00172.x [Google Scholar]
- Baudisch A. Hamilton's indicators of the force of selection. Proc. Natl Acad. Sci. USA. 2005;102:8263–8268. doi: 10.1073/pnas.0502155102. 10.1073/pnas.0502155102 [DOI] [PMC free article] [PubMed] [Google Scholar]
- Bjorklund M. Variation in growth in the blue tit (Parus caeruleus) J. Evol. Biol. 1997;10:139–155. 10.1007/s000360050015 [Google Scholar]
- Björklund M. Constancy of the G matrix in ecological time. Evolution. 2004;58:1157–1164. doi: 10.1111/j.0014-3820.2004.tb01696.x. [DOI] [PubMed] [Google Scholar]
- Bryant M.J, Reznick D. Comparative studies of senescence in natural populations of guppies. Am. Nat. 2004;163:55–68. doi: 10.1086/380650. 10.1086/380650 [DOI] [PubMed] [Google Scholar]
- Cameron N.D. CAB International; Wallingford, UK: 1997. Selection Indices and prediction of genetic Merit in Animal Breeding. [Google Scholar]
- Charlesworth B. Optimization models, quantitative genetics, and mutation. Evolution. 1990;44:520–538. doi: 10.1111/j.1558-5646.1990.tb05936.x. [DOI] [PubMed] [Google Scholar]
- Charlesworth B. 2nd edn. Cambridge University Press; Cambridge, UK: 1994. Evolution in age-structured populations. [Google Scholar]
- Charlesworth B, Hughes K.A. Age-specific inbreeding depression and components of genetic variance in relation to the evolution of senescence. Proc. Natl Acad. Sci. USA. 1996;93:6140–6145. doi: 10.1073/pnas.93.12.6140. 10.1073/pnas.93.12.6140 [DOI] [PMC free article] [PubMed] [Google Scholar]
- Charmantier A, Garant D. Environmental quality and evolutionary potential: lessons from wild populations. Proc. R. Soc. B. 2005;272:1415–1425. doi: 10.1098/rspb.2005.3117. 10.1098/rspb.2005.3117 [DOI] [PMC free article] [PubMed] [Google Scholar]
- Charmantier A, Réale D. How do misassigned paternities affect the estimation of heritability in the wild? Mol. Ecol. 2005;14:2839–2850. doi: 10.1111/j.1365-294X.2005.02619.x. 10.1111/j.1365-294X.2005.02619.x [DOI] [PubMed] [Google Scholar]
- Cheverud J.M. Evolution by kin selection—a quantitative genetic model illustrated by maternal performance in mice. Evolution. 1984;38:766–777. doi: 10.1111/j.1558-5646.1984.tb00349.x. [DOI] [PubMed] [Google Scholar]
- Cheverud J.M, Rutledge J.J, Atchley W.R. Quantitative genetics of development–genetic correlations among age-specific trait values and the evolution of ontogeny. Evolution. 1983;37:895–905. doi: 10.1111/j.1558-5646.1983.tb05619.x. [DOI] [PubMed] [Google Scholar]
- Falconer D.S, Mackay T.F.C. Longman; Essex, UK: 1996. Introduction to quantitative genetics. [Google Scholar]
- Fisher R.A. 4th edn. Oxford University Press; Oxford, UK: 1930. The genetical theory of natural selection. [Google Scholar]
- Forslund P, Pärt T. Age and reproduction in birds—hypotheses and tests. Trends Ecol. Evol. 1995;10:374–378. doi: 10.1016/s0169-5347(00)89141-7. 10.1016/S0169-5347(00)89141-7 [DOI] [PubMed] [Google Scholar]
- Geber M.A, Griffen L.R. Inheritance and natural selection on functional traits. Int. J. Plant Sci. 2003;164:S21–S42. 10.1086/368233 [Google Scholar]
- Gebhardt-Henrich S.G, van Noordwijk A.J. The genetical ecology of nestling growth in the Great Tit. Environmental influences on the expression of genetic variances during growth. Funct. Ecol. 1994;8:469–476. [Google Scholar]
- Gilmour A.R, Gogel B.J, Cullis B.R, Welham S.J, Thompson R. Hemel Hempstead. VSN International Ltd; UK: 2002. ASReml user guide release 1.0. [Google Scholar]
- Grant P.R, Grant R.B. Predicting microevolutionary responses to directional selection on heritable variation. Evolution. 1995;49:241–251. doi: 10.1111/j.1558-5646.1995.tb02236.x. [DOI] [PubMed] [Google Scholar]
- Hamilton W.D. The moulding of senescence by natural selection. J. Theor. Biol. 1966;12:12–45. doi: 10.1016/0022-5193(66)90184-6. 10.1016/0022-5193(66)90184-6 [DOI] [PubMed] [Google Scholar]
- Heath D.D, Fox C.W, Heath J.W. Maternal effects on offspring size: variation through early development of Chinook salmon. Evolution. 1999;53:1605–1611. doi: 10.1111/j.1558-5646.1999.tb05424.x. [DOI] [PubMed] [Google Scholar]
- Hendry A.P, Morbey Y.E, Berg O.K, Wenburg J.K. Adaptive variation in senescence: reproductive lifespan in a wild salmon population. Proc. R. Soc. B. 2004;271:259–266. doi: 10.1098/rspb.2003.2600. 10.1098/rspb.2003.2600 [DOI] [PMC free article] [PubMed] [Google Scholar]
- Hoffmann A.A, Merilä J. Heritable variation and evolution under favourable and unfavourable conditions. Trends Ecol. Evol. 1999;14:96–101. doi: 10.1016/s0169-5347(99)01595-5. 10.1016/S0169-5347(99)01595-5 [DOI] [PubMed] [Google Scholar]
- Holmes D.J, Ottinger M.A. Birds as long-lived animal models for the study of aging. Exp. Gerontol. 2003;38:1365–1375. doi: 10.1016/j.exger.2003.10.018. 10.1016/j.exger.2003.10.018 [DOI] [PubMed] [Google Scholar]
- Holmes D.J, Thomson S.L, Wu J, Ottinger M.A. Reproductive aging in female birds. Exp. Gerontol. 2003;38:751–756. doi: 10.1016/s0531-5565(03)00103-7. 10.1016/S0531-5565(03)00103-7 [DOI] [PubMed] [Google Scholar]
- Houle D. Comparing evolvability and variability of quantitative traits. Genetics. 1992;130:195–204. doi: 10.1093/genetics/130.1.195. [DOI] [PMC free article] [PubMed] [Google Scholar]
- Hughes K.A, Alipaz J.A, Drnevich J.M, Reynolds R.M. A test of evolutionary theories of aging. Proc. Natl Acad. Sci. USA. 2002;99:14 286–14 291. doi: 10.1073/pnas.222326199. 10.1073/pnas.222326199 [DOI] [PMC free article] [PubMed] [Google Scholar]
- King R.B, Cline J.H, Hubbard C.J. Heritable variation in testosterone levels in male garter snakes (Thamnophis sirtalis) J. Zool. 2004;264:143–147. 10.1017/S0952836904005655 [Google Scholar]
- Kirkpatrick M, Heckman N. A quantitative genetic model for growth, shape, reaction norms, and other infinite-dimensional characters. J. Math. Biol. 1989;27:429–450. doi: 10.1007/BF00290638. 10.1007/BF00290638 [DOI] [PubMed] [Google Scholar]
- Kirkpatrick M, Lofsvold D, Bulmer M. Analysis of the inheritance, selection and evolution of growth trajectories. Genetics. 1990;124:979–993. doi: 10.1093/genetics/124.4.979. [DOI] [PMC free article] [PubMed] [Google Scholar]
- Kirkwood T.B.L, Austad S.N. Why do we age? Nature. 2000;408:233–238. doi: 10.1038/35041682. 10.1038/35041682 [DOI] [PubMed] [Google Scholar]
- Knott S.A, Sibly R.M, Smith R.H, Møller H. Maximum likelihood estimation of genetic parameters in life-history studies using the ‘Animal Model’. Funct. Ecol. 1995;9:122–126. [Google Scholar]
- Kraaijeveld K, Carew P.J, Billing T, Adcock G.J, Mulder R.A. Extra-pair paternity does not result in differential sexual selection in the mutually ornamented black swan (Cygnus atratus) Mol. Ecol. 2004;13:1625–1633. doi: 10.1111/j.1365-294X.2004.02172.x. 10.1111/j.1365-294X.2004.02172.x [DOI] [PubMed] [Google Scholar]
- Kruuk L.E.B. Estimating genetic parameters in wild populations using the ‘animal model’. Phil. Trans. R. Soc. B. 2004;359:873–890. doi: 10.1098/rstb.2003.1437. 10.1098/rstb.2003.1437 [DOI] [PMC free article] [PubMed] [Google Scholar]
- Kunz C, Ekman J. Genetic and environmental components of growth in nestling blue tits (Parus caeruleus) J. Evol. Biol. 2000;13:199–212. 10.1046/j.1420-9101.2000.00158.x [Google Scholar]
- Lack D. Methuen; London: 1968. Ecological adaptations for breeding in birds. [Google Scholar]
- Ludwigs J.D, Becker P.H. The hurdle of recruitment: Influences of arrival date, colony experience and sex in the Common Tern Sterna hirundo. Ardea. 2002;90:389–399. [Google Scholar]
- Lynch M, Walsh B. Sinauer Associates, Inc; Sunderland, MA: 1998. Genetics and analysis of quantitative traits. [Google Scholar]
- Martin K. Patterns and mechanisms for age-dependent reproduction and survival in birds. Am. Zool. 1995;35:340–348. [Google Scholar]
- McCleery R.H, Perrins C.M. …temperature and egg-laying trends. Nature. 1998;391:30–31. 10.1038/34073 [Google Scholar]
- McCleery R.H, Perrins C, Wheeler D, Groves S. Population structure, survival rates and productivity of mute swans breeding in a colony at Abbotsbury, Dorset, England. Waterbirds. 2002;25:192–201. [Google Scholar]
- Medawar P.B. H.K. Lewis & Co; London: 1952. An unsolved problem of biology. [Google Scholar]
- Merilä J, Sheldon B.C. Avian quantitative genetics. Curr. Ornithol. 2001;16:179–255. [Google Scholar]
- Merilä J, Sheldon B.C, Kruuk L.E.B. Explaining stasis: microevolutionary studies in natural populations. Genetica. 2001;112–113:199–222. [PubMed] [Google Scholar]
- Meyer K, Hill W.G. Estimation of genetic and phenotypic covariance functions for longitudinal or ‘repeated’ records by restricted maximum likelihood. Livest. Prod. Sci. 1997;47:185–200. 10.1016/S0301-6226(96)01414-5 [Google Scholar]
- Mousseau T.A, Fox C.W. Trends in Ecology and Evolution. Oxford University Press; New York: 1998. Maternal effects as adaptation. [DOI] [PubMed] [Google Scholar]
- Partridge L, Barton N.H. On measuring the rate of ageing. Proc. R. Soc. B. 1996;263:1365–1371. [Google Scholar]
- Perrins C.M, Ogilvie M.A. A study of the Abbotsbury mute swans. Wildfowl. 1981;32:35–45. [Google Scholar]
- Perrins C.M, McCleery R.H, Ogilvie M.A. A study of the breeding mute swans Cygnus olor at Abbotsbury. Wildfowl. 1994;45:1–14. [Google Scholar]
- Pletcher S.D, Geyer C.J. The genetic analysis of age-dependent traits: modeling the character process. Genetics. 1999;153:825–835. doi: 10.1093/genetics/153.2.825. [DOI] [PMC free article] [PubMed] [Google Scholar]
- Pomiankowski A, Møller A.P. A resolution of the lek paradox. Proc. R. Soc. B. 1995;260:21–29. [Google Scholar]
- Potti J, Merino S. Heritability estimates and maternal effects on tarsus length in pied flycatchers, Ficedula hypoleuca. Oecologia. 1994;100:331–338. doi: 10.1007/BF00316962. 10.1007/BF00316962 [DOI] [PubMed] [Google Scholar]
- Price T.D, Grant P.R. The evolution of ontogeny in Darwin finches—a quantitative genetic approach. Am. Nat. 1985;125:169–188. 10.1086/284336 [Google Scholar]
- Price T, Schluter D. On the low heritability of life-history traits. Evolution. 1991;45:853–861. doi: 10.1111/j.1558-5646.1991.tb04354.x. [DOI] [PubMed] [Google Scholar]
- Price T.D, Kirkpatrick M, Arnold S.J. Directional selection and the evolution of breeding date in birds. Science. 1988;240:798–799. doi: 10.1126/science.3363360. [DOI] [PubMed] [Google Scholar]
- Priest N.K, Mackowiak B, Promislow D.E.L. The role of parental age effects on the evolution of aging. Evolution. 2002;56:927–935. doi: 10.1111/j.0014-3820.2002.tb01405.x. [DOI] [PubMed] [Google Scholar]
- Przybylo R, Sheldon B.C, Merilä J. Climatic effects on breeding and morphology: evidence for phenotypic plasticity. J. Anim. Ecol. 2000;69:395–403. 10.1046/j.1365-2656.2000.00401.x [Google Scholar]
- Qvarnstrom A. Genotype-by-environment interactions in the determination of the size of a secondary sexual character in the collared flycatcher (Ficedula albicollis) Evolution. 1999;53:1564–1572. doi: 10.1111/j.1558-5646.1999.tb05419.x. [DOI] [PubMed] [Google Scholar]
- Réale D, Festa-Bianchet M, Jorgenson J.T. Heritability of body mass varies with age and season in wild bighorn sheep. Heredity. 1999;83:526–532. doi: 10.1038/sj.hdy.6885430. 10.1038/sj.hdy.6885430 [DOI] [PubMed] [Google Scholar]
- Roff D.A, Mousseau T.A. Does natural selection alter genetic architecture? An evaluation of quantitative genetic variation among populations of Allonemobius socius and A. fasciatus. J. Evol. Biol. 1999;12:361–369. 10.1046/j.1420-9101.1999.00036.x [Google Scholar]
- Rose M.R. Oxford University Press; New York: 1991. Evolutionary biology of aging. [Google Scholar]
- Saether B.E. Age-specific variation in reproductive performance of birds. Curr. Ornithol. 1990;7:251–283. [Google Scholar]
- Sheldon B.C, Kruuk L.E.B, Merilä J. Natural selection and inheritance of breeding time and clutch size in the collared flycatcher. Evolution. 2003;57:406–420. doi: 10.1111/j.0014-3820.2003.tb00274.x. [DOI] [PubMed] [Google Scholar]
- Smith H.G, Wettermark K.-J. Heritability of nestling growth in cross-fostered European starlings Sturnus vulgaris. Genetics. 1995;141:657–665. doi: 10.1093/genetics/141.2.657. [DOI] [PMC free article] [PubMed] [Google Scholar]
- Snoke M.S, Promislow D.E.L. Quantitative genetic tests of recent senescence theory: age-specific mortality and male fertility in Drosophila melanogaster. Heredity. 2003;91:546–556. doi: 10.1038/sj.hdy.6800353. 10.1038/sj.hdy.6800353 [DOI] [PubMed] [Google Scholar]
- Snyman M.A, Erasmus G.J, vanWyk J.B, Olivier J.J. Direct and maternal (co)variance components and heritability estimates for body weight at different ages and fleece traits in Afrino sheep. Livest. Prod. Sci. 1995;44:229–235. 10.1016/0301-6226(95)00071-2 [Google Scholar]
- Steppan S.J, Phillips P.C, Houle D. Comparative quantitative genetics: evolution of the G matrix. Trends Ecol. Evol. 2002;17:320–327. 10.1016/S0169-5347(02)02505-3 [Google Scholar]
- Tatar M, Promislow D.E.I, Khazaeli A.A, Curtsinger J.W. Age-specific patterns of genetic variance in Drosophila melanogaster. 2. Fecundity and its genetic covariance with age-specific mortality. Genetics. 1996;143:849–858. doi: 10.1093/genetics/143.2.849. [DOI] [PMC free article] [PubMed] [Google Scholar]
- van Noordwijk A.J, van Balen J.H, Scharloo W. Genetic variation in the timing of reproduction in the Great Tit. Oecologia. 1981;49:158–166. doi: 10.1007/BF00349183. 10.1007/BF00349183 [DOI] [PubMed] [Google Scholar]
- van Noordwijk A.J, van Balen J.H, Scharloo W. Heritability of body size in a natural population of the Great Tit (Parus major) and its relation to age and environmental conditions during growth. Genet. Res. 1988;51:149–162. [Google Scholar]
- Visser M.E, et al. Variable responses to large-scale climate change in European Parus populations. Proc. R. Soc. B. 2003;270:367–372. doi: 10.1098/rspb.2002.2244. 10.1098/rspb.2002.2244 [DOI] [PMC free article] [PubMed] [Google Scholar]
- Williams C.G. Pleiotropy, natural selection, and the evolution of senescence. Evolution. 1957;11:398–411. [Google Scholar]
Associated Data
This section collects any data citations, data availability statements, or supplementary materials included in this article.