Abstract
Measured at 2 °C in water, NMR chemical shifts of 13C═O labeled central alanine residues of peptides W-Lys5-tL3-Alan-tL3-Lys5NH2, n = 9, 11, 13, 15, 19 and W-Lys5-tL3-a-Alan-A-Inp-tL2-Lys5NH2 (a = d-Ala; tL = tert-leucine; Inp = 4-carboxypiperidine) are used to assign jLt and cLt, the N- and C-terminal tL capping parameters and length-dependent values for wAla(n), the alanine helical propensity for Alan peptides. These parameters allow Lifson–Roig characterization of the stabilities of Alan helices in water. To facilitate chemical shift characterization, different 13C/12C ratios are incorporated into specific Ala sites to code up to six residue sites per peptide. Large left/right chemical shift anisotropies are intrinsic to helical polyalanines, and a correcting L–R-based model is introduced. Capping parameters jLt = cLt lie in the range of 0.3 to 0.5; the tL residues are thus moderately helix-destabilizing. For helical conformations of lengths shorter than eight residues, assigned values for wAla approach 1.0 but increase monotonically with length to a value of 1.59 for wAla(19).
Introduction
The stabilities of helical conformations of proteins1 and peptides2 depend on the structures of their N- and C-terminal caps, which provide the first and last H-bonding sites within a fully helical conformation. Reported values for parameters j (N-terminal) and c (C-terminal) that reflect helix-capping efficiency vary substantially.2 The constructs 1 allow characterization of polyalanine helicities. In these, N- and C-tL (tert-leucine) caps link a helical Alan core to spaced, solubilizing terminal regions.2b,3 Values for jtL and ctL are essentials for rigorous analysis of all construct helicity data. Here we report and analyze experimental 13C═O NMR chemical shifts for Alan peptides of medium length, measured in water at 2 °C, and from them we assign capping parameters and corresponding Alan helicities. Jointly, these define the formation energetics for Alan helices, which are helicity archetypes.
For short Alan peptides, we have previously assigned a low value for the alanine helical propensity wAla,3 which is consistent with early reports.4 For longer Alan peptides, we have proposed that wAla increases to values that are consistent with later reports.5 Both assignments rely on preliminary evidence6 that tL caps are moderate helix destabilizers. There is an alternative interpretation: tL caps strongly destabilize Alan helices, and our assignments of low wAla values and their length dependence are spurious. We now resolve this issue.
Capping Parameters and Caps that Terminate Helices; the Series tL-An-tL and a-An-A; Deductions from CD Data
The standard Lifson–Roig energetic algorithm reflects the helicity-controlling role of j and c.2a A completely helical N-and C-capped tL-Alan-tL peptide conformation is assigned a weight jLtυ2wncLt, and a second conformation that contains no helical residues is assigned a weight 1.0. The corresponding helical state sum ss is (1 + jLtυ2wncLt), and the fraction FH of helical α-carbons within the Alan region is jLtυ2wncLt/ss.7 Here, υ is the classical L–R initiation parameter,8 usually assigned a value of ca. 0.05,9 and w is the helical propensity, the tendency of a single residue to join a preexisting helical conformation to which it is linked.
In this all-or-none model, FH is clearly zero if any one of the length-independent parameters j, c, or w is zero. Values for jLt and cLt are defined relative to values for jAla and cAla, set by definition equal to 1.0.2a Structural factors influence j or c. The side chains of capping residues may contain charges that stabilize the helix or H-bonding sites that stabilize the terminal helical amide functions that lack a full complement of intrahelical H-bonds.2c,d,10 The caps N-acetyl and N-formyl2c are also helix stabilizers; thus, replacing an N-terminal alanine by an N-acetyl function increases the FH values of helically disposed, medium-sized heteropeptides by ca. 70%. This corresponds to a jAc of ca. 10.
In addition to their Alan cores and tL residues, which terminate helices, constructs 1 contain other essential elements. The N-and C-terminal Km sequences ensure aggregation-free core solubilization, and for pH < 10, charge-repelled residues in these regions adopt extended conformations. Lys-induced perturbations of Alan helicity are minimized by rigid Inp2 spacers.
What properties allow a tL cap to both H-bond to the Alan core and terminate its helix? As an N-cap, tL provides the N-terminal amide oxygen that H-bonds to the amide NH at site four of an α-helix, Figure 1a. As a C-cap, it provides the C-terminal NH that H-bonds to the carbonyl of the residue at site (n − 3), Figure 1b. Formation of these H-bonds places little or no restriction on backbone φ and ψ angles of either tL. These can form second intrahelical H-bonds, join the helical structure, and extend the helix if their helical φ, ψ space is energetically accessible. A helix-terminating residue must be a strong helix breaker, and tL was selected3 since its w value is small.11 In work reported below, a conjectural helix-inhibiting synergy between linked tL Inp2 and tL is probed and values are assigned to jLt and cLt.
Figure 1.
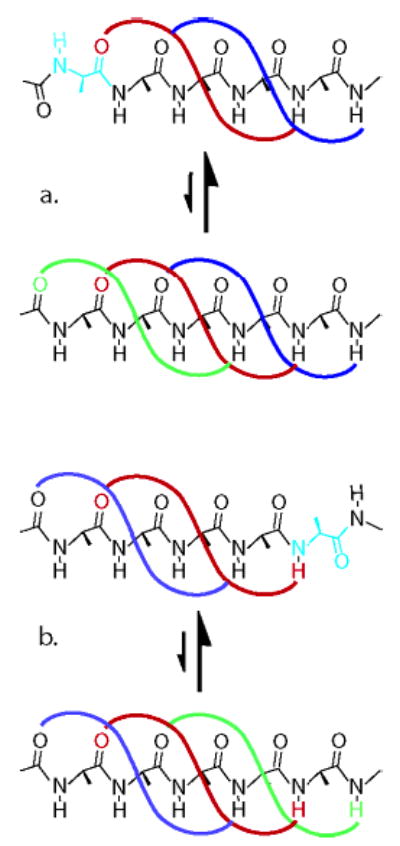
Conformational features of residues that cap and terminate or cap and extend peptide helices. In the terminating conformation, only the red H-bond forms; in the extending conformation both red and green H-bonds must form, implying presence of comparable amounts of the upper and lower conformations of both a and b. Any helix-terminating residue must strongly favor nonhelical conformations, shown in cyan. A C-terminal cap must be helix-terminating if it is linked to a following peptide sequence through a tertiary amide, which lacks the NH required to form the green H-bond of b.
The N-cap d-alanine ≡ “a” and the C-cap A-Inp, both helix-terminating, are needed as capping standards. For these, ja and cA−Inp should closely approximate 1.0. Like tL, “a” is a strong helix breaker,12 but its φ, ψ rotamers can provide polar, hydrophobic, and steric environments such as those of an l-alanine, and as an H-bond acceptor, its C-terminal carbonyl oxygen is a near-equivalent. A C-cap that is linked to its successive residue through a tertiary amide bond lacks the second NH H-bonding donor that is the prerequisite for helix extension; thus the A-Inp pair must act as a helix terminator and a normal donor for the first H-bond. The accessible Ramachandran space for the Ala of A-Inp should closely match that reported for the Ala of Ala-Pro.13 Both can access sheets and extended conformations, which have positive values of ψ, but owing to steric crowding, the negative ψ values of the helical region correspond to destabilized, inaccessible conformations. In the discussions that follow, the constructs derived from the two generic sequences of 1 are abbreviated as tL-Alan-tL and a-Alan-A.
The CD ellipticities of peptides in the short UV wavelength region are largely defined by the conformations of their backbone amide sequences, and at 222 nm the CD ellipticity [θ]222 primarily reflects the presence of helical structure. We have previously shown that to a good approximation, CD spectra of tL-Alan-tL constructs can be analyzed as sums of independent contributions of caps and cores, and [θ]222 data are particularly useful for detecting changes in core helicity that result from local changes in tL-Alan-tL constructs.2b,3b For example, changes in the lengths of either the Lysm regions or of the Alan cores contribute independently to CD spectra, which can be cap-corrected to yield core values. A comparison of [θ]222 data of Table 1, entries 2 and 3 show that, as a solubilizer, Arg can replace Lys.
Table 1.
| Ala10 sequences | [θ]222 |
|---|---|
| 1. W-K4-Inp2-tL-A10-tL-Inp2-K4-NH2 | +400 |
| 2. W-K4-Inp2-a-A10-A-Inp2-K4-NH2 | −2100 |
| 3. W-R4-Inp2-a-A10-A-Inp2-R4-NH2 | −1500 |
| Ala12 sequences | [θ]222 |
|---|---|
| 4. W-K4-Inp2-tL-A12-tL-Inp2-K4-NH2 | −3900 |
| 5. W-K4-tL2-tL-A12-tL-tL2-K4-NH2 | −2400 |
| Ala15 sequences | [θ]222 |
|---|---|
| 6. W-K4-Inp2-tL-A15-tL-Inp2-K4-NH2 | −15 400 |
| 7. W-K4-tL2-tL-A15-tL-tL2-K4-NH2 | −15 500 |
| 8. W-K4-Aze2-tL-A15-tL-Aze2-K4-NH2 | −16 700 |
| 9. W-K4-Inp2-tL-A15-A-Inp2-K4-NH2 | −17 200 |
| 10. W-K4-Inp2-a-A15-tL-Inp2-K4-NH2 | −17 700 |
| 11. W-K4-Inp2-a-A15-A-Inp2-K4-NH2 | −21 100 |
Per-residue ellipticity data, deg cm2 dmol−1, are cap-corrected as previously reported.3b
tL, tert-leucine; Inp, 4-carboxypiperidine; Aze, azetidine-3-carboxylic acid; a, d-alanine.
Further table data address the important issue of helicity-inhibiting effects of Inp2tL and tLInp2. Does the hydrophobic bulk of the piperidine rings of Inp2 alter helicity at sites once-removed from the core? A comparison of entry 6 with 8 shows that, for A15 peptides, replacement of Inp by the substantially less bulky Aze 3-carboxyazetidine does not perturb [θ]222 within measurement error.14 Does the tL-Inp tertiary amide strongly perturb helicity? Entries 4 and 5, 6 and 7 show that without significant change in [θ]222 either Inp2tL or tLInp2 can be replaced by the secondary amide-linked tripeptide sequence tL3, which is their functional equivalent.2b We conclude that any strong inhibition of core helicity by Inp2tL and tLInp2 caps must be attributed solely to the tL residue itself.
We have noted previously that, inconsistent with large values for wAla, classical unstructured CD spectra are observed for tL-Alan-tL, n = 10–12. Can lack of CD helicity be caused by tL? Entries 1, 2, and 3 show that [θ]222 lacks helical values if tL-Ala10-tL is replaced by a-Ala10-A; clearly Ala10 helicity is undetectable, even for j = c = 1.
The Table also presents CD data for tL-Ala15-tL, tL-Ala15-A, a-Ala15-tL, and a-Ala15-A peptides, all of which exhibit weakly helical CD spectra. This series allows comparisons of the results of mutation of one or both of the tL residues. If the value of one capping parameter is reduced from 1.0 to 0.0 by a mutation, the resulting [θ]222 change corresponds to a single residue deletion: e.g., if cLt = 0, [θ]222 for a-Ala15-tL should closely approximate that of a-Ala14-A. In either tL-Ala15-tL or a-Ala15-A series, a polynomial length fit of [θ]222 values has a local per-residue change of (−4.3 ± 0.2) × 103 deg dm−1 cm−1 for n = 14 through 18.3b,15 Comparisons of this slope with results of single and double tL substitutions in a-Ala14-A, entries 6, 9, 10, and 11, imply that values for jLt and cLt are bounded by 1.0 and 0, with likely values that are close to 0.5. A similar conclusion follows from our previously reported C-terminal [θ]222 values.6
Lifson–Roig Modeling of Site Helicities FHi for Conformational Ensembles
Both NMR 13C═O and 13Cα chemical shifts are used to assign secondary structure within protein sequences16 as well as helicities for peptides17 and proteins in native and partially structured states.18 For selectively labeled constructs a-A15-A and tL-An-tL, n = 7 through 19, we now analyze 13C═O NMR chemical shift data measured in water at 2 °C. In principle, a 13C chemical shift of a residue i of a helical peptide sequence is proportional to the site helicity FHi, the mole fraction of peptide conformations that are helical at residue i. An experimental FHi is thus an abundance-weighted average of values for members of an ensemble containing fully and partially helical conformations. For an Alan peptide, the weight of a single ensemble conformation corresponds to one of the 2n terms in an L–R state sum.8
Individual conformations cannot be characterized, but ensemble averages of these properties can be calculated from L–R parameters such as w, c, and j. If these have been assigned, FHi can be calculated as sshelix,i/ss, in which sshelix,i is the part of the state sum that includes weights of all conformations in which the ith residue is part of a helix. The average of FHi over all potentially helical sites i is the fractional helicity FH of the full Alan peptide, which is relatable to the CD ellipticity [θ]222, the most commonly used tool for characterizing global peptide helicity.
A data set of FH or FHi for an Alan library allows the reverse of this process: use of L–R algorithms to assign the best-fit parameters w, j, and c. Libraries must be constructed to minimize covariance between parameters, since inclusion of each new amino acid residue within library sequences adds three to the size of the parameter set. The polyalanines are uniquely suitable for falsification tests of the L–R hypothesis that the value of w is length-independent, since a library of tL-An-tL peptides allows FHi to be defined by just three parameters: wAla, jLt, and cLt; for a-A15-A peptides, wAla alone is required.
For a peptide such as tL-Alan-tL, four types of conformations contribute to FHi. Most partially helical conformations of length k < n extend to neither tL residue, and these have L–R weights jAlaυ2wAlakcAla = υ2wAlak. Two types of helical conformations are capped by one but not both tL residues; depending upon whether they extend to the N- or the C-terminus, these are weighted jLtυ2wAlak or υ2wAlakcLt. Only the completely helical conformation is weighted jLtυ2wAlakcLt. If both jLt and cLt are assigned very large values, this conformation dominates the ensemble, and the site-dependent FHi plot approaches 1.0 for all i. The opposite extreme is provided by a helical peptide characterized by a w that approaches 1.0 and that lacks strongly helix-stabilizing N- and C-caps. All its helical conformations, short and long, make significant contributions to the FHi, which are maximal in the central region and decrease substantially toward each terminus. Such a helix is commonly described as “frayed”.
An introduction to the interpretation of 13C-derived FHi data is provided by Figure 2a–c, which deconstructs each modeled FHi value at a series of Ala15 sites as a sum of contributions from a length series of ensemble members. A key question is how are changes in the magnitudes of j and c mirrored in the site values of FHi? Data of Figure 2a–c were L–R modeled for a hypothetical tL-A15-tL peptide in which the capping parameters are assigned three values: jLt = cLt = 0.0, 1.0, or 10.0. To facilitate comparisons, the calculated value of the central residue FH8 is set as 0.66, which corresponds to the experimental δ13C═O at site 8 of tL-Ala15-tL at 2 °C in water. To achieve this value, the wAla must vary inversely with jLt = cLt. Thus for jLt = cLt = 10, the required wAla is 1.1854, but for jLt = cLt = 0.0, wAla is 1.5215. These wAla values nearly span the range reported for helix-stabilizing amino acids.4,5a
Figure 2.
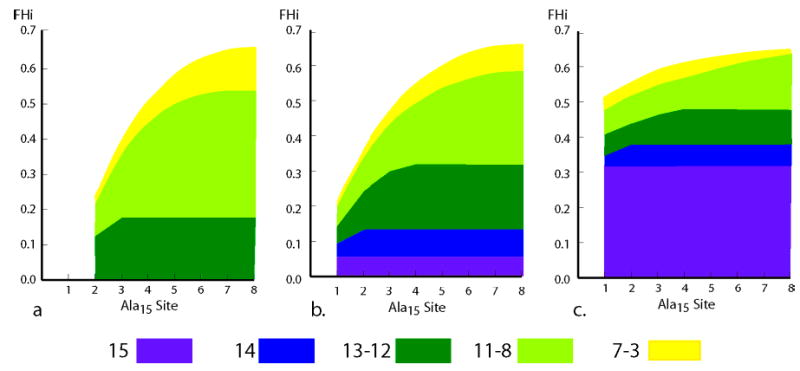
L–R-modeled magnitudes of capping contributions to site-dependent FHi for an Ala15 peptide. (a) j = c = 0; (b) j = c = 1.0; (c) j = c = 10. Values for FHi correspond to the upper boundary of yellow regions, and fractional contributions to each FHi from helical conformations of different lengths are symbolized by colored zones. The values of w were chosen to yield a constant value of FH8 = 0.66. FHi for sites 9–15 mirror corresponding FHi at sites 7–1.
In each plot, the upper boundary of the yellow region defines FHi, and differences between ordinate values at the upper and lower boundaries of each colored region correspond to contributions to FHi from conformers within a defined length range. Nonzero weights for the three conformers of lengths 15 and 14 (purple and blue) contribute to all FHi. If the values of jLt and cLt approach zero, their weights become insignificant, but if jLt = cLt is increased from 1 to 10, the weights are respectively increased by 100 and 10. In this case, as seen in Figure 2c, these three conformers dominate the helical ensemble.
Changes in capping parameters thus control mole fractions of longer helical conformers, and these in turn largely determine the site dependences of the FHi. If the capping parameters assume large values, the site dependence of FHi is remarkably small, and the local curvature in the central region of a FHi plot is decreased by any effect that stabilizes long over short helical conformers. If jLt = cLt approaches zero, only conformations that lack N- and C-terminal capping weights contribute significantly to the helical ensemble, and the longest helical conformer that contributes to the state sum has length (n − 2). In effect, for these capping values, the residue length of the helical region for the Alan peptide is truncated by two. Thus if its j = c = 0, an Ala15 peptide behaves like a corresponding a-Ala13-A peptide, modeled by the same w. Finally, comparison of Figure 2a and 2b shows that a change in jLt = cLt from 0 to 1 dramatically increases FH3, FH2, and FH1, decreasing the difference between these values. The corresponding site dependences within the central region are much less sensitive to changes in jLt = cLt.
Assignment of Site-Dependent Chemical Shifts and Preliminary Studies of 13C≡O Data
Prior to helicity analysis, the 13C NMR chemical shift for each Alan residue must be assigned. For heteropeptides, standard 1H, 13C, and 15N NMR experiments are used for these assignments. Poor dispersion prevents an analogous Alan assignment, but the alternative, synthesis and NMR analysis of n singly labeled position isomers, is prohibitively time-intensive. We used a new, highly efficient 13C tagging of multiple sites within a single peptide. A series of distinct 13C/12C ratios were incorporated at up to six residue sites; the relative 13C intensity of a resonance then identifies its site.
As reported previously for 1H spectra,19 13C Ala resonances for Inp-containing peptides exhibit anomalous multiplicities. These reflect mixtures of slowly equilibrating c- and t-state diastereomers formed at the tertiary amide linkages. For studies of 13C-labeled tL-Alan-tL peptides, we turned to the functionally equivalent W-Lysm-tL 3-Alan-tL3-LysmNH2 series, which show normal singlets. A single Inp residue appears in members of the 13C-labeled a-Alan-A peptide series, and NMR resonances of 13C-labeled Ala residues within the C-terminal Alan region appear as close doublets, but FHi values can be assigned from area-weighted averages of their integrated intensities.
| (1) |
| (2) |
Under the assumption that end and position effects are insignificant, 13C═O and 13Cα chemical shifts have been previously used to calculate FH values from eq 1.17,18 The required, recently assigned1913C═O calibrations for α-helical Ala (FHi ϒ 1.0) and unstructured Ala (FHi ϒ 0.0) in an Alan context are incorporated in eq 2. If position effects are small, the FHi calculated at a particular site from 13C═O and 13Cα data should be identical. Data of Table 2 show that these FHi are in reasonable agreement at sites 3 through 8, but the agreement is much less satisfactory in end regions. The data also reveal a striking lack of left/right symmetry for both data sets. This observation is consistent with a recent ab initio modeling study of 13C chemical shifts for short, completely helical Alan peptides, which demonstrates a large position dependence within the C-terminus.20
Table 2.
Values for FHi Calculated from Eq 1 from 13C═O and α-C Chemical Shifts for 13C Site-Labeled tL-Ala15-tL in Water at 25 °C, Using Previously Assigned Limiting Chemical Shift Parameters19
| A. 13C═O-derived FHi (first site data appear in first row; second site data, in second row) | |||||||
|---|---|---|---|---|---|---|---|
| sites 1,15 | sites 2,14 | sites 3,13 | sites 4,12 | sites 5,11 | sites 6,10 | sites 7,9 | site 8 |
| 0.05 | 0.21 | 0.26 | 0.32 | 0.35 | 0.37 | 0.375 | 0.37 |
| – | 0.02 | 0.07 | 0.22 | 0.29 | 0.325 | 0.34 | |
| B. 13Cα-derived FHi | |||||||
|---|---|---|---|---|---|---|---|
| sites 1,15 | sites 2,14 | sites 3,13 | sites 4,12 | sites 5,11 | sites 6,10 | sites 7,9 | site 8 |
| 0.00 | 0.26 | 0.29 | 0.31 | 0.36 | – | 0.39 | 0.39 |
| 0.00 | 0.02 | 0.15 | 0.25 | – | 0.35 | – | |
Our initial strategy for assigning j and c was based on site-dependent 13C data of Figure 3. The red circles correspond to experimental 13C═O chemical shifts for the tL-Ala15-tL peptide measured in water at 2 °C, with open red circles used for data that are influenced by end effects. The black curves correspond to site-dependent chemical shifts calculated from five fixed w L–R modelings for j = c assignments of 0, 0.5, 1.0, 2.0, 10. This assignment strategy clearly fails. The dispersion of chemical shifts required to assign jLt and cLt are seen only for the less reliable open circle data. Moreover the data at sites 4–8, which are expected to better correlate with FHi, show almost no dispersion. These data suggest dominance of longer helical conformers within the helical ensemble, which is inconsistent with conventional L–R modeling. Moreover the data are approximated only by values of jLt = cLt that exceed 1.0, contrary to CD evidence that both jLt and cLt lie between 1 and 0.
Figure 3.
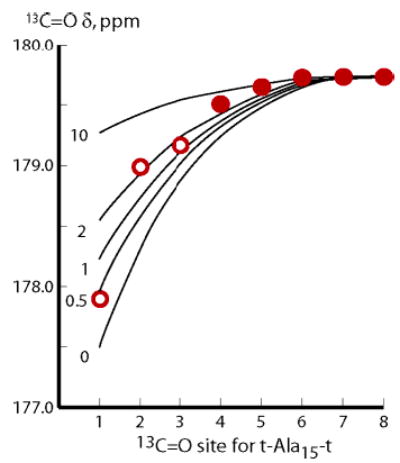
Experimental 13C═O chemical shift values for tL-A15-tL, measured at 2 °C in water, red closed and open circles, compared with values calculated from eq 2. Required FHi values were calculated from a conventional L–R model with fixed w, adjusted to yield the experimental central residue chemical shift. The curves for j = c = 0, 1, and 10 thus correspond to the FHi values of the three Figure 2a–c. For each curve, w was normalized to yield 179.25 ppm for chemical shifts at sites 7 and 8.
More useful information is obtained from a comparison of 13C═O chemical shifts for tL-Ala15-tL and a-Ala15-A, measured at 2 °C in water, Figure 4. The larger central residue chemical shift for a-Ala15-A peptide vs tL-Ala15-tL proves that tL caps are helix-destabilizing. The data also prove that left/right asymmetries observed for tL-Ala15-tL must be intrinsic to Alan and are not attributable to the tL caps.
Figure 4.
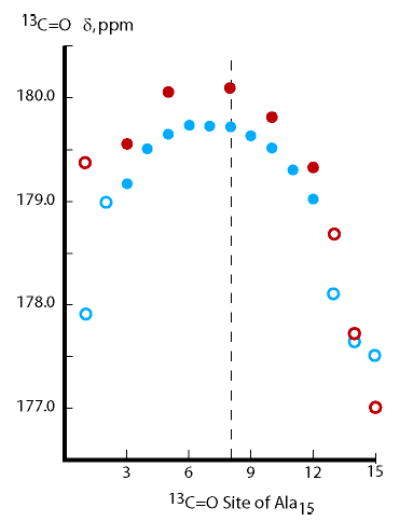
Site-dependent 13C═O chemical shifts at 2 °C in water for the tL-Ala15-tL peptide, blue circles, and the a-Ala15-A-Inp peptide, red circles.
What feature of Alan is responsible for these asymmetries? Each site-dependent 13C chemical shift is an abundance-weighted average over the ensemble conformers. At the N-terminal and C-terminal sites, where the asymmetries are largest, all helical conformers that contribute to the average are respectively initiated and terminated. Plausibly the asymmetries reflect chemical shift differences of terminal Ala amides caused by helix dipoles21 and distinct local solvation environments.22 To explore this hypothesis, an L–R model was constructed in which each FHi reflects contributions from three subensembles of helices that are initiated, continued, or terminated at the site i. Figure 5 shows that broad central regions are dominated by the second population, but the first and third dominate end regions. Qualitatively, these results are consistent with the experimental left/right asymmetries of Table 2 and Figure 4.
Figure 5.
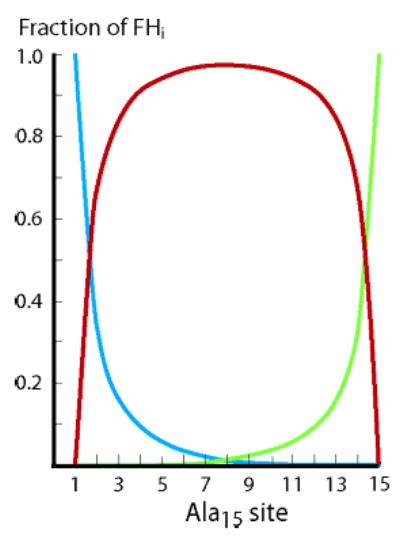
A L–R deconvolution of site helicities FHi as contributed by three types of helices for j = c = 1.0 and for subsequently assigned values for wAla(n). The blue curve reflects the weight of helices initiated at site i; the green, helices terminated at site i; the red, all other helices. Helices containing 9 or more residues are used to calculate blue and green curves. Similar plots result if blue and green curves include shorter helices. A subsequent application of these modeling results appears in Figure 8.
13C═O Chemical Shifts of Central Residues as a Test of the Length-Independence of w Values; A Length-Dependent w Series; Assignment of tL Capping Parameters
In this section we resolve the two central issues of this report: the possible dependence of wAla on conformer length and the assignment of values for w, jLt, and cLt. As seen in Figure 6, for the plausible limits of jLt, and cLt, the central residue 13C═O chemical shifts measured in water at 2 °C for the tL-Alan-tL series, n = 9, 11, 13, 15, 19 cannot be modeled by a length-independent wAla.
Figure 6.
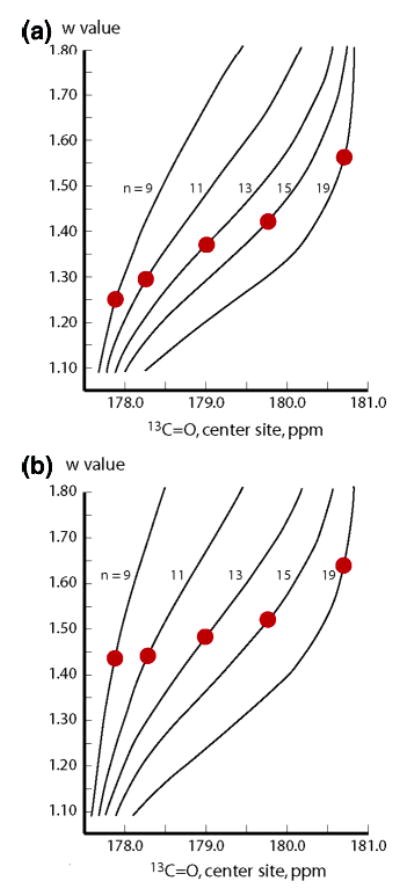
Tests of the length independence of helical propensities, wAla. (a) j = c = 1.0; (b) j = c = 0.0. Red dots correspond to experimental central Ala residue 13C═O chemical shifts for the length series of tL-Ala15-tL peptides at 2 °C. For each length n, lines correlate constant w values with calculated chemical shifts. The hypothesis of a length-independent wAla is falsified.
To assign conjointly both a length dependent series of wAla(n) and a value for (jLt = cLt), this set of shifts was expanded to include the central residue 13C═O shift at 2 °C for the peptide a-Alan-A. From the set of tL-Alan-tL data, paired with each of 11 choices for 0 ≤ (jLt = cLt) ≤ 1.0, taken at intervals of 0.1, we constructed a set of 11 length-dependent wAla (n). Each assignment was made recursively, using, in turn, central residue 13C chemical shift data for n = 9, 11, 13, 15, 19. Previously reported t/c data3a were used in the first iteration, as described in the Experimental Section. From each of these 11 (jLt = cLt) + wAla (n) pairs, by setting ja = cA−Inp ) 1, we calculated a central residue chemical shift for the a-Ala15-A peptide. These are shown as blue squares in Figure 7. The experimental chemical shift for the a-Ala15-A peptide21 appears in red on the ordinate and corresponds to jLt = cLt = 0.4 ± 0.1.23 The values in this range, paired with their wAla(n), thus mirror the experimental central residue chemical shifts of the tL-Alan-tL series, n = 9, 11, 13, 15, 19, as well as that for the calibrating a-Ala15-A peptide.
Figure 7.
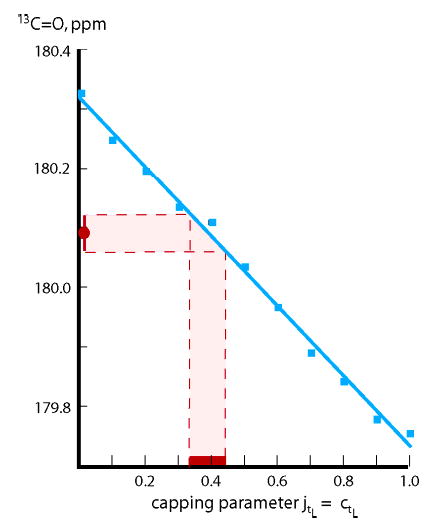
Assignment of best-fit values for jLt = cLt = 0.4 ± 0.1 (red abscissa region). The blue data points are 11 L–R shifts calculated for the central residue of a-Ala15-A-Inp 13C═O by setting n = 15, (ja = cA−Inp) = 1.0. For each calculation, a particular wAla(n) set is used, assigned from central residue tL-Alan-tL data with jLt = cLt equal to the abscissa value. The red ordinate region corresponds to the experimental chemical shift for the a-Ala15-A-Inp peptide.
| (3) |
Can one use the hypothesis underlying Figure 5, together with assigned jLt = cLt and wAla(n), to model 2 °C values of noncentral chemical shifts for the tL-Alan-tL length series? To explore this possibility, eq 3 was derived from eq 1 by partitioning each FHi into contributions from conformations that are initiated at site i, FHi−I; extended at site i, (FHi − (FHi−I + FHi−T)); or terminated at site i, FHi−T. This model requires three values for δ13Cα −Helix. Our prior value, 180.9 ppm, is used for δ13Cα −Helix−E. For δ13Cα −Helix−I, 180.1 ppm is used, extrapolated from the experimental value at site 3 of the a-Ala15-A peptide. For δ13Cα −Helix−T we used 172.2 ppm, extrapolated from the experimental value at site 13 of this peptide. Data are compared with modeling results in Figure 8. Although data for n = 9 and for sites to the left of center are underestimated, the asymmetries are modeled successfully and most modeled points agree with data within experimental error.
Figure 8.
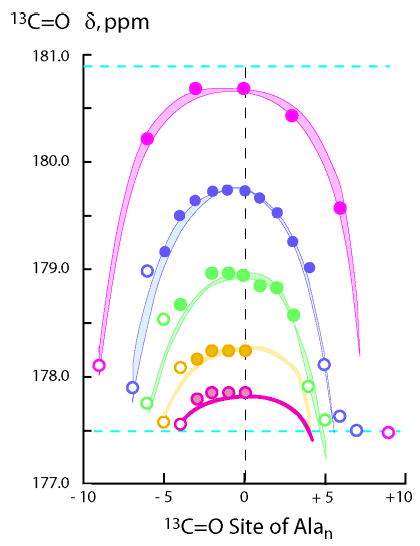
Quantitative L–R modeling using eq 3 of site-dependent 13C═O chemical shifts measured at 2 °C in water for the tL-Alan-tL peptide series. Magenta, data points for n = 19; blue, n = 15; green, n = 13; orange, n = 11; pink, n = 9. The cyan dotted lines show the limiting chemical shift values for Ala residues that are fully helical, top, or nonhelical, bottom. Boundaries of each curved region correspond to L–R modeling for jLt = cLt = 0.3 and 0.5, each paired with its wAla(n) set.
Discussion
This is the first of a series of reports in which length- and temperature-dependent wAla(n) values are assigned from independent sets of helicity data. No single type of helicity measurement is optimally precise throughout the span of a full Alan series. Within the length range of this study, experimental 13C═O chemical shifts are ideal, but neither can they be applied to peptides shorter than 10 residues, for which chemical shifts at 2 °C approach δ13CCoil, nor can they be applied to lengths longer than ca. 20 residues, for which shifts approach δ13Cα −Helix. Subsequent reports present CD and protection factor data that allow precise assignment of wAla(n) for longer peptides. Previously reported t/c values do permit an independent confirmation of the assignments made in this report. The t/c helicity assay has an optimal Alan length range of 4 to 15 residues and is uniquely sensitive to length-dependent changes in helical stability.3a
A t/c value is the ratio of integrated intensity of 1H NMR resonances for the s-trans and s-cis tertiary acetamido rotamers of the helix-initiating peptide N-cap Ac-Hel. Ac-Hel is a conformationally restricted derivative of Ac-Pro-Pro that is preorganized to initiate helices in a linked peptide. If Ac-Hel is linked to an Alan sequence, t/c is effectively proportional to a ratio of state sums for s-trans and s-cis conformational ensembles. Figure 9 shows t/c values measured in water at 2 °C for Ac-Hel-Alan-tL-Inp2-K4-W-NH2, n = 4 through 14, together with modeled t/c data using the cLt and wAla(n) assignments of the preceding section. For the Alan length range of 4 through 19 at 2 °C, our cap and w assignments quantitatively model both 13C and t/c data within measurement and assignment error.
Figure 9.
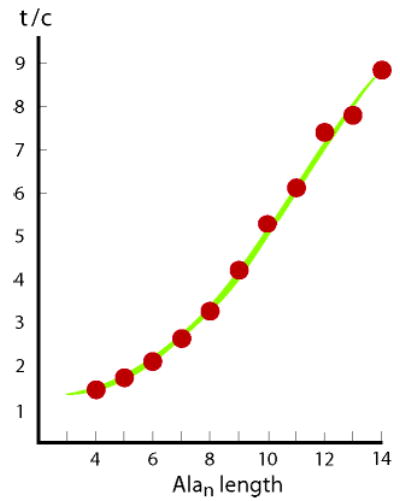
A fit of t/c data, red circles, for the series Ac-Hel-Alan-tL-Inp2-K4-W-NH2, n = 4 through 14, measured in water at 2 °C. The upper boundary of the green zone corresponds to t/c calculated for cLt = 0.5, paired with its wAla(n) parameter set. The lower boundary, which gives a slightly poorer fit, is calculated for cLt = 0.3, paired with its wAla(n) set. For the former, as noted in the Experimental Section, a c state N-capping parameter of 6.4 was fitted to the value of the n = 14 data point; for the latter, the corresponding value was 6.2. The remaining required modeling parameters A = 0.80 and B = 0.17 have been assigned previously from t/c data.3a
In any classical L–R model, the stability of a helical homopeptide increases linearly with its length, but the values we have assigned for wAla(n) imply that the actual increase must be greater than linear. H-bonding cooperativity is the likely cause. In accord with conclusions of earlier modeling results,24 ab initio calculations by Wieczorek and Dannenberg25 show that for Alan helices the strengths of amide–amide H-bonds increase significantly with peptide length n. Testable predictions with paradigm-breaking potential follow from this nonlinearity. For example if the length increase of wAla(n) is attributable to H-bonding cooperativity, this effect, which is a property of the helix backbone, is likely to be largely independent of residue and sequence. It then follows that helical propensities for all residues are expected to increase proportionately with length, but their ratios should be length-independent. Residues that are borderline breakers (w < 1) in short helices may be transformed into helix formers (w >1) in longer helices.
A final issue concerns the magnitude of changes in helical structure that result from a length dependence for wAla(n). Inspection of the TOC graphic for this report reveals the changes in the tL-Ala15-tL helical ensemble population that results if L–R modeling using a constant w = 1.496 is replaced by our new length-dependent values. At all sites the relative contribution to FHi by helical conformations of lengths 12 to 13 is nearly constant, but the contribution from lengths 14–15 increases substantially, at the expense of shorter conformations.
Experimental Section
Synthesis, Purification, and Characterization of Peptides
Peptides were synthesized on a 0.02–0.03 mol scale by automated continuous-flow solid-phase synthesis using a PE Biosystems Pioneer Peptide Synthesizer with standard 9-fluorenylmethyleneoxy-carbonyl (Fmoc/HATU) chemistry, and peptides were cleaved from the resin as reported previously.3 Each unlabeled coupling used 9 equiv of Fmoc-AA-OH and HATU. The labeled sites used HATU and 3 equiv of a mixture of 13C labeled and nonlabeled Fmoc-Ala-OH with 13C percentages that varied from 100% to 25%. Each labeled site was then double coupled with 9 equiv of nonlabeled Fmoc-Ala-OH. Although the 13C-α chemical shifts appear to be less sensitive to position effects, the cheaper 13C═O labels were used for this study.
Purification was carried out on a Waters 2690 HPLC with autoinjector and 996 detector using YMC ODS-AQ 200 Å 4.5 mm × 150 mm columns. Closely related unlabeled peptides were previously demonstrated to be unaggregated under measurement conditions by AUC.3,19 MS data obtained on a Waters ZMD mass spectrometer and labeling patterns used to assign tL-Alan-tL 13C═O chemical shift values of Figure 9 are reported in the Supporting Information.
CD Experiments
Circular dichroism measurements were obtained on an Aviv 62DS spectrometer, and peptide concentrations were determined on a Cary 300 UV–vis spectrometer utilizing the Trp chromophore of the peptide, as previously reported.3,5,12b The 62DS was calibrated using titrated water solutions of sublimed 9-camphor-sulfonic acid. 3
NMR Experiments
Our 13C labeling technique, based on varying 13C/12C ratios, significantly improves the speed and efficiency of 13C chemical shift characterization. Since an Alan is a homopeptide, residues isolated from end regions are expected to experience very similar environments. Gratifyingly very similar line widths were observed for all 13C resonances of this study. (See the Supporting Information for a representative spectrum.) Prior to chemical shift assignment, peptide samples were subjected to NH → ND exchange by at least three overnight lyophilizations from D2O. Concentrations in D2O within the range of 2–10 mM were used for NMR measurements. The 13C spectra were taken on a 500 MHz Oxford Magnet, with a Unity INOVA console using a Varian 500 SW/PFG broadband probe. Standard 13C parameters were used: delay, 0.763 s; pulse width 6.9 ms, acquisition time, 1.736 s; line broadening, 2 Hz; 128 to 512 scans were needed to get adequate signal-to-noise. The 13C chemical shifts were referenced relative to 1 mM DSS.26 With precautions to ensure equilibration, temperature was measured using neat methanol. Owing to the temperature dependence of FHi, measurement errors can bias assigned 13C═O chemical shifts. Calibration of limiting 13C shifts for any new peptide series is an essential precondition for calculation of FHi from chemical shift data. Our value of 180.9 ppm for the limiting helical chemical shift of an Ala residue19 substantially exceeds the average of reported Ala values from the protein database. It was measured for an unaggregated Ala12 peptide in which high helicity (99+ %, assigned from NH → ND exchange kinetics) was induced by optimal N- and C-caps. The method of Cordier and Grzesiek27 was used to establish dominance of α-helical structure and absence of detectible 310 character.
Lifson–Roig Modeling
Previously reported algorithms2e were used to calculate FHi values and modeling data that appear in Figures 2, 4, and 6 and in the TOC. For the modeled t/c data of Figure 9, the previously reported algorithm3a was used with one change. Helical conformations initiated by the Ac-Hel c state were assigned an N-capping parameter with a value chosen to fit the experimental t/c observed for Ala14; as a helix-inducing N-cap the Ac-Hel c state has ca. two-thirds the efficiency of an N-acetyl group.
The Alan data of Figures 5 and 8 were calculated for each i site of each peptide of length n by sorting the explicit h,c list of major L–R helical conformers2e into three groups. Each h,c list corresponds to groups of terms within the helical state sum, which is then partitioned analogously. This sorting yields sshelix,i,I and sshelix,i,T, but the remaining terms of the site i state sum sshelix,i are contributed by helices that are neither initiated or terminated at site i: sshelix,i − (sshelix,i,I + sshelix,i,T). Division by sshelix,i then gives the three ordinate values of Figure 5; division by the overall state sum ss gives the values of FHi−I and FHi−T required for eq 3 and used in Figure 8.
Iterative L–R regressions were used to assign each of the 11 wAla(n) series used for the modeling of Figure 7. Length-dependent wAla(n) values are assumed to increase monotonically by small increments and converge to a limiting value for sufficiently large n. For a first iteration we started with previously reported t/c data in the length range of 1 to 8;3a these are compatible with wAla(n) values of 1, 1, 1, 1, 1.28, 1.31, 1.33, 1.34. Using tL-Alan- tL chemical shift data, n = 9 and 11, under the assumption that j = c = 0, values for wAla(n), n = 7–11 were adjusted or assigned that minimized residuals. By an analogous recursive process, the wAla(n) data set was extended to n = 19. In nearly all cases the condition wAla(n +1) − wAla(n) ≤ 0.03 was met. This recursion process was then repeated 10 times, with a progressive increase of j = c by 0.1; for each of these, perturbations were made in the previously defined wAla(n) data set. The 19-member wAla(n) series at 2 °C, j = c = 0.5, from t/c, and 13C data are (in numerical order from 1 to 19) as follows: 1, 1, 1, 1, 1.28, 1.31, 1.33, 1.34, 1.39, 1.41, 1.425, 1.455, 1.48, 1.505, 1.525, 1.54, 1.565, 1.58, 1.59. Alternative regression strategies provide close approximations to this series. A conventional L–R state sum is a polynomial in υ and w, in which each wk power term corresponds to the overall weight of helices of length k. It is converted to the modified L–R state sum required for the wAla(n) calculation by treating w as a dummy variable (w = 1.0) and multiplying each wk term by wAla(k)k.2e,3a
Supplementary Material
Acknowledgments
Financial support was provided by NIH Grant GM13453 (S.M.W. and R.J.K.).
Footnotes
Supporting Information Available: Typical 13C labeling examples, peptide MS, characterization tables, and an example of the FHi partitioning used to model data in Figures 8 and 9. This material is available free of charge via the Internet at http://pubs.acs.org.
References
- 1.Aurora R, Rose GD. Protein Sci. 1998;7:21–38. doi: 10.1002/pro.5560070103. [DOI] [PMC free article] [PubMed] [Google Scholar]
- 2.Doig AJ, Baldwin RL. Protein Sci. 1995;4:1325–1336. doi: 10.1002/pro.5560040708. (a) [DOI] [PMC free article] [PubMed] [Google Scholar]; b Miller JS, Kennedy RJ, Kemp DS. Biochemistry. 2001;40:305–309. doi: 10.1021/bi0019500. [DOI] [PubMed] [Google Scholar]; c Maison W, Arce E, Renold P, Kennedy RJ, Kemp DS. J Am Chem Soc. 2001;123:10245–10254. doi: 10.1021/ja010812a. [DOI] [PubMed] [Google Scholar]; d Deechongkit S, Tsang KL, Renold P, Kennedy RJ, Kemp DS. Tetrahedron Lett. 2000;41:9679–9683. [Google Scholar]; e Kemp DS, Helυ Chim Acta. 2002;85:4392–4423. [Google Scholar]
- 3.Kennedy RJ, Kwok KY, Kemp DS. J Am Chem Soc. 2002;124:934–944. doi: 10.1021/ja016285c. (a) [DOI] [PubMed] [Google Scholar]; b Miller JS, Kennedy RJ, Kemp DS. J Am Chem Soc. 2002;124:945–962. doi: 10.1021/ja011726d. [DOI] [PubMed] [Google Scholar]
- 4.Wojcik J, Altmann KH, Scheraga HA. Biopolymers. 1990;30:11–143. doi: 10.1002/bip.360300112. (a) [DOI] [PubMed] [Google Scholar]; (b) Scheraga, H. A. In Perspectiυes in Structural Biology; Vijayan, M., Yathindra, N., Kolaskar, A. S., Eds.; Indian Academy of Sciences; Bangalore, 1999; pp 275–292.
- 5.Chakrabartty A, Kortemme T, Baldwin RL. Protein Sci. 1994;3:843–952. doi: 10.1002/pro.5560030514. (a) [DOI] [PMC free article] [PubMed] [Google Scholar]; b Spek EJ, Olson CA, Shi Z, Kallenbach NR. J Am Chem Soc. 1999;121:5571–5572. [Google Scholar]
- 6.Maison W, Kennedy RJ, Miller JS, Kemp DS. Tetrahedron Lett. 2001;42:4975–4977. [Google Scholar]
- 7.In a conventional Lifson–Roig algorithm, the helical weight is jυ2w(n−2)c. In this report we use the weight jυ2wc, which has significant advantages.2e
- 8.Lifson S, Roig A. J Chem Phys. 1961;34:1963–1874. [Google Scholar]
- 9.Rohl CA, Scholtz JM, York EJ, Stewart JM, Baldwin RL. Biochemistry. 1992;31:1263–1269. doi: 10.1021/bi00120a001. [DOI] [PubMed] [Google Scholar]
- 10.Forood B, Feliciano EJ, Nambiar KP. Proc Natl Acad Sci USA. 1993;90:838–842. doi: 10.1073/pnas.90.3.838. [DOI] [PMC free article] [PubMed] [Google Scholar]
- 11.Lyu PC, Sherman JC, Chen A, Kallenbach NR. Proc Natl Acad Sci USA. 1991;88:5317–5320. doi: 10.1073/pnas.88.12.5317. (a) [DOI] [PMC free article] [PubMed] [Google Scholar]; b Hermans J, Anderson AG, Yun RH. Biochemistry. 1992;31:5646–5653. doi: 10.1021/bi00139a031. [DOI] [PubMed] [Google Scholar]
- 12.Fairman R, Anthony-Cahill SJ, DeGrado WF. J Am Chem Soc. 1992;114:5458–5459. (a) [Google Scholar]; (b) Allen, T. J. Ph.D. Dissertation, M.I.T., 1993.
- 13.Schimmel PR, Flory PJ. J Mol Biol. 1968;3:105–120. doi: 10.1016/0022-2836(68)90237-4. [DOI] [PubMed] [Google Scholar]
- 14.From [θ]222 values for the tL-Alan-tL length series,3b the error in a [θ]222 difference is estimated as 8–10%; values less than ±2000 have an error margin of ca. 100%.
- 15.Walker, S. M.; Kemp, D. S. Unpublished observations.
- 16.Wishart DS, Richards FM, Sikes BD. J Mol Biol. 1991;222:311–333. doi: 10.1016/0022-2836(91)90214-q. (a) [DOI] [PubMed] [Google Scholar]; b Wishart DS, Sikes BD. Methods Enzymol. 1994;239:363–392. doi: 10.1016/s0076-6879(94)39014-2. [DOI] [PubMed] [Google Scholar]
- 17.Shalongo W, Dugad L, Stellwagen E. J Am Chem Soc. 1994;116:2500–2507. (a) [Google Scholar]; b Werner JH, Dyer RB, Fesinmeyer RM, Andersen NH. J Phys Chem B. 2002;106:487–494. [Google Scholar]
- 18.Eliezer D, Yau J, Dyson HJ, Wright PE. Nat Struct Biol. 2001;5:148–155. doi: 10.1038/nsb0298-148. [DOI] [PubMed] [Google Scholar]
- 19.Heitmann B, Job GE, Kennedy RJ, Walker SM, Kemp DS. J Am Chem Soc. 2005;127:1690–1704. doi: 10.1021/ja0457462. [DOI] [PMC free article] [PubMed] [Google Scholar]
- 20.Vila JA, Baldoni HA, Scheraga HA. Protein Sci. 2004;13:2939–2948. doi: 10.1110/ps.04930804. [DOI] [PMC free article] [PubMed] [Google Scholar]
- 21.Eaton G, Symons MCR. J Chem Soc, Faraday Trans 1. 1988;84:3459–3473. (a) [Google Scholar]; b Eaton G, Symons MCR, Rastogi PP, O’Duinn C, Waghorne WE. J Chem Soc, Faraday Trans 1. 1992;88:1127–1142. [Google Scholar]
- 22.Tidor B. Proteins: Struct, Funct, Genet. 1994;19:310–323. doi: 10.1002/prot.340190406. [DOI] [PubMed] [Google Scholar]
- 23.Equivalent fits to these data also result from a range of j ≠ c, provided their average lies between 0.3 and 0.5.
- 24.Mehler EL. J Am Chem Soc. 1980;102:4051–4056. (a) [Google Scholar]; b Guo J, Karplus M. J Phys Chem. 1994;98:7104–7105. [Google Scholar]
- 25.Wieczorek, R.; Dannenberg, J. J. J. Am. Chem. Soc. 2003, 125, 8124–8129 [DOI] [PubMed]
- 26.Markley JL, Bax A, Arata Y, Hilbers CW, Kaptein R, Sykes BD, Wright PE, Wüthrich K. Pure Appl Chem. 1998;70:117–142. [Google Scholar]
- 27.Cordier F, Grzesiek S. J Am Chem Soc. 1999;121:1601–1602. [Google Scholar]
Associated Data
This section collects any data citations, data availability statements, or supplementary materials included in this article.


