
Figure 5.
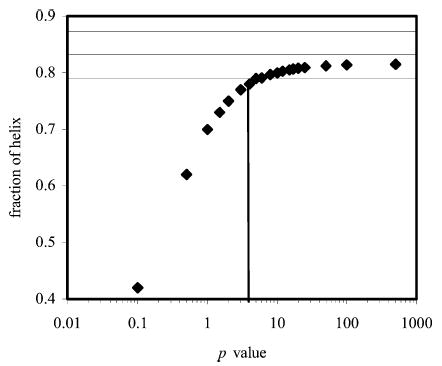
Plot showing the variation in the computed helix fraction of peptide KpS4 with the p value, as calculated using SCINT2 and singly charged phosphoserine. Horizontal lines indicate the error range of the experimental values.
Official websites use .gov
A
.gov website belongs to an official
government organization in the United States.
Secure .gov websites use HTTPS
A lock (
) or https:// means you've safely
connected to the .gov website. Share sensitive
information only on official, secure websites.
Plot showing the variation in the computed helix fraction of peptide KpS4 with the p value, as calculated using SCINT2 and singly charged phosphoserine. Horizontal lines indicate the error range of the experimental values.