

Abstract
Background
Because amphibians arise from a branch of the vertebrate evolutionary tree that is juxtaposed between fishes and amniotes, they provide important comparative perspective for reconstructing character changes that have occurred during vertebrate evolution. Here, we report the first comparative study of vertebrate genome structure that includes a representative amphibian. We used 491 transcribed sequences from a salamander (Ambystoma) genetic map and whole genome assemblies for human, mouse, rat, dog, chicken, zebrafish, and the freshwater pufferfish Tetraodon nigroviridis to compare gene orders and rearrangement rates.
Results
Ambystoma has experienced a rate of genome rearrangement that is substantially lower than mammalian species but similar to that of chicken and fish. Overall, we found greater conservation of genome structure between Ambystoma and tetrapod vertebrates, nevertheless, 57% of Ambystoma-fish orthologs are found in conserved syntenies of four or more genes. Comparisons between Ambystoma and amniotes reveal extensive conservation of segmental homology for 57% of the presumptive Ambystoma-amniote orthologs.
Conclusion
Our analyses suggest relatively constant interchromosomal rearrangement rates from the euteleost ancestor to the origin of mammals and illustrate the utility of amphibian mapping data in establishing ancestral amniote and tetrapod gene orders. Comparisons between Ambystoma and amniotes reveal some of the key events that have structured the human genome since diversification of the ancestral amniote lineage.
Background
Amphibians (salamanders, frogs, and cecilians) arise from a branch of the vertebrate evolutionary tree that is juxtaposed between aquatic fishes and more terrestrial amniotes (Figure 1). This phylogenetic location therefore positions amphibians to provide important comparative perspective for reconstructing character changes that have occurred during vertebrate evolution. For example, the amphibian perspective is essential for understanding molecular, developmental, and morphological changes of appendages that are associated with the transformation of obligatorily aquatic fish to terrestrial tetrapods [1-4]. In addition, because amphibians are the most basal tetrapod lineage, the amphibian perspective is essential for understanding the evolution of amniote characteristics among the "higher vertebrate" groups. Although many studies have exploited the phylogenetic position of amphibians for comparative perspective, very few comparisons have been made at the genome level. Here we present results from the first broad-scale comparison of genome structure between an amphibian and other representative vertebrate taxa.
Figure 1.
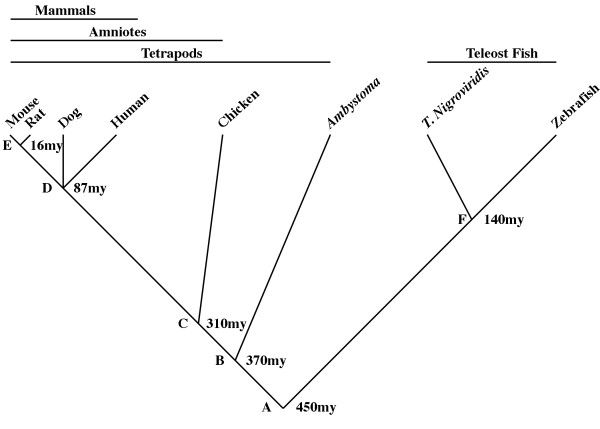
An abridged phylogeny of the vertebrates showing the species used and divergence times. Letters mark ancestral nodes: A – the euteleost (bony vertebrate) ancestor [62], B – the tetrapod ancestor [63], C – the amniote ancestor [64, 65], D – the (eutherian) mammalian ancestor [66], E – the (murid) rodent ancestor [66], and the teleost fish (euteleostei) ancestor [67, 68].
One of the most fundamental structural characteristics of genomes is the order in which protein-coding genes are arranged on chromosomes. Gene order is determined using one of several approaches, including physical mapping, linkage mapping, and whole genome sequencing. The most powerful approach is whole genome sequencing [5-9], but only if the final product is a complete (or nearly complete) genome assembly. Physical mapping refers to the direct localization of a gene to a whole or partial chromosome, for example by the method of somatic cell hybridization [10-13] or chromosome in-situ hybridization [14-17]. In comparison to these physical genome approaches, genetic linkage mapping refers to the approach of estimating recombination frequencies among loci (genes) in a segregating cross for the purpose of ordering genes into linkage groups [e.g. [18]]. Ultimately, the genomic approach taken to order genes in a particular species is determined by genome characteristics and the availability of resources. For example, the extremely large genome size of some amphibians makes it difficult to justify a whole genome sequencing effort at this time [19,20]. However, genetic linkage mapping is an efficient strategy for amphibians because large numbers of offspring can be obtained from segregating crosses, thus allowing accurate estimates of map position [21].
Until recently, there were few amphibian gene order data available for comparative analyses of vertebrate genome structure [22,23]. Much physical genome sequence has been collected recently for an anuran amphibian (Xenopus tropicalis), but this sequence has not yielded a complete genome assembly and there are no large-scale genetic maps for Xenopus that can be used in comparative studies [24]. The recently developed genetic linkage map for the salamander genus Ambystoma, however, now provides an amphibian resource that can provide structural and evolutionary perspective at the genomic level [21]. Here we report on the largest gene order dataset ever obtained for an amphibian. We use this dataset to describe the extent to which gene orders have been conserved between Ambystoma and other representative vertebrate species with assembled physical genome maps. We also describe several examples that demonstrate the importance of the amphibian genome perspective for reconstructing gene orders of the ancestral tetrapod and amniote genomes, and for understanding the importance of gene order rearrangement in vertebrate evolution.
Results
Identification of putative orthologs
We searched 491 protein-coding marker sequences from the Ambystoma genetic map against the genome sequences of human (Homo sapiens), mouse (Mus musculus), rat (Rattus norvegicus), dog (Canis familiaris), chicken (Gallus gallus), zebrafish (Danio rerio), and freshwater pufferfish (Tetraodon nigroviridis) to identify presumptive orthologs. For each search, we defined orthologs as the BLAT hit with the highest bitscore, plus all other hits within 1% of the highest bitscore. Using this definition, orthologs for 344 (70%) Ambystoma sequences were identified within the genome of at least one species in the reference set. Alignment summaries for all presumptive Ambystoma-vertebrate orthologs are provided as supplementary data [see Additional file 1]. The number of Ambystoma orthologs varied among species, ranging from 237 – 322. A low proportion of Ambystoma orthologs aligned to more than one presumptive ortholog in all comparisons (human, 4.0%; dog, 6.0%; mouse, 8.4%; rat, 4.4%; chicken, 1.8%; T. nigroviridis, 4.9%; zebrafish, 3.8%). In general, a greater number of Ambystoma orthologs were identified among amniote taxa versus fish taxa (Table 1). This suggests greater conservation of orthologs among tetrapod taxa.
Table 1.
Summary of sequence alignments and analyses of synteny and segmental homology using the full set of mapped Ambystoma sequences
| Species | Divergence | Orthologs | BLAT | λ | % in |
| Timea | Alignments | SHb | |||
| Human | 370 MY | 322 | 341 | 0.25 ± 0.12 | 32 |
| Dog | 370 MY | 317 | 340 | 0.24 ± 0.12 | 25 |
| Mouse | 370 MY | 308 | 350 | 0.18 ± 0.12 | 27 |
| Rat | 370 MY | 316 | 340 | 0.19 ± 0.13 | 23 |
| Chicken | 370 MY | 284 | 301 | 0.33 ± 0.13 | 34 |
| T.nigroviridis | 450 MY | 243 | 255 | 0.23 ± 0.14 | 2 |
| Zebrafish | 450 MY | 237 | 248 | 0.18 ± 0.15 | 3 |
| Total Numbers | 343 | 2175 | 57 | ||
aThe approximate divergence time in millions of years (MY) between Ambystoma and the vertebrate species used in this study. See Figure 1 for references.
bSH = Segmental Homologies.
To gain insight into variation in genome coverage of Ambystoma-vertebrate orthologies, we compared the distribution of Ambystoma-human orthologies to the expected distribution under random sampling of human loci (Table 2). We selected the human genome assembly for this comparison [25] because the assembly is relatively complete and contains a large number of gene annotations. The observed number of orthologs on three human chromosomes (HSA1, 12, and 17) deviated significantly from the expected number (p > 0.01). Notably, all three of these chromosomes contained an excess of orthologies, rather than a deficiency. A single human chromosome (HSA4) contained a marginally significant deficiency of Ambystoma orthologies (p = 0.50), however, given the large number of comparisons, a similar deviation would be expected to occur by chance. Comparisons with the human genome assembly suggest that Ambystoma-amniote orthologies will provide coverage of most regions of ancestral vertebrate genomes.
Table 2.
Distribution of human/Ambystoma orthologies across human chromosomes
| Human | Annotated | Human/Ambystoma Orthologies | ||||
| Chromosome | Genesa | Observed | Expectedb | Deviationc | χ2 | p |
| HSA1 | 2,580 | 47 | 33.3 | + | 5.67 | 0.017 |
| HSA2 | 1,742 | 16 | 22.5 | - | 1.86 | 0.173 |
| HSA3 | 1,378 | 21 | 17.8 | + | 0.59 | 0.443 |
| HSA4 | 1,017 | 6 | 13.1 | - | 3.86 | 0.050 |
| HSA5 | 1,188 | 10 | 15.3 | - | 1.85 | 0.174 |
| HSA6 | 1,385 | 11 | 17.9 | - | 2.63 | 0.105 |
| HSA7 | 1,367 | 21 | 17.6 | + | 0.65 | 0.421 |
| HSA8 | 927 | 12 | 12 | + | 0.00 | 0.989 |
| HSA9 | 1,069 | 12 | 13.8 | - | 0.23 | 0.631 |
| HSA10 | 983 | 8 | 12.7 | - | 1.72 | 0.189 |
| HSA11 | 1,692 | 15 | 21.8 | - | 2.13 | 0.145 |
| HSA12 | 1,261 | 28 | 16.3 | + | 8.48 | 0.004 |
| HSA13 | 491 | 3 | 6.3 | - | 1.75 | 0.186 |
| HSA14 | 1,173 | 10 | 15.1 | - | 1.74 | 0.188 |
| HSA15 | 884 | 11 | 11.4 | - | 0.01 | 0.906 |
| HSA16 | 1,031 | 16 | 13.3 | + | 0.55 | 0.458 |
| HSA17 | 1,354 | 29 | 17.5 | + | 7.63 | 0.006 |
| HSA18 | 400 | 4 | 5.2 | - | 0.26 | 0.610 |
| HSA19 | 1,584 | 28 | 20.4 | + | 2.81 | 0.094 |
| HSA20 | 710 | 11 | 9.2 | + | 0.37 | 0.542 |
| HSA21 | 337 | 4 | 4.3 | - | 0.03 | 0.869 |
| HSA22 | 693 | 4 | 8.9 | - | 2.73 | 0.099 |
| HSAX | 1,125 | 13 | 14.5 | - | 0.16 | 0.693 |
aThe number of genes that were assigned to each human chromosome (Build 35.1) [25].
bThe expected number of human salamander orthologies is based on random sampling from the human genome. This number is calculated as the proportion of genes that occur on a given human chromosome multiplied by the entire number of human/Ambystoma orthologies that were identified (N = 340). A single HSAY orthology is excluded from this table.
c"+" designates a positive deviation from the expected number,"-" designates a negative deviation from the expected number.
Orthologs for a majority of Ambystoma marker sequences were identified in more than one reference genome (Figure 2). Of the 343 Ambystoma orthologs identified from all searches, 292 (85%) yielded hits to five or more genomes. A high proportion of Ambystoma-amniote orthologs were identified from four or more of the amniote taxa (88%). A lower proportion of Ambystoma-fish orthologs were identified from both fish taxa (68%). The relatively lower proportion of Ambystoma-fish orthologs may reflect lineage-specific gene losses and divergence that has occurred between these fish species, or differences in completeness of their genome assemblies. Below, we used Ambystoma orthologies as characters to identify conserved syntenies and gene orders and reconstruct key events in the evolution of vertebrate genomes.
Figure 2.

Frequency distributions of the numbers of presumptive Ambystoma orthologs that were identified among major vertebrate groups. Categories on the X-axes represent the total number of species within each major vertebrate group that yielded a presumptive Ambystoma ortholog.
Conservation of synteny
The association index λ describes the extent to which chromosomal assignments of loci (genes) in one species are predictive of chromosome assignments in another species (see Methods). High λ values indicate high predictability; such values are expected when few inter-chromosomal rearrangements of genes occur between two species after divergence from a common ancestor. Thus, λ provides a measure of the combined effects of phylogenetic distance and lineage specific rearrangement rates on the inter-chromosomal distribution of genes. We estimated λ for pairwise comparisons between Ambystoma and each of the seven reference vertebrate genomes. Significant (non-zero) association indices were observed for all comparisons and there was considerable variation in λ values (0.18 for Ambystoma vs. zebrafish and mouse to 0.33 for Ambystoma vs. chicken; see Table 1). Variable λ values for Ambystoma-amniote comparisons illustrate the importance of lineage specific effects, because all amniotes share the same divergence time. In this case of λ variability among amniotes, lower λ values for Ambystoma-murid rodents indicate an increased rate of genome rearrangement in the murid rodent lineage.
To obtain a more complete picture of genome similarity we calculated pairwise λ values for all possible species comparisons using two different datasets: 1) the set of all genes that showed 1:1 orthology in comparisons between Ambystoma each of the seven reference vertebrate genomes (ranging from N = 170 for chicken-zebrafish to N = 309 for Ambystoma-human), and 2) a smaller set of genes (N = 110) in which 1:1 orthology was established among all species. The cumulative gene set was expected to identify a greater number of associations while the smaller set controlled for comparison-wise differences among the gene sets used to estimate λ. The cumulative gene set yielded slightly lower values of λ than the smaller set. For both gene sets, λ was inversely correlated with phylogenetic distance (Figure 3) [see Additional file 2]. As before, we also observed that λ varied substantially among species with identical divergence times, consistent with lineage specific variation in rearrangement rates. Notably, λ values for the Ambystoma-chicken comparison are higher than or similar to λ values calculated between chicken and mammals, and similar to values calculated between murid rodents and non-rodent mammals, despite differences in divergence time among these comparisons on the order of 60–280 million years (Figure 1) [see Additional file 2]. To better understand the effect of divergence time on variation in λ, we estimated the average rate of decrease in λ [(1-λ)/divergence time)] for all pairwise comparisons. Figure 4 shows that interchromosomal rearrangement rates are strikingly higher in murids and more variable among mammals in comparison to all other vertebrate groups. In contrast, genome rearrangements in non-mammalian vertebrate species appear to accumulate at a similar, lower rate.
Figure 3.

Plot of the λ association index versus the divergence time of vertebrate species. Labels A-F denote comparisons that hinge on the common ancestral nodes shown in Figure 1.
Figure 4.
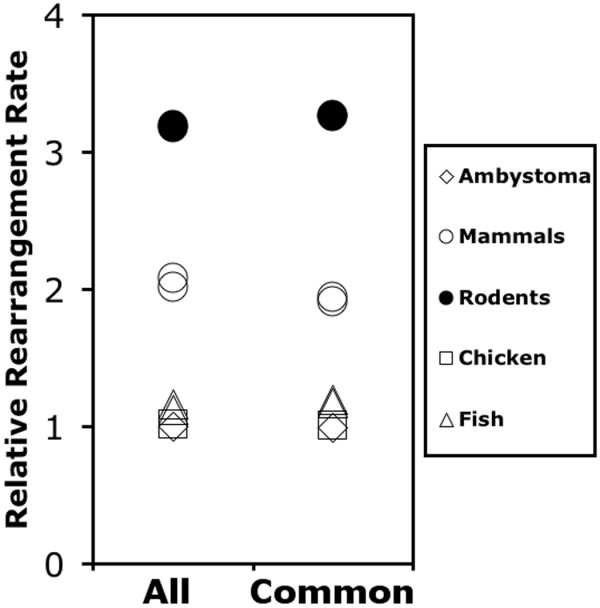
The average rate of decrease in λ for multiple vertebrate species, plotted relative to the Ambystoma rate. Rates are based on the set of all genes that showed 1:1 orthology in comparisons between Ambystoma each of the seven reference vertebrate genomes (All), and a smaller set of genes in which 1:1 orthology was established among all species (Common).
Conservation of segmental homology
We compared the map position of Ambystoma genes to the physical positions of their presumptive orthologs in each of the seven reference genomes. These pair wise comparisons were visualized using oxford plots to show intra-chromosomal positions of orthologies between Ambystoma and each of the reference genomes (Figures 5, 6, 7, 8) [see Additional files 3, 4, 5]. In oxford plots, conserved segmental homologies can be identified as diagonally oriented clusters of points. We compared this visual approach with a statistical approach using the program FISH [26]. The algorithm underlying FISH appears to be somewhat conservative for Ambystoma-amniote comparisons because several clusters that are visually indicative of conserved segments were not identified as such, and several of the significant clusters did not always include orthologies that were very close to cluster margins. At any rate, the majority (57%) of the 334 Ambystoma-amniote orthologs were found within statistically significant, segmental homologies. The proportion of Ambystoma orthologs that were assigned to homologous segments varied greatly among comparative maps (Table 1) [see Additional file 1]. A much higher percentage of Ambystoma-amniote orthologs were found in significant segment homologies than Ambystoma-fish orthologs. For example, the Ambystoma-chicken oxford plot reveals a striking pattern of conservation of gene order (Figure 7). Overall, fewer segmental homologies were identified between Ambystoma and murid rodents vs nonrodent amniotes. However, the number of segmental homology differences among amniotes was small in comparison to the nearly 2-fold difference in λ values observed for Ambystoma-murids vs. Ambystoma-nonrodents (Table 1). Thus, although there has been greater reordering of loci among murid chromosomes during evolution, orders of loci within murid chromosomes are conserved and identifiable in comparisons to Ambystoma.
Figure 5.
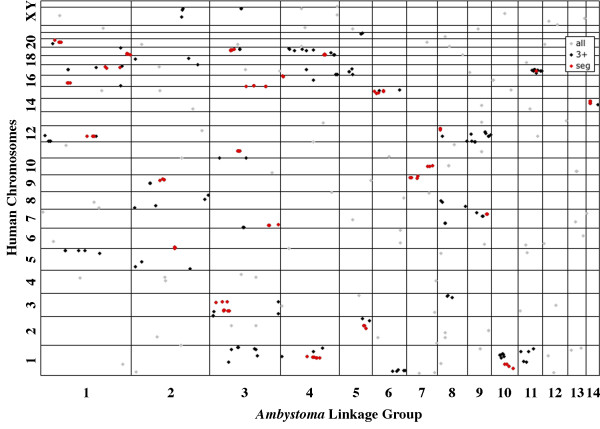
Oxford plot of the positions of presumptive orthologies between Ambystoma linkage groups and human chromosomes. Lines represent the boundaries of chromosomes (horizontal) and linkage groups (vertical). Dots represent the relative position of orthologs within the Ambystoma map. Orthologs that are members of synteny groups of three or more are shown in black. Orthologs that are members of significant (FISH) segmental homologies are shown in red. Some smaller chromosomes are not labeled. All chromosomes are presented ordinally from bottom to top.
Figure 6.

Oxford plot of the positions of presumptive orthologies between Ambystoma linkage groups and mouse chromosomes. See Figure 5 for further details.
Figure 7.
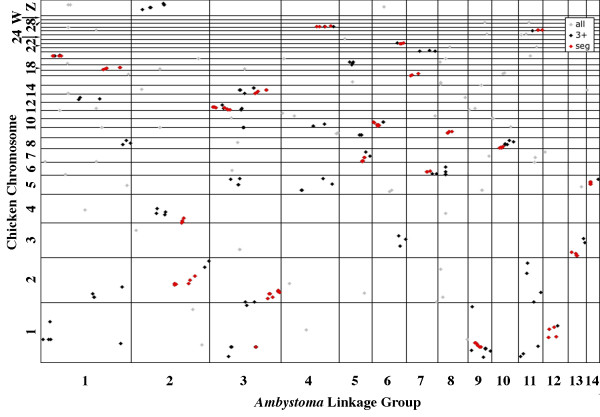
Oxford plot of the positions of presumptive orthologies between Ambystoma linkage groups and chicken chromosomes. The minichromosomes GGA16, 25, 29–31 and 33–38 are not shown; GGA16 contains no mapped Ambystoma orthologs and others are not represented in the genome assembly. See Figure 5 for further details.
Figure 8.
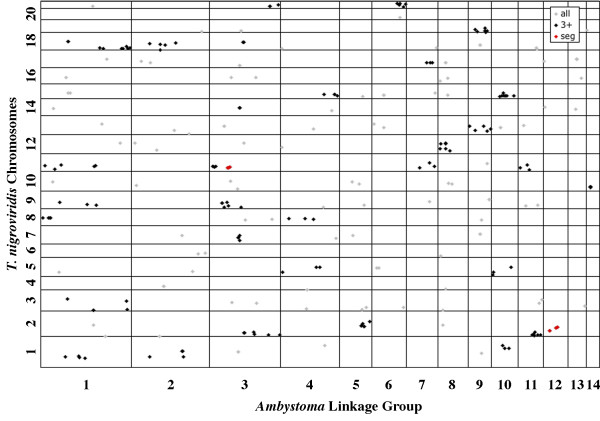
Oxford plot of the positions of presumptive orthologies between Ambystoma linkage groups and Tetraodon nigroviridis chromosomes. See Figure 5 for further details.
Discussion
Amphibians occupy an important, intermediate position in the vertebrate evolutionary tree. Our study is the first to include amphibian gene order data in a taxonomically broad comparison of vertebrate genome structure. Comparisons of genome structure between Ambystoma and representative fish, reptilian, and mammalian species revealed extensive conservation of gene location at the intra- and inter-chromosomal levels. Overall, we identified conserved syntenies and segmental homologies for hundreds of Ambystoma protein-coding sequences [see Additional file 1]. These data provide evidence beyond nucleotide identity that Ambystoma genes are annotated with the correct vertebrate orthology. Information about gene orthology, conserved synteny, and segmental homology will extend Ambystoma as a research model because it will enable development of orthologous probes for comparative molecular studies, and the identification of candidate genes for Ambystoma mutants and QTL.
Our study shows that the Ambystoma Genetic Map can identify conserved syntenies and segmental homologies when compared to any of the primary vertebrate model organism genome assemblies. Overall, we found greater conservation of genome structure between Ambystoma and amniotes, however, many conserved syntenies are identifiable between Ambystoma and fish (T. nigroviridis, zebrafish). We also found that genome rearrangement rates are not simply a function of phylogenetic distance; there are clear differences in inter-chromosomal rearrangement rates, especially within mammals, as well as between mammals and "lower vertebrates". We elaborate on these points below and describe several new insights that amphibians provide concerning vertebrate genome evolution.
Genome conservation between Ambystoma and fish
Fewer presumptive orthologs, conserved syntenies, and segmental homologies were identified between Ambystoma and fish (T. nigroviridis, zebrafish) than between Ambystoma and amniotes. This result is expected because of the deeper divergence time of Ambystoma and fish; in other words, there has been more time for nucleotide substitutions (that make it difficult to identify orthologs) and synteny disruptions to accumulate since the divergence of Ambystoma and fish from a common ancestor. Nevertheless, 57% of Ambystoma orthologs were observed in conserved syntenies with four or more orthologs in at least one fish species, and with the exception of Ambystoma linkage group (LG)13 (which shows strong synteny with GGA3), all Ambystoma linkage groups show discreet regions of synteny with chromosomes of T. nigroviridis and zebrafish. Assuming conservation of gene order during evolution, several regions of conserved synteny between Ambystoma and fish were likely present in the ancestral euteleostean genome. These include: the right hand portion of Ambystoma LG6, which shows extensive synteny with TNI21 and segmental homology with DRE19; and Ambystoma LG10, which shows extensive synteny with TNI15 and DRE20 (Figure 8) [see Additional file 5]. Observation of extensive synteny between Ambystoma and fish is interesting because recent evidence suggests a whole genome duplication predating the common ancestor of T. nigroviridis and zebrafish, followed by differential losses of paralogous loci [e.g. [7,27-29]]. Under such a model of genome evolution, the positions of syntenic Ambystoma genes are expected to map to overlapping positions on different fish chromosomes. We do observe this pattern for Ambystoma-T. nigroviridis orthologs on a few of the smaller Ambystoma linkage groups (e.g. Ambystoma LG9 vs. TNI13 and 19), however this pattern is not as obvious in larger Ambystoma linkage groups, or in comparisons between Ambystoma and zebrafish. The observed patterns appear to be consistent with chromosomal duplications in some instances, but may alternately reflect ancient large-scale rearrangements that have since been shuffled to yield interleaving sets of conserved syntenies. Better reconstruction of the pre-duplicated, ancestral teleost genome is needed to differentiate between these possibilities.
Genome conservation between Ambystoma and amniotes
Results from our study indicate extensive conservation of gene orders between Ambystoma and amniotes, and especially between Ambystoma and chicken. Many of the orthologs identified on the smaller chicken chromosomes exist in nearly exclusive synteny or segmental homology with discreet regions of the Ambystoma genome (Figure 7). This is interesting because of the large difference in chromosome number and genome size between these species. Ambystoma has a much larger genome and haploid complement of 14 chromosomes [20], whereas chicken has a haploid complement of 39 chromosomes [9]. Because an ancestral chromosomal number of 12–14 chromosomes seems most likely for euteleost [7,28-31] tetrapod (Smith, unpublished data), and reptilian ancestors [32], differences between Ambystoma and chicken genomes are largely explained by lineage specific fissions (mostly giving rise to individual chicken microchromosomes) and a moderate number of large rearrangements. The very high number of segmental homologies observed between Ambystoma-chicken suggests they share a large portion of the ancestral tetrapod genome structure. When considering additional segmental homologies identified between Ambystoma and mammals, more than half of the Ambystoma-amniote orthologs that are currently located on the Ambystoma Genetic Map identify segmental homologies within at least one amniote genome, and by extension, the ancestral amniote and tetrapod genomes.
Variation in interchromosomal rearrangement rates
Our study corroborates the idea that mammalian genomes are characterized by higher and more variable rates of genome rearrangement in comparison to other vertebrate groups [e.g. [31,33,34]]. In comparison to mammals, we estimated lower, but similar genome rearrangement rates for Ambystoma, chicken, zebrafish, and T. nigroviridis. Our estimates are consistent with cytogenetic data that indicate extensive conservation of the avian karyotype over approximately 80–100 million years of evolution [35-37], with estimates of genome rearrangement rates between chicken and mammals [34,38], and with comparisons between chicken and reptiles [38]. It is curious to find similar rearrangement rates among non-mammalian vertebrates that differ so greatly in life history and genome structure, and whose genomes have been shaped differently by lineage-specific processes during evolution. Birds, amphibians, and fish have very different generation times, chromosome numbers, and genome sizes. However, our results suggest relatively constant rates of genome rearrangement from the euteleost ancestor to the origin of mammals.
Evolution of human chromosomes
In the remainder of the discussion we provide a few examples to show how Ambystoma provides perspective on the evolution of gene orders within the human genome. In general, Ambystoma comparative mapping data are useful because they help establish ancestral amniote and tetrapod gene orders. The Ambystoma ancestral perspective is needed to identify conserved syntenies and disruptions, and to corroborate evolutionary inferences based only on comparisons between chicken and mammals [9,33,40-43] or only mammals [33,44-46].
Synteny of HSA1 and HSA19 loci in the ancestral amniote and tetrapod genomes
A region of segmental homology between Ambystoma LG4 and GGA28 overlaps regions of segmental homology between Ambystoma LG4 and two human chromosomes, HSA1 and HSA19 (Figure 9). This arrangement suggests that portions of HSA1 and 19 were joined in the ancestral tetrapod and amniote genomes. Fission of this ancestral gene order presumably occurred before the diversification of eutherian mammals (87 MYA) because Ambystoma LG4 orthologies are distributed similarly among the chromosomes of human, mouse, rat, and dog. The overall distribution of conserved syntenies among Ambystoma and amniotes indicates that many Ambystoma LG4 genes were syntenic in the ancestral tetrapod genome.
Figure 9.

Oxford plot of the positions of presumptive orthologies between Ambystoma LG4 and 9, GGA1 and 28, and HSA1, 7, 12, and 19. The distribution of Ambystoma-chicken and Ambystoma-human conserved syntenies suggests that much of the content of Ambystoma LG4 and 9 was present in the ancestral tetrapod genome.
Synteny of HSA7 and HSA12 loci in the ancestral amniote, tetrapod, and euteleost genomes
Regions of synteny and segmental homology between Ambystoma LG9 and GGA1 overlap the positions of syntenic markers located on HSA7 and 12 (Figure 9). This arrangement suggests that loci of HSA7 and 12 were syntenic in the ancestral tetrapod and amniote genomes. As was observed above for Ambystoma LG4, fission of this ancestral gene order presumably occurred before the diversification of eutherian mammals because Ambystoma LG9 orthologies are distributed similarly among the chromosomes of human, mouse, rat, and dog. Because Ambystoma LG9 also shows conserved synteny and segmental homology with much of DRE4, many Ambystoma LG9 genes were apparently syntenic in the euteleost ancestral genome.
Value of multiple species in comparative genomics
Ambystoma LG12 and 13 show extensive conserved synteny and segmental homology with portions of GGA1 and 3, respectively. Apparently, these homologous chromosomal segments have changed little since diversification of the tetrapod lineage, approximately 370 million years ago. However, neither Ambystoma LG12 nor Ambystoma LG13 show substantial conserved synteny or segmental homology with any human chromosome. This suggests the possibility of lineage-specific synteny disruptions in the primate lineage, because Ambystoma LG12 does show conserved synteny with portions of the X-added region of rat and dog [47,48]. This example shows that conserved chromosomal segments may not always be identifiable in the human genome or other mammalian genomes; a multi-species perspective is essential to identify lineage specific effects in comparative vertebrate genomics.
Fissions derived within the mammalian lineage
Several pairs of human chromosomes may have been fused in the ancestral mammalian genome: HSA3/21, 4/8, 10/12, 7/16, 14/15, 16/19, and two regions of 12/22, [33,44-46]. Although our current dataset is insufficient to test all of these hypotheses, the Ambystoma-human oxford plot (Figure 5) suggests that two of these chromosome pairs were fused in the ancestral tetrapod and amniote genomes (Figure 10). Conserved syntenic regions of HSA16 and 19 adjoin each other in the middle of Ambystoma LG3 and at the left end of Ambystoma LG4. Additionally, conserved syntenic regions of HSA7 and HSA16 adjoin each other on the right end of Ambystoma LG3. Our data suggest that some of the chromosomal arrangements that have been proposed for the ancestral mammalian genome may trace back to the ancestral tetrapod genome.
Figure 10.
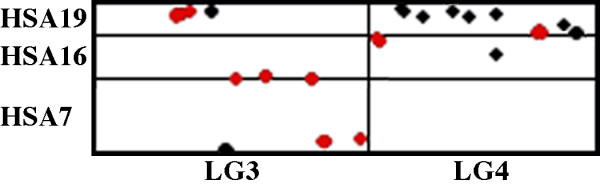
Oxford plot of the positions of presumptive orthologies between Ambystoma LG3 and 4 and HSA7, 16, and 19. The arrangement of Ambystoma-human orthologies suggests that some of the proposed ancestral chromosome arrangements of mammals can be traced back to the ancestral tetrapod genome.
Conclusion
These studies demonstrate the importance of amphibians in revealing key events and trends in vertebrate genome evolution. Measurements of conserved synteny using Ambystoma orthologies suggest relatively constant rates of genome rearrangement from the euteleost ancestor to the origin of mammals. Ambystoma comparative mapping data are also useful in establishing ancestral amniote and tetrapod gene orders and identifying synteny disruptions that have occurred in amniote lineages. More than half of the Ambystoma-amniote orthologs that are currently located on the Ambystoma Genetic Map identify segmental homologies within at least one amniote genome, and by extension, the ancestral amniote and tetrapod genomes. Comparisons between Ambystoma and amniotes also reveal some of the key events that have structured the human genome since diversification of the ancestral amniote lineage.
Methods
Sequence comparisons
Ambystoma orthologs were identified from assembled contigs of the Salamander Genome Project [49-51] and other sequences published in GenBank [see Additional file 6]. These sequences ranged in length from 126 to 6167 bp and presumably correspond to partial and full-length RNA transcripts. A FASTA file of these sequences is included as a supplementary document [see Additional file 7]. Similarity searches and sequence alignments between translated Ambystoma sequences and translated genome sequences were performed using the program BLAT [52]. Alignments were generated between the source sequences for 491 Ambystoma genetic markers [21] and genome assemblies for human, mouse, rat, dog, chicken, zebrafish, and T. nigroviridis. Source sequences for human, mouse, rat, dog, chicken, zebrafish, and T. nigroviridis (respectively: hg17 build 35, mm6 build 34, rn3, canFam1, galGal2, danRer2, tetNig1 V7) were downloaded from the UCSC Genome Browser Gateway [53]. Cumulative bitscores were calculated for alignments between Ambystoma sequence and full genome sequences by summing across presumptive exons. This was accomplished by summing bitscores for otherwise continuous alignments that were interrupted by gaps of 10,000 or fewer bases.
Statistical analysis of conserved synteny
Houseworth and Postlethwait [54] proposed two measures of synteny conservation: ρ and λ. Both of these statistics measure the degree of association between chromosomes (or other segments) from two genomes. The statistic ρ is equivalent to the square of Cramer's V statistic for frequencies of orthologs in a two-way table of chromosomes [54,55]. Cramer's V and ρ are scaled χ2 statistics and as such may not be fully appropriate for measures of association when the average cell frequency within a two-way contingency table is less than 6 [56]. In other words accurate estimation of the χ2 statistic for comparisons between two genomes with 1N = 20 would require at minimum identification of 2400 (20*20*6) orthologies. Furthermore, χ2 based measures of association are not directly comparable between analyses, nor interpretable in a probabilistic sense [e.g. [57-60]].
In terms of pairwise comparisons between genomes, λ provides a measure of the proportional increase in ability to predict the chromosomal assignment of an ortholog in either of two species (or in probabilistic terms, "the relative decrease in probability of erroneous guessing"; [60], when the ortholog's position is known in the other species, vs. when it is unknown) [60]. The value of λ ranges from 0 to 1, with a value of λ = 0 representing the case where knowledge of the positions of orthologous loci in either species is completely uninformative in predicting the location of orthologs in the other, and a value of λ = 1 representing the case where knowledge of the positions of orthologous loci in either species can be used to exactly predict the location of all orthologs in the other. Values of ρ and λ were highly similar among our analyses. For simplicity and ease of interpretation, and because the λ statistic is seemingly more appropriate for the question at hand, we therefore report only values for λ with approximate 95% confidence estimated using the methods of Goodman and Kruskal [61].
Statistical analysis of segmental homology
Segmental homologies were identified by comparing the positions of orthologs between the Ambystoma genetic map and the reference genomes for human, mouse, rat, dog, chicken, zebrafish, and T. nigroviridis. The Ambystoma map and reference genomes were formatted as concatenated (across linkage groups or chromosomes) series of orthologs and input into the program FISH [26]. In effect, FISH identifies segmental homologies by comparing the distribution of points on an oxford plot to the expected null distribution for an equal number of randomly scattered points. Concatenating chromosomes of multichromosomal genomes permits correct calculation of the null distribution of orthologies by FISH. However, one potential caveat of using concatenated genomes is that the analysis does not take into account the position of chromosomal boundaries. The possibility therefore exists that clusters or orthologies that cross the boundaries of chromosomes or linkage groups will be identified as segmental homologies. Because these putative clusters involve artificially generated segments, they likely represent spurious segmental homologies. To check for this possibility, the locations of all identified segmental homologies were examined manually. A single segmental homology in the Ambystoma-mouse comparison was observed that crossed a boundary. This homology was removed from subsequent analyses. We note that boundary-crossing clusters might alternately represent fission breakpoints that were placed (by chance) adjacent to one another in the concatenated genome. We intend to explore this possibility in future work.
Abbreviations
LG – linkage group
Authors' contributions
JJS and SRV conceived of the study and prepared the manuscript. JJS performed statistical analyses.
Supplementary Material
Summary statistics for Ambystoma-vertebrate genome alignments. This table provides alignment start and end positions and bitscore values for alignments between mapped Ambystoma sequences and genome assemblies for human, mouse, rat, dog, chicken, zebrafish, and T. nigroviridis.
Values of the λ association index for comparisons among all eight representative vertebrate species. This table provides values of the λ association index and 95% confidence intervals for all pairwise comparisons among Ambystoma, human, mouse, rat, dog, chicken, zebrafish, and T. nigroviridis.
Oxford plot of the positions of presumptive orthologies between Ambystoma linkage groups and rat chromosomes. This plot shows the relative position of orthologies in the Ambystoma (X-axis) and rat (Y-axis) genomes. See Figure 5 for further details.
Oxford plot of the positions of presumptive orthologies between Ambystoma linkage groups and dog chromosomes. This plot shows the relative position of orthologies in the Ambystoma (X-axis) and dog (Y-axis) genomes. See Figure 5 for further details.
Oxford plot of the positions of presumptive orthologies between Ambystoma linkage groups and zebrafish chromosomes. This plot shows the relative position of orthologies in the Ambystoma (X-axis) and zebrafish (Y-axis) genomes. See Figure 5 for further details.
FASTA identifiers, species, and GenBank GIs that are associated with Ambystoma markers. This table provides GenBank and species identifiers for all of the Ambystoma markers that were used in this study.
A FASTA file of Ambystoma sequence that were used in this study. This FASTA formatted file provides all of the Ambystoma sequences that were used to generate alignments in this study.
Acknowledgments
Acknowledgements
This project was supported by the Kentucky Spinal Cord Injury Research Trust and Grant Number 5-R24-RR016344-06 from the National Center for Research Resources (NCRR), a component of the National Institutes of Health (NIH). Its contents are solely the responsibility of the authors and do not necessarily represent the official views of NCRR or NIH. The project was also supported by a National Science Foundation (NSF) CAREER Award (IBN-0242833; IBN-0080112). This project also utilized resources and facilities provided by the Kentucky Bioinformatics Research Infrastructure Network, the Spinal Cord and Brain Injury Research Center, and the NSF supported Ambystoma Genetic Stock Center (DBI-0443496).
Contributor Information
Jeramiah J Smith, Email: jjsmit3@uky.edu.
S Randal Voss, Email: srvoss@uky.edu.
References
- Gardiner DM, Torok MA, Mullen LM, Bryant SV. Evolution of vertebrate limbs: Robust morphology and flexible development. Am Zool. 1998;38:659–671. [Google Scholar]
- Simon H-G. T-box genes and the formation of vertebrate forelimb- and hindlimb specific pattern. Cell Tissue Res. 1999;296:57–66. doi: 10.1007/s004410051266. [DOI] [PubMed] [Google Scholar]
- Hinchliffe JR. Developmental basis of limb evolution. Int J Dev Biol. 2002;46:835–845. [PubMed] [Google Scholar]
- Shubin NH. Origin of evolutionary novelty: Examples from limbs. J Morphol. 2002;252:15–28. doi: 10.1002/jmor.10017. [DOI] [PubMed] [Google Scholar]
- International Human Genome Sequencing Consortium (IHGSC) initial sequencing and analysis of the human genome. Nature. 2001;409:860–921. doi: 10.1038/35057062. [DOI] [PubMed] [Google Scholar]
- Mouse Genome Sequencing Consortium (MGSC) Initial sequencing and comparative analysis of the mouse genome. Nature. 2002;420:520–562. doi: 10.1038/nature01262. [DOI] [PubMed] [Google Scholar]
- Jaillon O, Aury JM, Brunet F, Petit J-L, Stange-Thomann N, Mauceli E, Bouneau L, Fischer C, Ozouf-Costaz C, Bernot A, et al. Genome duplication in the teleost fish Tetraodon nigroviridis reveals the early vertebrate proto-karyotype. Nature. 2004;431:946–957. doi: 10.1038/nature03025. [DOI] [PubMed] [Google Scholar]
- Rat Genome Secuencing Project Consortium (RGSPC) Genome sequence of the Brown Norway Rat yields insights into mammalian evolution. Nature. 2004;428:493–521. doi: 10.1038/nature02426. [DOI] [PubMed] [Google Scholar]
- International Chicken Genome Sequencing Consortium (ICGSC) Sequence and comparative analysis of the chicken genome provide unique perspectives on vertebrate evolution. Nature. 2005;432:695–716. doi: 10.1038/nature03154. [DOI] [PubMed] [Google Scholar]
- Goss SJ, Harris H. New method for mapping genes in human chromosomes. Nature. 1975;255:680–684. doi: 10.1038/255680a0. [DOI] [PubMed] [Google Scholar]
- Cox DR, Burmeister M, Price ER, Kim S, Myers RM. Radiation hybrid mapping: a somatic cell genetic method for constructing high resolution maps of mammalian chromosomes. Science. 1990;250:245–250. doi: 10.1126/science.2218528. [DOI] [PubMed] [Google Scholar]
- Kwok C, Korn RM, Davis ME, Burt DW, Critcher R, McCarthy L, Paw BH, Zon LI, Goodfellow PN, Schmitt K. Characterization of whole genome radiation hybrid mapping resources for non-mammalian vertebrates. Nucleic Acids Res. 1998;26:3562–3566. doi: 10.1093/nar/26.15.3562. [DOI] [PMC free article] [PubMed] [Google Scholar]
- Wardrop J, Snape J, Powell W, Machray GC. Constructing plant radiation hybrid panels. Plant J. 2002;31:223–228. doi: 10.1046/j.1365-313x.2002.01351.x. [DOI] [PubMed] [Google Scholar]
- Gall JG, Pardue ML. Formation and detection of RNA-DNA hybrid molecules in cytological preparations. Proc Natl Acad Sci U S A. 1969;63:378–383. doi: 10.1073/pnas.63.2.378. [DOI] [PMC free article] [PubMed] [Google Scholar]
- John HA, Birnstiel ML, Jones KW. RNA-DNA hybrids at the cytological level. Nature. 1969;223:582–587. doi: 10.1038/223582a0. [DOI] [PubMed] [Google Scholar]
- Trask B, Pinkel D, van den Engh G. The proximity of DNA sequences in interphase cell nuclei is correlated to genomic distance and permits ordering of cosmids spanning 250 kilobase pairs. Genomics. 1989;5:710–717. doi: 10.1016/0888-7543(89)90112-2. [DOI] [PubMed] [Google Scholar]
- Heng HHQ, Squire J, Tsui L-C. High-resolution mapping of mammalian genes by in situ hybridization to free chromatin. Proc Natl Acad Sci U S A. 1992;89:9509–9513. doi: 10.1073/pnas.89.20.9509. [DOI] [PMC free article] [PubMed] [Google Scholar]
- Ott J. Analysis of Human Genetic Linkage. 3. Baltimore: Johns Hopkins University Press; 1991. [Google Scholar]
- Morescalchi A. Chromosome evolution in the caudate Amphibia. Evol Biol. 1975;8:339–387. [Google Scholar]
- Licht LE, Lowcock LA. Genome size and metabolic-rate in salamanders. Comp Biochem Physiol B Biochem Mol Biol. 1991;100:83–92. [Google Scholar]
- Smith JJ, Kump DK, Walker JA, Parichy DM, Voss SR. A comprehensive expressed sequence tag linkage map for tiger salamander and Mexican axolotl: enabling gene mapping and comparative genomics in Ambystoma. Genetics. 2005;171:1161–1171. doi: 10.1534/genetics.105.046433. [DOI] [PMC free article] [PubMed] [Google Scholar]
- Voss SR, Smith JJ, Gardiner DM, Parichy DM. Conserved vertebrate chromosome segments in the large salamander genome. Genetics. 2001;158:735–746. doi: 10.1093/genetics/158.2.735. [DOI] [PMC free article] [PubMed] [Google Scholar]
- Ohta Y, Goetz W, Hossain MZ, Nonaka M, Flajnik MF. Ancestral organization if the MHC revealed in the amphibian Xenopus. J Immunol. 2006;176:3674–3685. doi: 10.4049/jimmunol.176.6.3674. [DOI] [PubMed] [Google Scholar]
- Genetic Map of Xenopus tropicalis http://tropmap.biology.uh.edu
- Homo sapiens Genome: Statistics – Build 35 version 1 http://www.ncbi.nih.gov/mapview/stats/BuildStats.cgi?taxid=9606&build=36&ver=1
- Calabrese PP, Chakravarty S, Vision TJ. Fast identification and statistical evaluation of segmental homologies in comparative maps. Bioinformatics. 2003;19:i74–i80. doi: 10.1093/bioinformatics/btg1008. [DOI] [PubMed] [Google Scholar]
- Bernot AE, Weissenbach JE. Estimation of the extent of synteny between Tetraodon nigroviridis and Homo sapiens genomes. J Mol Evol. 2004;59:556–569. doi: 10.1007/s00239-004-2649-0. [DOI] [PubMed] [Google Scholar]
- Naruse K, Tanaka M, Mita K, Shima A, Postlethwait J, Mitani H. A medaka gene map: the trace of ancestral vertebrate proto-chromosomes revealed by comparative gene mapping. Genome Res. 2004;14:820–828. doi: 10.1101/gr.2004004. [DOI] [PMC free article] [PubMed] [Google Scholar]
- Woods IG, Wilson C, Friedlander B, Chang P, Reyes DK, Nix R, Kelly PD, Chu F, Postlethwait JH, Talbot WS. The zebrafish gene map defined ancestral vertebrate chromosomes. Genome Res. 2005;15:1307–1314. doi: 10.1101/gr.4134305. [DOI] [PMC free article] [PubMed] [Google Scholar]
- Postlethwait JH, Woods IG, Ngo-Hazelette P, Yan Y-L, Kelly PD, Chu F, Huang H, Hill-Force A, Talbot WS. Zebrafish comparative genomics and the origins of vertebrate chromosomes. Genome Res. 2000;10:1890–1902. doi: 10.1101/gr.164800. [DOI] [PubMed] [Google Scholar]
- Kohn M, Hogel J, Vogel W, Minich P, Kehrer-Sawatzki , Graves JAM, Hameister H. Reconstruction of a 450-MY-old ancestral vertebrate protokaryotype. Trends Genet. 2006;22:203–210. doi: 10.1016/j.tig.2006.02.008. [DOI] [PubMed] [Google Scholar]
- Norris TB, Rickards GK, Daugherty CH. Chromosomes of the tuatara, Sphenodon, a chromosome heteromorphism and an archaic reptilian karyotype. Cytogenet Genome Res. 2004;105:93–99. doi: 10.1159/000078014. [DOI] [PubMed] [Google Scholar]
- Bourque G, Pevzner PA, Tesler G. Reconstructing the genomic architecture of ancestral mammals: Lesions from human, mouse, and rat genomes. Genome Res. 2004;14:507–516. doi: 10.1101/gr.1975204. [DOI] [PMC free article] [PubMed] [Google Scholar]
- Bourque G, Zdobnov EM, Bork P, Pevzner PA, Tesler G. Comparative architectures of mammalian and chicken genomes reveal highly variable rates of genomic rearrangements across different lineages. Genome Res. 2005;15:98–110. doi: 10.1101/gr.3002305. [DOI] [PMC free article] [PubMed] [Google Scholar]
- Ohno S. Sex chromosomes and sex-linked genes. In: Labhart A, Mann T, Samuels LT, editor. Monographs on Endocrinology. Vol. 1. New York: Springer; 1967. [Google Scholar]
- de Boer LEM. Do the chromosomes of the kiwi provide evidence for a monophyletic origin of the ratites? Nature. 1980;287:84–85. doi: 10.1038/287084a0. [DOI] [PubMed] [Google Scholar]
- Shetty S, Griffin DK, Graves JAM. Comparative painting reveals strong chromosome homology over 80 million years of bird evolution. Chromosome Res. 1999;7:289–295. doi: 10.1023/a:1009278914829. [DOI] [PubMed] [Google Scholar]
- Burt DW, Bruley C, Dunn IC, Jones CT, Ramage A, Law AS, Morrice DR, Paton IR, Smith J, Windsor D, et al. The dynamics of chromosome evolution in birds and mammals. Nature. 1999;402:411–413. doi: 10.1038/46555. [DOI] [PubMed] [Google Scholar]
- Matsuda Y, Nishida-Umehara C, Tarui H, Kuroiwa A, Yamada K, Isobe T, Ando J, Fujiwara A, Hirao Y, Nishimura O, et al. Highly conserved linkage homology between birds and turtles: bird and turtle chromosomes are precise counterparts of each other. Chromosome Res. 2005;13:601–615. doi: 10.1007/s10577-005-0986-5. [DOI] [PubMed] [Google Scholar]
- Nanda I, Shan Z, Schartl M, Burt DW, Koehler M, Nothwang H, Grutzner F, Paton IR, Windsor D, Dunn I, et al. 300 million years of conserved synteny between chicken Z and human chromosome 9. Nat Genet. 1999;21:258–259. doi: 10.1038/6769. [DOI] [PubMed] [Google Scholar]
- Schmid M, Nanda I, Guttenbach M, Steinlein C, Hoehn H, Schartl M, Haaf T, Weigend S, Fries R, Buerstedde J-M, et al. First report on chicken genes and chromosomes 2000. Cytogenet Cell Genet. 2000;90:169–218. doi: 10.1159/000056772. [DOI] [PubMed] [Google Scholar]
- Nanda I, Haaf T, Schartl M, Schmid M, Burt DW. Comparative mapping of Z-orthologous genes in vertebrates: implications for the evolution of avian sex chromosomes. Cytogenet Genome Res. 2002;99:178–184. doi: 10.1159/000071591. [DOI] [PubMed] [Google Scholar]
- Schmid M, Nanda I, Hoehn H, Schartl M, Haaf T, Buerstedde J-M, Arakawa H, Caldwell RB, Weigend S, Burt DW, et al. Second report on chicken genes and chromosomes 2005. Cytogenet Genome Res. 2005;109:415–479. doi: 10.1159/000084205. [DOI] [PubMed] [Google Scholar]
- Murphy WJ, Bourque G, Tesler G, Pevzner P, O'Brien SJ. Reconstructing the genomic architecture of mammalian ancestors using multispecies comparative maps. Human Genome. 2003;1:30–40. doi: 10.1186/1479-7364-1-1-30. [DOI] [PMC free article] [PubMed] [Google Scholar]
- Richard F, Lombard M, Dutrillaux B. Reconstruction of the ancestral karyotype of eutherian mammals. Chromosome Res. 2003;11:605–618. doi: 10.1023/a:1024957002755. [DOI] [PubMed] [Google Scholar]
- Yang F, Alkalaeva EZ, Perelman PL, Pardini AT, Harrison WR, O'Brien PCM, Fu B, Graphodatsky AS, Ferguson-Smith MA, Robinson TJ. Reciprocal chromosome painting among human, aardvark, and elephant (superorder Afrotheria) reveals the likely eutherian ancestral karyotype. Proc Natl Acad Sci U S A. 2003;100:1062–1066. doi: 10.1073/pnas.0335540100. [DOI] [PMC free article] [PubMed] [Google Scholar]
- Graves JAM. The origin and function of the mammalian Y-chromosome and Y-borne genes – an evolving understanding. Bioessays. 1995;17:311–320. doi: 10.1002/bies.950170407. [DOI] [PubMed] [Google Scholar]
- Ross MT, Grafham DV, Coffey AJ, Scherer S, McLay K, Muzny D, Platzer M, Howell GR, Burrows C, Bird CP, et al. The DNA sequence of the human X chromosome. Nature. 2005;434:325–337. doi: 10.1038/nature03440. [DOI] [PMC free article] [PubMed] [Google Scholar]
- Putta S, Smith JJ, Walker J, Rondet M, Weisrock DW, Monaghan J, Samuels AK, Kump K, King DC, Maness NJ, et al. From biomedicine to natural history research: EST resources for ambystomatid salamanders. BMC Genomics. 2004;5:54. doi: 10.1186/1471-2164-5-54. [DOI] [PMC free article] [PubMed] [Google Scholar]
- Smith JJ, Putta S, Walker JA, Kump DK, Samuels AK, Monaghan JR, Weisrock DW, Staben C, Voss SR. Sal-Site: Integrating new and existing ambystomatid salamander research and informational resources. BMC Genomics. 2005;6:181. doi: 10.1186/1471-2164-6-181. [DOI] [PMC free article] [PubMed] [Google Scholar]
- Sal-Site http://www.ambystoma.org
- Kent WJ. BLAT – The BLAST-like alignment tool. Genome Res. 2002;12:656–664. doi: 10.1101/gr.229202. [DOI] [PMC free article] [PubMed] [Google Scholar]
- UCSC Genome Browser Gateway http://genome.ucsc.edu/cgi-bin/hgGateway
- Housworth EA, Postlethwait J. Measures of synteny conservation between species pairs. Genetics. 2002;162:441–448. doi: 10.1093/genetics/162.1.441. [DOI] [PMC free article] [PubMed] [Google Scholar]
- Cramer H. Mathematical Methods of Statistics. Princeton: Princeton University Press; 1946. [Google Scholar]
- Roscoe JT, Byars JA. An investigation of the restraints with respect to sample size commonly imposed on the use of the chi-square statistic. J Am Stat Assoc. 1971;66:755–759. [Google Scholar]
- Fisher RA. Statistical Methods for Research Workers. Oliver and Boyd, Edinburgh; 1938. [Google Scholar]
- Blalock HM., Jr Probabilistic interpretations for the mean square contingency. J Am Stat Assoc. 1958;53:102–105. [Google Scholar]
- Goodman LA, Kruskal WH. Measures of association for cross classifications. J Am Stat Assoc. 1954;49:732–764. [Google Scholar]
- Kendall MG, Stuart A. The Advances Theory of Statistics: inference and relationship. Vol. 2. New York: Hafner Publishing Company; 1967. [Google Scholar]
- Goodman LA, Kruskal WH. Measures of association for cross classifications III: approximate sampling theory. J Am Stat Assoc. 1963;58:310–364. [Google Scholar]
- Kumar S, Hedges B. A molecular timescale for vertebrate evolution. Nature. 1998;392:917–920. doi: 10.1038/31927. [DOI] [PubMed] [Google Scholar]
- Ruta M, Coates MI, Quicke DJ. Early tetrapod relationships revisited. Biol Rev Camb Philos Soc. 2003;78:251–345. doi: 10.1017/s1464793102006103. [DOI] [PubMed] [Google Scholar]
- Hedges SB, Kumar S. Precision of molecular time estimates. Trends Genet. 2004;20:242–247. doi: 10.1016/j.tig.2004.03.004. [DOI] [PubMed] [Google Scholar]
- Riesz RR, Muller J. Molecular timescales and the fossil record: a paleontological perspective. Trends Genet. 2004;20:237–241. doi: 10.1016/j.tig.2004.03.007. [DOI] [PubMed] [Google Scholar]
- Springer MS, Murphy WJ, Eizirik E, O'Brien SJ. Placental mammal diversification and the Cretaceous-Tertiary boundary. Proc Natl Acad Sci U S A. 2003;100:1056–1061. doi: 10.1073/pnas.0334222100. [DOI] [PMC free article] [PubMed] [Google Scholar]
- Nelson JS. Fishes of the world. 3. New York: John Wiley; 1994. [Google Scholar]
- Wittbrodt J, Shima A, Schartl M. Medaka: a model organism from the Far East. Nat Rev Genet. 2002;3:53–64. doi: 10.1038/nrg704. [DOI] [PubMed] [Google Scholar]
Associated Data
This section collects any data citations, data availability statements, or supplementary materials included in this article.
Supplementary Materials
Summary statistics for Ambystoma-vertebrate genome alignments. This table provides alignment start and end positions and bitscore values for alignments between mapped Ambystoma sequences and genome assemblies for human, mouse, rat, dog, chicken, zebrafish, and T. nigroviridis.
Values of the λ association index for comparisons among all eight representative vertebrate species. This table provides values of the λ association index and 95% confidence intervals for all pairwise comparisons among Ambystoma, human, mouse, rat, dog, chicken, zebrafish, and T. nigroviridis.
Oxford plot of the positions of presumptive orthologies between Ambystoma linkage groups and rat chromosomes. This plot shows the relative position of orthologies in the Ambystoma (X-axis) and rat (Y-axis) genomes. See Figure 5 for further details.
Oxford plot of the positions of presumptive orthologies between Ambystoma linkage groups and dog chromosomes. This plot shows the relative position of orthologies in the Ambystoma (X-axis) and dog (Y-axis) genomes. See Figure 5 for further details.
Oxford plot of the positions of presumptive orthologies between Ambystoma linkage groups and zebrafish chromosomes. This plot shows the relative position of orthologies in the Ambystoma (X-axis) and zebrafish (Y-axis) genomes. See Figure 5 for further details.
FASTA identifiers, species, and GenBank GIs that are associated with Ambystoma markers. This table provides GenBank and species identifiers for all of the Ambystoma markers that were used in this study.
A FASTA file of Ambystoma sequence that were used in this study. This FASTA formatted file provides all of the Ambystoma sequences that were used to generate alignments in this study.