

Abstract
The well studied trade-off between offspring size and offspring number assumes that offspring fitness increases with increasing per-offspring investment. Where mothers differ genetically or exhibit plastic variation in reproductive effort, there can be variation in per capita investment in offspring, and via this trade-off, variation in fecundity. Variation in per capita investment will affect juvenile performance directly—a classical maternal effect—while variation in fecundity will also affect offspring performance by altering the offsprings' competitive environment. The importance of this trade-off, while a focus of evolutionary research, is not often considered in discussions about population dynamics. Here, we use a factorial experiment to determine what proportion of variation in offspring performance can be ascribed to maternal effects and what proportion to the competitive environment linked to the size–number trade-off. Our results suggest that classical maternal effects are significant, but that in our system, the competitive environment, which is linked to maternal environments by fecundity, can be a far more substantial influence.
Keywords: Sancasania berlesei, maternal effects, size–number trade-off, delayed life history effect
1. Introduction
The trade-off between offspring quality or size and offspring number forms the cornerstone of a great deal of research in evolutionary ecology (Smith & Fretwell 1974; Stearns 1992; Roff 2002). Driven by empirical and theoretical knowledge that offspring fitness often increases with increasing maternal investment (Messina & Fox 2001) and that maternal fitness may be maximized by minimizing per-offspring investment (Shertzer & Ellner 2002), this trade-off is strongly linked to maternal effects. A broad definition of maternal effects is now well established, such that maternal genotype, phenotype, and environment interact with offspring phenotype and environment to determine offspring performance (Rossiter 1991, 1996, 1998; Bernardo 1996; Mousseau & Fox 1998b). The presence of phenotypic plasticity in mothers (maternal genotype×maternal environment) can allow the maternal environment to influence substantially the reproductive investment mothers make. Moreover, this interaction can indirectly influence offspring performance by virtue of the trade-off between per-capita investment and fecundity. Because this trade-off specifies an inverse relationship between quality or size of offspring and number of offspring, variation in the maternal environment that drives differential investment will, in populations with limited juvenile dispersal, also drive variation in the competitive environment that offspring face upon birth.
The importance of this trade-off has long been recognized in evolutionary ecology and has also emerged as an important factor in population dynamics research. Recent theoretical and empirical studies suggest that intrinsic, delayed, density-dependent processes (such as created by maternal effects) may be a substantial source of variation in population dynamics by introducing a lag into the dynamics (Ginzburg & Taneyhill 1994; Rossiter 1994; Bjornstad et al. 1998; Ginzburg 1998; Inchausti & Ginzburg 1998; Stenseth et al. 1999; Benton et al. 2001; Coulson et al. 2001; Dennis et al. 2001; Beckerman et al. 2003). In the case of a lag introduced by maternal effects, offspring performance is influenced by past environments through changes in investment patterns by mothers: either directly through changing the per capita investment in the offspring, or the associated change in fecundity changing the offspring's competitive environment.
Maternal effects have been the subject of considerable interest in population dynamics studies, partly because of the potential to explain patterns such as cycles. One approach to investigate the maternal link to dynamics has been to take individuals from different populations and rear them under different conditions and look for evidence of historical influences on life history (e.g. Myers et al. 1998; Ergon et al. 2001). While such an approach is appropriate for determining the effect of maternal environment on offspring performance through the classical maternal effect of changing offspring quality, it is inappropriate for detecting influences created by changing maternal fecundity and, therefore, competition in the juvenile environment.
The question we aim to address is whether offspring performance is more affected by per capita investment or variation in the competitive environment created by offspring number? If we examine variation in offspring performance, what proportion of this variation can be ascribed to maternal effects per se (direct per capita investment) and what proportion to the indirect consequences of the competitive environment linked to the size-number trade-off? To this end, we executed a factorial experiment with a soil mite system that systematically altered the maternal environment and the offspring environment. Our design builds on previous work that established that there is a size–number trade-off in the mites, with a mother's position on the trade-off linked to per capita food supply and age (Plaistow et al. 2004; Benton et al. 2005). The design allowed us to decompose statistically the relative contribution of maternal effects and offspring competitive environment effects on offspring performance.
We employ generalized linear modelling coupled with regression tree analyses to visualize the pattern of variation explained by the combination of factors in our experiment. With this mixture of techniques we quantify the proportion of variance attributed to maternal effects and competitive environment in four offspring traits and use the regression trees to highlight graphically the types of maternal and offspring conditions that may lead to strong or weak contributions of maternal effects.
2. Material and Methods
The details of the experimental design are available in Beckerman et al. (2003), see also figure 1. Here, we provide a short summary and protocol for our statistical analyses that partition variance associated with maternal effects and competitive environment.
Figure 1.

Schematic highlighting the structure of our experimental design spanning nearly two generations. Treatments begin with maternal rearing conditions, progress through three treatments at the adult stage (time and amount of food and density) and two time periods of egg collection (all above dashed line). Following hatching (below dashed line), juveniles are exposed to a range of densities and manipulated variation in the timing and amount of food. See text and Beckerman et al. (2003).
(a) The mites
The life cycle of Sancasania berlesei consists of five stages: eggs, larvae, protonymph, tritonymph and adult. Stock cultures have been maintained in unlit incubators at 24 °C since 1995. Experimental mite populations were maintained in glass tubes (20×50 mm2) filled with plaster of Paris that is kept moist to maintain humidity and also kept at a constant 24 °C in unlit incubators. Food was supplied in the form of granulated yeast (for a review of the model system, see Benton & Beckerman 2005). The experiment was conducted in March 2000.
(b) Experimental design
Our baseline data are collected from a longitudinal laboratory experiment that covers nearly two generations (see Beckerman et al. 2003 and figure 1 for more design details). To begin the experiment, eggs from second-generation mothers, reared from stock cultures, were assigned to good or bad parental rearing conditions. Upon reaching maturity, males and females were paired randomly at 1, 20 or 50 pairs (parental densities) and then assigned randomly to low- or high-food amounts (parental food) and either immediate delivery of food or a 5 day delay in food delivery (parental food timings). Eggs were then collected from mothers when they were young or old (day 4/5 versus 9/10; maternal age of eggs). When these offspring hatched, they were subject to the range of juvenile densities that they were born into, and subsequently assigned randomly to high- and low-food amounts (juvenile food amounts), either in a single initial pulse or over the duration of their development (juvenile food timings). Figure 1 provides insight into the structure of the design. In total, the design is 2×3×2×2×2×4 factorial with juvenile density as a covariate, and two replicates per treatment combination, leading to 192 tubes in total on which measurements were made (see Appendix 1 in Beckerman et al. 2003).
We measured four vital traits of offspring in this experiment: time-to-hatching of eggs, percentage of offspring recruiting, age-at-maturity and size-at-maturity. Time-to-hatching and age-at-maturity were measured by keeping daily counts of either the eggs becoming juveniles (time-to-hatching) or the juveniles becoming adults (age-at-maturity), and recording the numbers of events on given days. Percent recruitment was measured by comparing the initial maximum juvenile density to the final number of adults that emerged in a treatment. Size-at-maturity data was collected on a subset of individuals maturing in a range of treatments. Mites were counted and measured using a Leica MZ7.5 binocular microscope with a ocular graticule.
(c) Statistical analysis
Our approach was to fit generalized linear models to the demographic traits we measured (egg hatching time, percent recruitment, age-at-maturity or size-at-maturity). Apart from hatching date, we fitted models incorporating both descriptors of the juvenile environment and descriptors of the adult environment. In particular, we developed the following standard statistical model for percent recruitment, age-at-maturity, and size-at-maturity
| 2.1 |
DV corresponds to the dependent variable. The first part of the model, (parental rearing+parental density+parental food delay+parental food+parental age)2 represents all maternal (parental) environment characteristics and their pairwise interactions. The second part of the model (juvenile density×juvenile food), represents the juvenile environmental characteristics and their interaction. Juvenile density was the maximum juvenile density and, therefore, describes the offspring competitive environment controlling for parental environment effect on offspring number. Note that we have collapsed the timing and amount of juvenile food into a single four level variable.
We first fit this model with only the juvenile environmental terms and report the amount of variance it explains, corresponding to the effects of the juvenile environment on offspring performance. We then add the range of maternal environment characteristics and report whether and how much more variance is explained by this new model. Suitable distributions and modelling techniques were used for each variable: binomial regression for percentage recruiting and survival analysis for hatching date and age-at-maturity. All analyses use log-transformed juvenile density to create a linear relationship between the dependent variables and juvenile density, except for the size-at-maturity which did not require this transformation. We used mean size of mites within treatment replicates for the size analyses. Median age-at-maturity was used as a covariate in our analysis of percent recruitment. Size-at-maturity was used as a covariate in our analysis of percent recruitment. We used an accelerated failure time model (Fox 2000), with a Weibull distribution for survival analysis (the Weibull distribution was chosen through censored residual diagnostics as per Harrell (2001)). We employed backwards, stepwise regression based on AIC statistics followed by further model simplification based on p-values to identify the minimum adequate model (Crawley 1993, 2002; Venables & Ripley 1999).
For each of these analyses, we also present a regression tree built from the predicted values of each statistical model (Harrell 2001). This technique highlights visually under what conditions maternal effects might be important to offspring performance. Regression trees describe the structure of data by iteratively splitting the data (model predictions in our case) into homogenous groups defined by the factors and covariates in an experiment (Venables & Ripley 1999; Therneau & Atkinson 2005). It is, therefore, possible to ‘prune’ a tree to an R2 of 95% to classify the structure of our predicted responses based on the set of experimental treatments. Used this way, a regression tree is a strategy for visualizing the way that variance in the predictions can be apportioned to different factors and covariates.
Analyses were conducted in R (R Development Core Team 2005) including the libraries Hmisc, Design (Harrell 2005), MASS (Venables & Ripley 2002), and rpart (Therneau & Atkinson 2005).
3. Results
(a) Time to hatching
Systematic variation in time to hatching is only attributable to maternal environmental conditions as juvenile density and food do not affect this trait. Our analysis indicated that there were substantial changes in hatching time attributable to differences in maternal environmental conditions (figure 2). The minimum adequate model possessed nine significant two-way interactions (table 1a; all 8<χ2<2140, all p<0.003). Interactions featuring parental rearing conditions and current adult conditions explained a substantial amount of hatch time variability. The parental treatments in our experiment explain 77% of the deviance in time to hatching (model log likelihood=−997.6; intercept only log likelihood=−4333.7).
Figure 2.

Maternal environmental conditions influence offspring hatching date. Curves are fitted survival functions from the accelerated failure time model. Hatching date is not influenced by egg density, so it is an indicator of maternal effects only. Panels (a) and (b) show the effects of parental rearing (good versus poor) under (a) high and (b) low parental food amounts. Rearing conditions matter only when parental food conditions were poor. (c) Moreover, parental food amounts (high versus low) only mattered when mothers were young. (d) Under these conditions, low amounts of food reduced hatching dates compared to no effect when mothers were old.
Table 1.
Statistical models for time to hatching (survival model), percent recruitment (binomial glm), age-at-maturity (survival model) and size-at-maturity (general linear model).
| factor (model) | d.f. | LRT | p (χ2) |
|---|---|---|---|
| (a) time to hatching | |||
| rearing : adult density | 2 | 112 | <0.001 |
| rearing : adult feeding delay | 1 | 186 | <0.001 |
| rearing : adult food | 1 | 895 | <0.001 |
| rearing : maternal age | 1 | 8 | 0.005 |
| adult density : adult feeding delay | 2 | 124 | <0.001 |
| adult density : adult food | 2 | 661 | <0.001 |
| adult : maternal age | 2 | 17 | <0.001 |
| adult : delay : age | 1 | 362 | <0.001 |
| adult food : maternal age | 1 | 2052 | <0.001 |
| (b) percent recruitment | |||
| time to maturity | 1 | 41.2296 | 0.0000 |
| rearing : adult feeding delay | 1 | 6.6421 | 0.0110 |
| adult density : maternal age | 1 | 4.0822 | 0.0452 |
| log (juvenile density) : juvenile food | 3 | 4.2247 | 0.0068 |
| (c) age-at-maturity | |||
| adult food : maternal age | 1 | 5 | 0.020 |
| rearing : adult food | 1 | 25 | <0.001 |
| adult density : adult food | 2 | 45 | <0.001 |
| rearing : adult density | 2 | 68 | <0.001 |
| rearing : maternal age | 1 | 196 | <0.001 |
| adult feeding delay : adult food | 1 | 213 | <0.001 |
| rearing : adult feeding delay | 1 | 215 | <0.001 |
| adult density : adult feeding delay | 2 | 237 | <0.001 |
| adult density : maternal age | 2 | 1004 | <0.001 |
| adult feeding delay : maternal age | 1 | 1059 | <0.001 |
| juvenile food : log (juvenile density) | 3 | 2690 | <0.001 |
| (d) size-at-maturity | |||
| adult food | 1 | 7.495 | 0.011 |
| maternal age | 1 | 21.695 | <0.001 |
| percent recruitment | 1 | 11.896 | 0.002 |
| juvenile food : log (juvenile density) | 2 | 6.26 | 0.004 |
Only higher order interaction terms for the minimum adequate model are presented for each life-history trait. Rearing, adult density, adult feeding delay, adult food and maternal age are the parental generation treatments. Juvenile food and juvenile density are the treatments in the offspring generation. All models are presented with degrees of freedom and likelihood ratio test statistics (LRT=χ2; F-values for size) and p-values for consistency. All p-values are based on χ2 Wald tests except for size, where it is an F-test.
Well fed parents (parental food) produced eggs that hatch around day 4, independent of the rearing conditions that those parents experienced during their development (figure 2a,b). A similar interaction was detected between parental rearing and parental density treatments where hatching times for well or poorly reared adults were not different at low densities, but differed by nearly a day at moderate and high densities (χ22 rearing×density=117.20, p<0.001). Mothers' age and the amount of parental food explained the largest amount of variance in hatching time (figure 2c,d; χ12 food×maternal age=2149.86, p<0.001), possibly reflecting changes in provisioning and fitness with age (Roff 1992; Stearns 1992; Benton et al. 2005). In our study, eggs from older mothers hatch earlier, and eggs from young mothers with restricted food hatch at a similar time to those from older mothers.
The regression tree for the predictions from this model highlights the route to early and late hatching eggs (figure 3a). The earliest hatching eggs arise when parents experience good conditions as juveniles, and subsequently experience high densities, low amounts of food but no delay in feeding. The latest eggs appear to emerge from early laid eggs of poorly reared parents that subsequently receive high amounts of food. In our experiment, these eggs are produced by mothers experiencing a period of starvation.
Figure 3.

Regression trees were used to partition the variation in predicted values from the statistical models for each life-history trait. They are presented to help describe the structure of our statistical models, in particular highlighting when and where maternal effects might influence offspring performance over and above offspring density and food. (a) Time to hatching; (b) percent recruitment; (c) age-at-maturity; (d) size-at-maturity. In each tree, the lowest and highest predicted value of each trait is circled. Dashed arrows correspond to the pathway by which the tree-building algorithm has split the data for the lowest and highest values. Small italic print designates the magnitude of a factor at a split point. For example, in tree A for hatch date, the left-hand set of arrows indicates a route to early hatching from good adult rearing through high adult density and low adult food and no delay in adult feeding. Alternately, bad rearing, high food, young mothers and a 5 day delay in feeding adults leads to the latest hatch date. All descriptions of traits are identified in §2.
(b) Proportion recruiting
A model with only juvenile density and food levels explained 89% of the deviance in recruitment. Food and density during development explain the largest amount of the variance in recruitment (figure 4). Food over time (OT) produced higher recruitment, density dependence was nonlinear, and pulsed food generated the steepest density dependence (figure 4c). Note that a high pulse of food at low-juvenile density produced as many recruits as food OT at densities an order of magnitude higher.
Figure 4.

Variation in percentage of recruitment (all points are model fits and standard errors). (a) Controlling for the competitive environment juveniles face, the offspring recruitment of poorly reared mothers (bad) was higher than well reared mothers and more-so when parental food is delayed at maturity (5=5 day delay in food). (b) Furthermore, recruitment of offspring of older mothers increased with increasing parental density while recruitment of offspring of young mothers decreased with increasing density. (c) These patterns occur despite controlling for variation in recruitment associated with juvenile density and food. Recruitment declined exponentially with increasing juvenile density, and more steeply with food was limited to a pulse at hatching.
A model that included maternal conditions explained four percent more deviance (table 1b; Δ deviance χ72=1436.8, p<0.001). This model showed that interactions between parental rearing and parental delay in feeding and between parental age and the parental density explain a significant but small amount of variation in the percentage recruiting (figure 4a,b).
Corroborating the low-additional variation explained by maternal conditions, the regression tree (figure 3b) split our predictions by only juvenile characteristics. Very low recruitment arose from high-juvenile densities and low amounts of food while high recruitment arose with low densities and high amounts of food.
(c) Age-at-maturity
While a model of only juvenile environmental conditions explained 56% of the deviance in age-at-maturity, inclusion of the maternal environment explained seven percent more variability (table 1c; Δ deviance χ202=8459.66, p<0.001; 56–63%). As with recruitment, many of the interactions among maternal environment characteristics indicate that maternal investment can make a statistically significant contribution to age-at-maturity via investment into egg quality. In particular, the interactions between parental density and maternal age (χ22=1004, p<0.001) and between a delay in parental feeding and maternal age (χ22=1059, p<0.001; figure 5a,b) contribute substantially. For example, the increase in time to maturation that occurs with a delay in feeding for young mothers (figure 5a) is reversed in old mothers (figure 5b). However, as with the other traits, the offspring competitive environment dominates the explanation of variance (juvenile food×juvenile density interaction; χ32=2690, p<0.001; figure 5c,d): As density increases (figure 5c,d) the effects of lower food (over time (OT) versus pulsed (pul)) is exacerbated.
Figure 5.
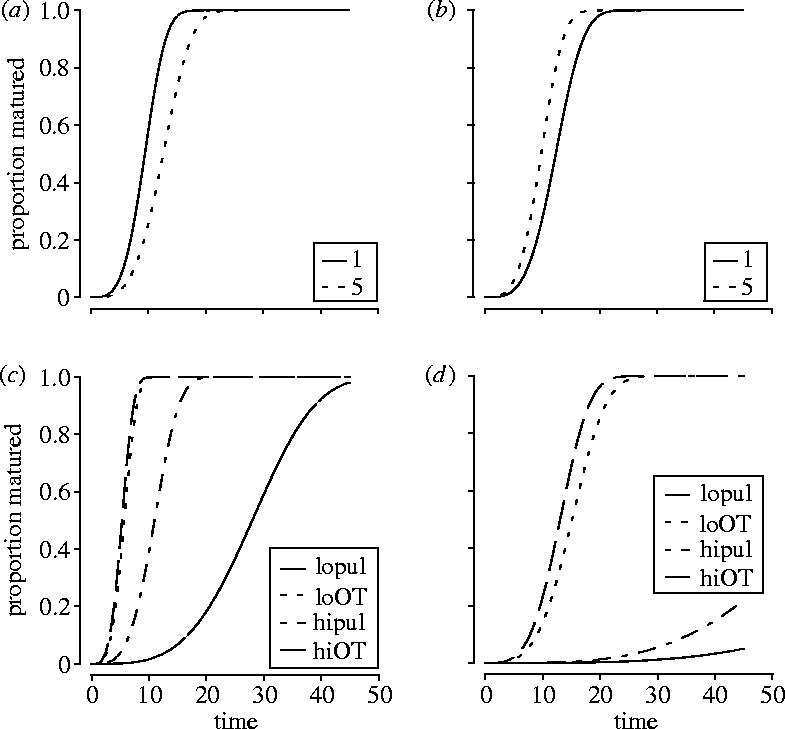
Age-at-maturity responds to maternal and juvenile environments. Curves are fitted survival functions from the accelerated failure time model. (a) Eggs hatching from young mothers hatch later when there is a delay in feeding. (b) Eggs hatching from older mothers hatch earlier when there is a delay in feeding. (c) This occurred while controlling for the effects of juvenile density and food, where low food (pulse=lopul and hipul) increases age-at-maturity, and (d) more substantially at higher densities.
The regression tree summary of the model predictions (figure 3c) highlights when and where maternal environmental characteristics influence age-at-maturity. The major explanation of variance in age-at-maturity comes from current conditions defined by food and density. However, in competitive environments—those defined by high density and low food—the effects of parental age, parental food and parental rearing conditions influence the age at which offspring mature. The inclusion of parental rearing conditions indicates that conditions experienced by parents a generation in the past can, under certain conditions, influence the age at which subsequent offspring mature. These effects are felt under a combination of poor conditions and that often distinguish between moderately late maturity and very late maturity. For example, in old parents reared poorly, high-juvenile density and poor juvenile food leads to a predicted offspring age-at-maturity of 89 days while good parental rearing conditions with the same offspring numbers and food reduces this by nearly 27 days.
(d) Size-at-maturity
A model incorporating the interaction between juvenile density and juvenile food explained 85% of the variance in size at maturity. The significant interaction (table 1d) indicated a negative relationship between female size and juvenile density when food was delivered over time, but a smaller size and no change in size with density when food was delivered in a pulse. There was no significant increase in the amount of variance in size explained when we accounted for maternal environment treatments (F=3.78, d.f.=1, p=0.05). Thus, there is limited evidence (albeit from a small sample size (n=39)) that patterns of maternal investment had an effect on size at maturity.
The regression tree (figure 3d) reflects the simple model and shows information only about the juvenile environment. Pulsed food leads to the smallest individuals while food over time and low juvenile densities lead to the largest individuals.
4. Discussion
Maternal effects are known to occur in a wide variety of organisms and influence offspring performance (Mousseau & Fox 1998a,b; Heath et al. 1999; Styrsky et al. 2000) as well as trophic interactions (Fox & Savalli 1998). It has been rare, however, for the population level consequences of maternal effects to be considered (but see Ergon et al. 2001; LaMontagne & McCauley 2001; Benton et al. 2005). Due to the trade-off between offspring size and number, maternal effects at the per capita investment level do not alone define the performance of offspring in a population. The trade-off suggests that in order to understand the population level consequences of maternal environments on offspring performance, we must examine both the effects of changing offspring quality and the subsequent effects of changing fecundity. Our aim was to investigate whether these ‘quality’ or ‘quantity’ effects were likely to be the primary determinant of offspring performance. Our factorial, ‘cohort’ style experiment, with substantial perturbations to parental environments, demonstrated that the offspring competitive environment can be the larger force defining performance. In our model system, with limited dispersal (e.g. a closed population), maternal effects may be significant, but they are a relatively small force compared to the contribution the maternal environment makes to the offspring competitive environment via fecundity.
Our analysis of time to hatching, which reflects only differences in investment by mothers to offspring, demonstrated that maternal effects do occur in this system: parental environmental conditions account for 77% of the variation in hatching time. Despite this, maternal effects accounted for only four percent of the variation in recruitment, seven per cent of the variation in age-at-maturity and none of the variation in size-at-maturity. Many of the interactions among maternal conditions have effects that are small. Some, based around maternal age, probably reflect patterns of investment with increasing age of mother (table 1c). Moreover, our regression tree view of the predicted traits (figure 3) highlights under what variety of conditions, offspring performance is modulated by parental investment. This is clearest in the age-at-maturity tree where a shift in the parental rearing conditions suggests up to a 27 day difference in age-at-maturity for offspring experiencing poor conditions.
Thus, while we know that classical maternal effects can occur in our system, our data suggest that, in the context of the trade-off between size and fecundity, numbers are far more important to the performance of juveniles. For example, poor adult rearing conditions and a delay in parental feeding produce the highest levels of recruitment. This occurs because poor parental conditions reduce fecundity (see Beckerman et al. 2003) and in our experimental design, the low density that the offspring subsequently experience has a marked positive effect on their performance. If parents experience low densities and high food availability they produce many small offspring. If these offspring subsequently enter a resource poor environment, they will suffer the effects of density dependence quite dramatically as their high density combines with low food resources.
Many of the effects in our experiments are driven by plasticity in adult fecundity cascading to offspring performance. We have created experimentally a situation where cohorts of offspring are entering a competitive environment wholly determined by the fecundity of their parents. Juvenile performance is thus largely determined by the conditions their parents generate through fecundity. This fecundity is a product of the environment the parents experienced a generation in the past. The patterns in our data may be most apparent in other systems when population structure is based on cohorts (age structure), complex life cycles, non-overlapping generations and limited juvenile dispersal. Examples include clumps of caterpillars in plants, vertebrate and invertebrate pond animals, or island metapopulations. In these situations, stages or ages can be disconnected from each other such that maternal environment based changes in fecundity can make a dramatic contribution to the offspring competitive environment. However, the effects are just as likely to occur in systems with continuous breeding and overlapping generations where competitive environments are a function of densities within and between age classes and fecundity fluctuates substantially.
Our data emphasize a strong link between offspring performance, current environmental conditions and plasticity in adult fecundity associated with variation in the parents' environment (see also Ergon et al. 2001). Maternal effects derived from investment into offspring may be small, but the effect of the maternal environment through fecundity is potentially large and reflected by performance in the offspring environment. These data thus argue that maternal environments can make substantial contributions to offspring performance and population dynamics. For example, the age-at-maturity data show significant and small evidence of response to maternal investment and significant and large evidence of response to competitive interactions. The consequences of both sources of maternal influence are mirrored by evidence that plasticity in age-at-maturity is very large, is cross-generational, and has substantial effects on population dynamics (Plaistow et al. 2004; Benton & Beckerman 2005; Benton et al. 2005; Plaistow et al. in press).
These data combine to demonstrate that understanding the population level response to variability in maternal environments requires an understanding of the trade-off between egg-quality and egg-number. We can conclude that a classical definition of maternal effects, based on investment, would lead us to believe that maternal effects are weak in the mites. However, a broad definition accounting for the trade-off between quality and number reveals a strong influence of maternal environment on offspring performance.
Acknowledgments
We thank Ken Wilson, Mark McPeek, Stewart Plaistow, Sophie Beckerman and many anonymous reviewers for comments on previous drafts. This research was funded by NERC (UK) grant GR3/12452 to T.G.B. Alex Alardyce, John McAlaney and Gemma Truelove provided valuable assistance in the lab.
Footnotes
School of Biology, University of Leeds, Leeds LS2 9JT, UK.
Welcome Centre for Molecular Parasitology, University of Glasgow, Glasgow G11 6NU, UK.
Centre for Conservation Science University of St Andrews, The Observatory, Buchanan Gardens, St Andrews KY16 9LZ, UK.
References
- Beckerman A.P, Benton T.G, Lapsley C.T, Koesters N. Talkin' 'bout my generation: environmental variability and cohort effects. Am. Nat. 2003;162:754–767. doi: 10.1086/381056. doi:10.1086/381056 [DOI] [PubMed] [Google Scholar]
- Benton T.G, Beckerman A.P. Population dynamics in a noisy world: lessons from a mite experimental system. In: Desharnis R.A, editor. Advances in ecological research: population dynamics and laboratory ecology. vol. 37. 2005. pp. 143–181. [Google Scholar]
- Benton T.G, Ranta E, Kaitala V, Beckerman A.P. Maternal effects and the stability of population dynamics in noisy environments. J. Anim. Ecol. 2001;70:590–599. doi:10.1046/j.1365-2656.2001.00527.x [Google Scholar]
- Benton T.G, Plaistow S.J, Beckerman A.P, Lapsley C.T, Littlejohns S. Changes in maternal investment in eggs can affect population dynamics. Proc. R. Soc. B. 2005;272:1351–1356. doi: 10.1098/rspb.2005.3081. doi:10.1098/rspb.2005.3081 [DOI] [PMC free article] [PubMed] [Google Scholar]
- Bernardo J. Maternal effects in animal ecology. Am. Zool. 1996;36:83–105. [Google Scholar]
- Bjornstad O.N, Begon M, Stenseth N.C, Falck W, Sait S.M, Thompson D.J. Population dynamics of the Indian meal moth: demographic stochasticity and delayed regulatory mechanisms. J. Anim. Ecol. 1998;67:110–126. doi:10.1046/j.1365-2656.1998.00168.x [Google Scholar]
- Coulson T, Catchpole E.A, Albon S.D, Morgan B.J.T, Pemberton J.M, Clutton-Brock T.H, Crawley M.J, Grenfell B.T. Age, sex, density, winter weather, and population crashes in Soay sheep. Science. 2001;292:1528–1531. doi: 10.1126/science.292.5521.1528. doi:10.1126/science.292.5521.1528 [DOI] [PubMed] [Google Scholar]
- Crawley M.J. Blackwell Science; Oxford, UK: 1993. GLIM for ecologists. [Google Scholar]
- Crawley M.J. Wiley; Chichester, UK: 2002. Statistical computing: an introduction to data analysis using S-PLUS. [Google Scholar]
- Dennis B, Desharnais R.A, Cushing J.M, Henson S.M, Costantino R.F. Estimating chaos and complex dynamics in an insect population. Ecol. Monogr. 2001;71:277–303. [Google Scholar]
- Ergon T, Lambin X, Stenseth N.C. Life-history traits of voles in a fluctuating population respond to the immediate environment. Nature. 2001;411:1043–1045. doi: 10.1038/35082553. doi:10.1038/35082553 [DOI] [PubMed] [Google Scholar]
- Fox G.A. Failure time analysis: studying times-to-events and rates at which events occur. In: Scheiner S.M, Gurevitch J, editors. Design and analysis of ecological experiments. 2nd edn. Oxford University Press; Oxford, UK: 2000. pp. 235–266. [Google Scholar]
- Fox C.W, Savalli U.M. Inheritance of environmental variation in body size: superparasitism of seeds affects progeny and grandprogeny body size via a nongenetic maternal effect. Evolution. 1998;52:172–182. doi: 10.1111/j.1558-5646.1998.tb05150.x. [DOI] [PubMed] [Google Scholar]
- Ginzburg L.R. Inertial growth: population dynamics based on maternal effects. In: Mosseau T.A, Fox C.W, editors. Maternal effects as adaptations. Oxford University Press; Oxford, UK: 1998. pp. 42–53. [Google Scholar]
- Ginzburg L.R, Taneyhill D.E. Population-cycles of forest lepidoptera—a maternal effect hypothesis. J. Anim. Ecol. 1994;63:79–92. [Google Scholar]
- Harrell F.E. Springer series in statistics. Springer; New York: 2001. Regression modeling strategies with applications to linear models, logistic regression and survival analysis. [Google Scholar]
- Harrell, F. 2005 The HMISC and DESIGN library for R/S-Plus: http://biostat.mc.vanderbilt.edu/twiki/bin/view/Main/RS
- Heath D.D, Fox C.W, Heath J.W. Maternal effects on offspring size: variation through early development of chinook salmon. Evolution. 1999;53:1605–1611. doi: 10.1111/j.1558-5646.1999.tb05424.x. [DOI] [PubMed] [Google Scholar]
- Inchausti P, Ginzburg L.R. Small mammals cycles in northern Europe: patterns and evidence for a maternal effect hypothesis. J. Anim. Ecol. 1998;67:180–194. doi:10.1046/j.1365-2656.1998.00189.x [Google Scholar]
- LaMontagne J.M, McCauley E. Maternal effects in Daphnia: what mothers are telling their offspring and do they listen? Ecol. Lett. 2001;4:64–71. doi:10.1046/j.1461-0248.2001.00197.x [Google Scholar]
- Messina F.J, Fox C.W. Offspring size and number. In: Fox C.W, Roff D.A, Fairbairn D.J, editors. Evolutionary ecology: concepts and case studies. Oxford University Press; Oxford, UK: 2001. pp. 113–127. [Google Scholar]
- Mousseau T.A, Fox C.W. The adaptive significance of maternal effects. Trends Ecol. Evol. 1998a;13:403–407. doi: 10.1016/s0169-5347(98)01472-4. doi:10.1016/S0169-5347(98)01472-4 [DOI] [PubMed] [Google Scholar]
- Mousseau T.A, Fox C.W. Oxford University Press; Oxford, UK: 1998b. Maternal effects as adaptations. [Google Scholar]
- Myers J.H, Boettner G, Elkinton J. Maternal effects in gypsy moth: only sex ratio varies with population density. Ecology. 1998;78:305–314. [Google Scholar]
- Plaistow S.J, Lapsley C.T, Beckerman A.P, Benton T.G. Age and size at maturity: sex, environmental variability and developmental thresholds. Proc. R. Soc. B. 2004;271:919–924. doi: 10.1098/rspb.2004.2682. doi:10.1098/rspb.2004.2682 [DOI] [PMC free article] [PubMed] [Google Scholar]
- Plaistow, S., Lapsley, C. & Benton, T. In press. Context-dependent intergenerational effects: the interaction between past and present environments and its effect on population dynamics. Am. Nat. [DOI] [PubMed]
- R Development Core Team. R Foundation for Statistical Computing; Vienna, Austria: 2005. R: a language and environment for statistical computing. [Google Scholar]
- Roff D.A. Chapman & Hall; New York: 1992. The evolution of life histories. [Google Scholar]
- Roff D.A. Sinauer Associates; Sunderland, MA: 2002. Life history evolution. [Google Scholar]
- Rossiter M.C. Environmentally based maternal effects—a hidden force in insect population-dynamics. Oecologia. 1991;87:288–294. doi: 10.1007/BF00325268. doi:10.1007/BF00325268 [DOI] [PubMed] [Google Scholar]
- Rossiter M. Maternal effects hypothesis of herbivore outbreak. Bioscience. 1994;44:752–763. [Google Scholar]
- Rossiter M.C. Incidence and consequences of inherited environmental effects. Annu. Rev. Ecol. Syst. 1996;27:451–476. doi:10.1146/annurev.ecolsys.27.1.451 [Google Scholar]
- Rossiter M.C. The role of environmental variation in parental effects expression. In: Mosseau T.A, Fox C.W, editors. Maternal effects as adaptations. Oxford University Press; Oxford, UK: 1998. pp. 112–136. [Google Scholar]
- Shertzer K.W, Ellner S.P. State-dependent energy allocation in variable environments: life history evolution of a rotifer. Ecology. 2002;83:2181–2193. [Google Scholar]
- Smith C.C, Fretwell S.D. The optimal balance between size and number of offspring. Am. Nat. 1974;108:499–506. doi:10.1086/282929 [Google Scholar]
- Stearns S.C. Oxford University Press; Oxford, UK: 1992. The evolution of life histories. [Google Scholar]
- Stenseth N.C, Bjornstad O.N, Falck W, Fromentin J.M, Gjosaeter J, Gray J.S. Dynamics of coastal cod populations: intra- and intercohort density dependence and stochastic processes. Proc. R. Soc. B. 1999;266:1645–1654. doi:10.1098/rspb.1999.0827 [Google Scholar]
- Styrsky J.D, Dobbs R.C, Thompson C.F. Food-supplementation does not override the effect of egg mass on fitness-related traits of nestling house wrens. J. Anim. Ecol. 2000;69:690–702. doi:10.1046/j.1365-2656.2000.00427.x [Google Scholar]
- Therneau, T. & Atkinson, B. 2005 rpart—regression tree algorithms for R: Therneau and Atkinson, MAYO Clinic.
- Venables W.N, Ripley B.D. Springer; New York: 1999. Modern applied statistics with S-PLUS. [Google Scholar]
- Venables W.N, Ripley B.D. Springer; New York: 2002. Modern applied statistics with S. [Google Scholar]