Abstract
We use a fully dated phylogenetic tree of the angiosperm families to calculate phylogenetic diversity (PD) in four South African vegetation types with distinct evolutionary histories. Since the branch length values are in this case represented by the ages of plant lineages, PD becomes the cumulative evolutionary age (CEA) of assemblages. Unsurprisingly, total CEA increases with family and with species diversity and observed values are the same as expected from random sampling of family lists. However, when random sampling is done from species lists, observed CEAs are generally lower than expected. In vegetation types which have undergone recent diversification—grassland, fynbos and Nama-karoo—co-occurring species are more closely related than expected, but in subtropical thicket the observed CEAs are well described by random sampling. The use of CEA has great potential for assessing the age of biotic assemblages, particularly as the dating of genus and species-level phylogenies become more accurate.
Keywords: Cape Floristic Region, evolutionary age, fynbos, phylogenetic diversity, vegetation history, South Africa
1. Introduction
The last few years have seen a growing interest in understanding, measuring and comparing the phylogenetic structure of biological communities (Webb et al. 2002). This effort has been paralleled by conservation biologists who have defined measures of phylogenetic diversity (PD) for conservation purposes (Faith 1992, 2002; Rodrigues & Gaston 2002; Pavoine et al. 2005). These studies suggest that PD, endemism and complementarity can represent valuable additions to species-based measures (Faith et al. 2004). Thus far, however, phylogenetic methods have only been applied across a limited number of systems and spatial scales. Some basic issues, such as measurements of total PD in vegetation plots and comparisons of this measure between different vegetation types, remain unexplored.
PD measures the total diversity of an assemblage by considering a particular clade and summing up the lengths of all the branches within that clade, present in the assemblage (Faith 1992). A variety of branch length measures have been used in PD studies (Pavoine et al. 2005). In a historical perspective, branch length values can be equated to the evolutionary ages of the clades they represent, in this case PD becoming cumulative evolutionary age (CEA).
Unfortunately, estimates of clade age are unavailable for most groups of organisms. The phylogeny of higher plants is probably the best understood of any group of organisms, and a fully dated tree for the angiosperms has recently been published (Davies et al. 2004). This tree allows the estimation, with reasonable accuracy, of angiosperm CEA in relevés (phytosociological plots), as well as in complete floras.
South Africa is an excellent location for comparisons of PD among vegetation types. The country has a high diversity of vegetation types, some of which have undergone explosive post-Miocene radiations (e.g. fynbos), while others have changed little since Late Eocene times (Linder & Hardy 2004; Cowling et al. 2005).
Here we present a first assessment of CEA values for different South African vegetation types. We show that CEA in angiosperms is narrowly bound by the number of higher taxa (families) present. Nevertheless, there is still a great degree of variation among vegetation types, and the shapes of associated dichotomy age histograms are also vegetation-specific. The patterns we derive reflect the evolutionary history of South African flora and vegetation remarkably well.
2. Material and methods
We computed CEA for 64 plots of 10×10 m. There were 16 plots for each of the four vegetation types considered, namely fynbos, grassland, subtropical thicket and Nama-karoo (hereafter we refer to the latter two as thicket and karoo, respectively). To cover some of the broad scale compositional variation in each vegetation type, we surveyed plots both in the core regions of each vegetation type (fynbos: 34°18′720 S, 18°56′957 E; grassland 31°17′757 S, 27°17′498 E; thicket: 33°51′223 S, 25°37′291 E; karoo: 32°16′861 S, 22°37′764 E) and in the Baviaanskloof Conservation Area of the Eastern Cape (33°38′090–33°41′714 S; 24°12′327–24°14′817 E), where all four vegetation types co-occur. We sampled eight plots for each vegetation type at each locality. In each plot, we noted the complete list of angiosperm species, during 2002–2003. The 64 plots jointly contained 437 angiosperm species, belonging to 67 families.
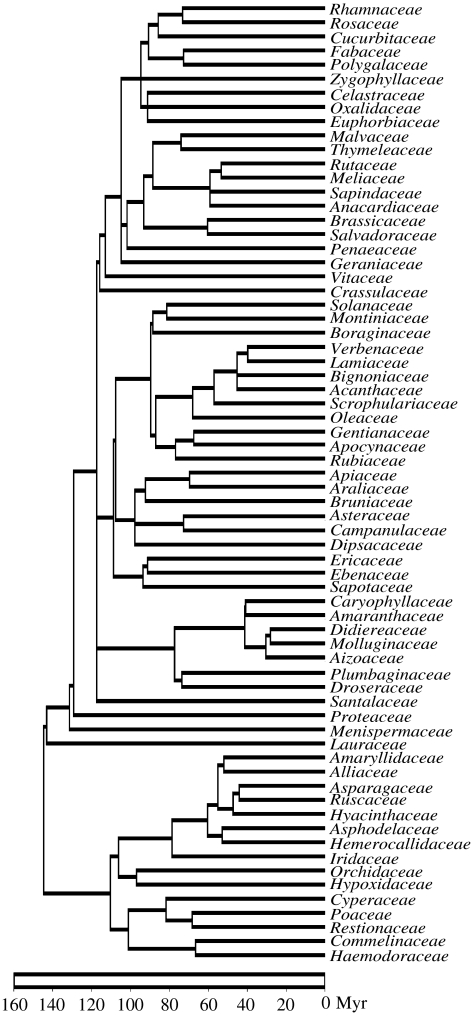
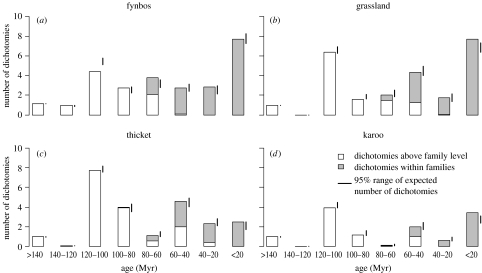
We used the complete angiosperm family-level tree of Davies et al. (2004, electronic supplementary material; figure 1) to date dichotomies at and above family level. The age of dichotomies for South African genera and species is not yet available in one comprehensive tree, but the large number of available phylogenies reviewed by Linder & Hardy (2004) and Cowling et al. (2005) allowed us to confidently place these dichotomies in 20 Myr intervals (0–20 Myr before present, 20–40 Myr, etc.). This allowed us to draw histograms for the numbers of dichotomies observed in each 20 Myr interval, for each vegetation type (figure 2). An expected distribution was calculated by using an independent swap algorithm (species occurrences were swapped, while keeping constant both the numbers species per sample and the total number of occurrences for each species (‘SIM9’; Gotelli 2000)). We considered intra-familial divergence times insufficiently accurate to be used in CEA calculation. However, given that within-family branches represented only 1–25% of the CEA for each plot (average: 10%), we concluded that the use of familial distances is a reasonable approximation of total CEA.
Figure 1.
The family-level phylogenetic tree used in calculating cumulative evolutionary age (CEA) for South African vegetation plots, based on Davies et al. (2004). Only families found in the plots are shown.
Figure 2.
Histograms of the age of dichotomies observed in each vegetation plot for (a) fynbos, (b) grassland, (c) thicket and (d) karoo (mean numbers of dichotomies for a given age interval are presented; 16 plots per vegetation type). Age values for dichotomies above family level are based on Davies et al. (2004), and age values for dichotomies within families are based on recent reviews of familial and generic phylogenies (Linder & Hardy 2004; Cowling et al. 2005). The 95% range of expected number of dichotomies was calculated by species occurrence swapping (‘SIM9’; Gotelli 2000).
CEA is a version of PD (Faith 1992), where branch length is equal to evolutionary age. We take CEA to be the minimum tree length that connects all the families in the plot to the root of the tree. Since basal paleodicots were absent from our plots, the root is the point when monocots and eudicots diverged. Therefore, the CEA of a plot with only one plant species (irrespective of the species) is the age of the tree, or about 144 Myr; a plot with one monocot and one dicot species scores 288 Myr; and plots with two monocot or two dicot species score between 144 and 288 Myr. For example, a plot with Poaceae and Cyperaceae scores twice 82 Myr (when Poaceae and Cyperaceae diverged), plus 62 Myr to the tree root, that is, 226 Myr.
To obtain the CEA of a given set of families, we created a matrix containing divergence times for each family pair. We then calculated the minimum connector from the matrix using Prim's greedy algorithm (Christofides 1975) implemented in the program R v. 2.0.1 (copyright 2004, The R Development Core Team). This method re-created the tree topology, while taking into account the distance to the tree root.
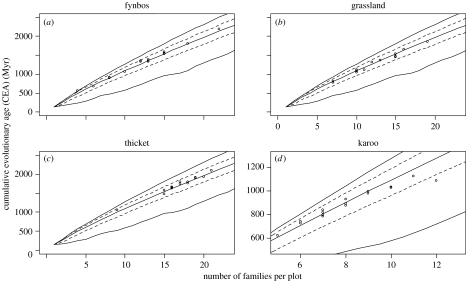
To calculate expected CEA values, we created 100 000 random samples of families for each given number of families per plot. Plant families were selected from the combined list for all vegetation types, and, in a second analysis, from each vegetation type separately. The assumption made in the former case was that all families could have colonized any vegetation types with equal probability. We used the resulting distribution of CEA values to calculate an expected median CEA and a 95% confidence interval around the median (figure 3). The use of 100 000 random samples gave a reliable estimate of the 95% confidence interval (CV<0.1%), but poor estimates of the maximum and minimum limits. Therefore, we estimated the maximum CEA possible by manually selecting the set of families that diverged the longest time ago (by adding nodes from the tree root up), and, likewise, by manually selecting the set of families that diverged most recently, we estimated the minimum CEA (only for the first 25 families, by considering all combinations in the three most recent radiations: Asteridae, Caryophyllales and Asparagales). We considered the plant taxa in a vegetation type to be phylogenetically clustered when they were more closely related to one another than expected by random, and phylogenetically overdispersed when they were more distantly related than expected (Cavender-Bares et al. 2004). To test this, we calculated the cumulative probability of an observed CEA from the expected distribution of CEAs (i.e. the quantile of the observed value in the distribution). If there is a phylogenetic pattern, then the logit-transformed probabilities should be significantly different from zero. In a similar manner, we tested the effect of number of species in a plot on CEA.
Figure 3.
The relationship between the number of families in a plot and cumulative evolutionary age (CEA) for (a) fynbos, (b) grassland, (c) thicket and (d) karoo. The upper and lower lines are the minimum and maximum CEA for a given number of families; the middle line is the median CEA, and the dotted lines are the 95% confidence intervals, calculated by randomly sampling the complete family list. Karoo data (fewer families) are plotted on a different scale.
3. Results
In the age histograms, the highest numbers of dichotomies (both expected and observed) were in the 120–100 Myr and less than 20 Myr periods (figure 2). An abrupt increase in dichotomies from the 40–20 Myr to the less than 20 Myr period was observed in grassland and fynbos, and also in karoo, although total numbers were much lower in karoo. In grassland and karoo, the values for the less than 20 Myr period were higher than expected. Thicket had the lowest number of dichotomies in this period, but the highest number in the 40–60 Myr period. Among older dichotomies, the ubiquitous co-existence of monocots and dicots was reflected in an almost constant value of one for the 160–140 Myr dichotomies. For the 140–120 Myr period, fynbos had a value close to one (due to the presence of the early-branching Proteaceae), while all other vegetation types had values equal or close to zero (figure 2).
The average CEA value for a plot was approximately 1450 Myr. Thicket had the most families and highest CEA values; grassland tended to be less diverse; while karoo contained the fewest families and had the lowest CEA values. The average number of families and CEA values in fynbos plots were similar to grassland plots, but much more variable (including the lowest and highest CEA values: 560 Myr, corresponding to 17 species from four families and 2199 Myr for 34 species from 22 families).
The expected distribution of CEA values for a given number of families was very narrow (see 95% confidence interval in figure 3), and most plots from fynbos, grassland and thicket fell within the expected range. CEAs in fynbos, grassland and thicket were not significantly different to those obtained when we randomly sampled families from the list of all the families (fynbos, t15=1.64, p=0.12; grassland, t15=−2.00, p=0.06; thicket, t15=2.03, p=0.06). The number of families found in karoo plots had a significant effect on the observed CEA, plots with few families having a higher CEA than would be expected by random, and plots with many families having a lower CEA than expected (t14=−6.05, p<0.01; figure 3).
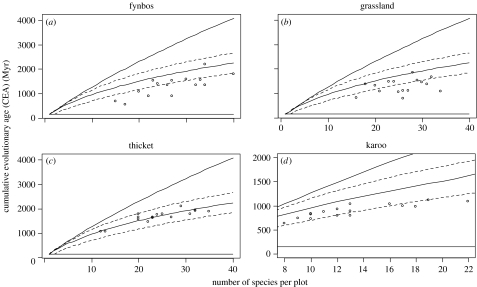
The CEAs observed in thicket were not significantly different to those expected if species were randomly selected from the list of all the species (t15=0.18, p=0.86). However, species were phylogenetically clustered in fynbos (t15=−6.06, p<0.01) and grassland (t15=−5.61, p<0.01). Species in the karoo plots were not only phylogenetically clustered, but the degree of clustering also increased with increasing number of species in a plot (F1,14=17.03, p<0.01; figure 4). The results were similar, but less marked, if species were randomly selected from the list of only those species present in a particular vegetation type (see figure 1 of electronic supplementary material).
Figure 4.
The relationship between the number of species in a plot and cumulative evolutionary age (CEA) for (a) fynbos, (b) grassland, (c) thicket and (d) karoo. The upper and lower lines are the minimum and maximum CEA for a given number of species. The middle line is the median CEA and the dotted lines are the 95% confidence intervals, calculated by randomly sampling the complete species list. Karoo data (fewer species) are plotted on a different scale.
4. Discussion
(a) The partitioning of CEA
Our results clearly show that there is enough variation in angiosperm CEA to make comparisons between vegetation types meaningful and interesting. Nevertheless, the greater part of the CEA values observed is from branches older than family divergences. Although old dichotomies are represented differently in different vegetation types, they seldom relate directly to evolution within those vegetation types.
The positive relationship between the diversity of higher taxa (here, families) and CEA is described by a slightly decreasing curve (figure 3), closely approximating a straight line. The scatter of values is very narrowly constrained by the minimum and maximum curves. Therefore, if analysed as a linear relationship, it will inevitably result in high r2-values (see the bird genera–PD relationship illustrated by Rodrigues & Gaston (2002)).
(b) Dichotomy age histograms
For the last 40 Myr, the steep increase in number of dichotomies in grassland and karoo was clearly higher than expected. Surprisingly, although the number of dichotomies in the last 20 Myr interval was also high in fynbos, it was not higher than expected. The high expected values in fynbos resulted from greater occupancy (more common species—see figures 2 and 3 of electronic supplementary material, where expected values are calculated while separately varying number of species per plot and occupancy). This confirms the recent finding that a large proportion of fynbos plants, resulted from recent radiations, are locally common, although their geographical distribution is extremely narrow (Latimer et al. 2005).
In thicket, the number of dichotomies in the last 20 Myr interval was a lot lower, compared to the other vegetation types (figure 2). Thicket probably recruits phylogenetically disparate plants from other vegetation types, despite having its own complement of characteristic taxa with a long evolutionary history (Cowling et al. 2005), and thus acts as a ‘museum’ of plant diversity.
(c) Phylogenetic clustering and overdispersion
Two apparently conflicting hypotheses exist regarding the phylogenetic structure of ecological communities. If phylogenetic constraints prevent some clades from colonizing certain environments, then co-occurring plants are likely to be more closely related than expected by chance, and CEAs should be smaller (phylogenetic clustering). However, if related plants do not co-exist at small spatial scales because of limited niche space, then the opposite relationship should be observed (phylogenetic overdispersion; Cavender-Bares et al. 2004). Overdispersion has been detected in small clades, where different sections of one genus co-occur more often than species from the same section (Cavender-Bares et al. 2004). However, in this study, where all angiosperms are considered, clustering was observed in three out of four vegetation types. This is due to the co-occurrence of plants from the same family (e.g. Poaceae and Asteraceae in grassland and karoo and Restionaceae and Ericaceae in fynbos) or even from the same genus (up to nine species of Erica in one fynbos plot, and up to five Helichrysum species in a grassland plot). As our CEA calculations did not consider phylogenetic relationships below the family level, these results are largely equivalent to the high species per family ratios, long documented in fynbos, (Goldblatt & Manning 2000), but shown here also in grassland and karoo.
Since a part of the diversification process happened within extant vegetation types, the species pools are likely to be biased towards closely related taxa. However, we show here that not only are species within one vegetation type closer related than expected by random, but also the species in one plot are closer related than expected from the full list for that vegetation type (see figure 1 of electronic supplementary material). Therefore, phylogenetic clustering is partitioned between and within vegetation types.
(d) A South African perspective
It is known that fynbos species diversity, high across all spatial scales, is due to a relatively small number of recently diversified lineages (Linder & Hardy 2004). Similarly, the young age of arid systems like the karoo is confirmed by paleoclimatic and paleobotanical studies (Zachos et al. 2001), as well as recent phylogenies (Klak et al. 2004). Our results clearly illustrate this, with high numbers of dichotomies in recent age classes (figure 2) and obvious phylogenetic clustering (figure 4) in these modern vegetation types. However, in thicket vegetation, the distributions of family-CEA and species-CEA values show no clustering (figure 4). The 40–60 Myr interval, with more dichotomies in thicket than in any other vegetation type (figure 2), corroborates the suggested Eocene origin for multiple thicket lineages (Cowling et al. 2005).
Karoo plants occur at lower densities, meaning that closely related, potentially competing plants are less likely to co-occur at a given plot size, compared to the other vegetation types. This could be tested by comparing CEA values for equal numbers of neighbouring individuals, in which case the observed phylogenetic clustering in karoo could appear more pronounced than shown here, similar to that in fynbos and grassland (see figure 4). The same effect could be sought in thicket, if restricting the analyses to one growth form. The greater CEA values reported here from thicket probably relate to higher growth form diversity (Cowling et al. 1994), in conjunction to lower density in each given growth form. In trees and shrubs, this relates to the larger size of the individuals.
(e) The way forward
Quantifying the degree of relatedness in plant communities using PD measures is more objective than previously used approaches, such as using species to genus ratios. Species to genus ratios are bound by the limited number of taxonomic ranks and are biased by the artificial delimitation of higher taxa, whereas PD sums up a continuous variable (branch length). The use of evolutionary age as a branch length measure makes possible the integration of species data with community history, although the sum of the evolutionary ages of a group of species should not be confused with the period of time for which they have co-existed. It will be interesting to see whether CEA values in other vegetation types match the patterns shown here. Are CEA values typically close to a random expectation, as shown here in thicket? Or is the aggregation of closely related taxa, as shown here in fynbos, grassland and karoo, more common?
As more information on dated phylogenetic trees becomes available, such analyses will become increasingly possible and more reliable. The tree used here is currently the only fully dated angiosperm tree and uses a single calibration point (Davies et al. 2004). Multiple calibration points (and the use of different data and methods in constructing the trees) may alter our results, most likely by pushing dichotomies further back in time, but the general conclusions of our study are likely to stay true.
The choice of angiosperms as a study group was dictated here by the availability of a dated tree. However, it is likely that angiosperms are also a good choice in a macroecological perspective. Angiosperm diversity and occupancy are high across spatial scales. Including gymnosperms and ferns next to angiosperms would be important if they had high occupancy at the scale under consideration. More importantly, the inclusion of species-level phylogenies, as yet unavailable for entire communities, will allow a more detailed analysis of the interaction between phylogeny and community ecology than presented here.
Acknowledgments
This work was funded by the Nelson Mandela Metropolitan University (Ş.P. and R.M.C.) and by Stellenbosch University postdoctoral grants to Ş.P. and J.R.U.W. Nigel Barker, Ladislav Mucina and Syd Ramdhani are thanked for discussion, Dan Faith, Campbell Webb and two anonymous referees for comments on the manuscript.
Supplementary Material
References
- Cavender-Bares J, Ackerly D.D, Baum D.A, Bazzaz F.A. Phylogenetic overdispersion in Floridian oak communities. Am. Nat. 2004;163:823–843. doi: 10.1086/386375. 10.1086/386375 [DOI] [PubMed] [Google Scholar]
- Christofides N. Academic Press; New York, NY: 1975. Graph theory—an algorithmic approach. [Google Scholar]
- Cowling R.M, Esler K.J, Midgley G.F, Honig M.A. Plant functional diversity, species-diversity and climate in arid and semiarid Southern Africa. J. Arid Environ. 1994;27:141–158. 10.1006/jare.1994.1054 [Google Scholar]
- Cowling R, Procheş Ş, Vlok J.H.J. On the origin of southern African subtropical thicket vegetation. S. Afr. J. Bot. 2005;71:1–23. [Google Scholar]
- Davies T.J, Barraclough T.G, Chase M.W, Soltis P.S, Soltis D.E, Savolainen V. Darwin's abominable mystery: insights from a supertree of the angiosperms. Proc. Natl Acad. Sci. USA. 2004;101:1904–1909. doi: 10.1073/pnas.0308127100. 10.1073/pnas.0308127100 [DOI] [PMC free article] [PubMed] [Google Scholar]
- Faith D.P. Conservation evaluation and phylogenetic diversity. Biol. Conserv. 1992;61:1–10. 10.1016/0006-3207(92)91201-3 [Google Scholar]
- Faith D.P. Quantifying biodiversity: a phylogenetic perspective. Conserv. Biol. 2002;16:248–252. doi: 10.1046/j.1523-1739.2002.00503.x. 10.1046/j.1523-1739.2002.00503.x [DOI] [PubMed] [Google Scholar]
- Faith D.P, Reid C.A.M, Hunter J. Integrating phylogenetic diversity, complementarity, and endemism for conservation assessment. Conserv. Biol. 2004;18:255–261. 10.1111/j.1523-1739.2004.00330.x [Google Scholar]
- Goldblatt P, Manning J.C. Cape plants: a conspectus of the Cape flora of South Africa. Strelitzia. 2000;7:1–743. [Google Scholar]
- Gotelli N.J. Null model analysis of species co-occurrence patterns. Ecology. 2000;81:2606–2621. [Google Scholar]
- Klak C, Reeves G, Hedderson T. Unmatched tempo of evolution in Southern African semi-desert ice plants. Nature. 2004;427:63–65. doi: 10.1038/nature02243. 10.1038/nature02243 [DOI] [PubMed] [Google Scholar]
- Latimer A.M, Silander J.A, Cowling R.M. Neutral ecological theory reveals isolation and rapid speciation in a biodiversity hot spot. Science. 2005;309:1722–1725. doi: 10.1126/science.1115576. 10.1126/science.1115576 [DOI] [PubMed] [Google Scholar]
- Linder H.P, Hardy C.R. Evolution of the species-rich Cape flora. Phil. Trans. R. Soc. B. 2004;359:1623–1632. doi: 10.1098/rstb.2004.1534. 10.1098/rstb.2004.1534 [DOI] [PMC free article] [PubMed] [Google Scholar]
- Pavoine S, Ollier S, Dufour A.B. Is the originality of a species measurable? Ecol. Lett. 2005;8:579–586. 10.1111/j.1461-0248.2005.00752.x [Google Scholar]
- Rodrigues A.S.L, Gaston K.J. Maximising phylogenetic diversity in the selection of networks of conservation areas. Biol. Conserv. 2002;105:103–111. 10.1016/S0006-3207(01)00208-7 [Google Scholar]
- Webb C.O, Ackerly D.D, McPeek M.A, Donoghue M.J. Phylogenies and community ecology. Annu. Rev. Ecol. Syst. 2002;33:475–505. 10.1146/annurev.ecolsys.33.010802.150448 [Google Scholar]
- Zachos J, Pagani M, Sloan L, Thomas E, Billups K. Trends, rhythms, and aberrations in global climate 65 Ma to present. Science. 2001;292:686–693. doi: 10.1126/science.1059412. 10.1126/science.1059412 [DOI] [PubMed] [Google Scholar]
Associated Data
This section collects any data citations, data availability statements, or supplementary materials included in this article.


