Abstract
Recent studies have demonstrated that ecological interference among some childhood diseases may have important dynamic consequences. An interesting question is, when would we expect the interference effect to be pronounced? To address the issue, here we develop a seasonally forced two-disease age-structured model, using empirically derived age-specific force of infection (ASFOI) for numerous infections of childhood. Our comparative numerical analysis shows that when the ASFOIs for the two diseases largely overlap, the dynamics predicted by the two-disease model are generally different from those predicted by the analogous single-disease model, suggesting strong fingerprints of disease interference. When the ASFOIs overlap less, on the other hand, both diseases behave as predicted by the single-disease model, suggesting weak interference. We conclude that age structure is an important factor that should be taken into account in order to explore the underlying mechanisms of disease interference.
Keywords: childhood infections, age structure, disease dynamics, interference strength
1. Introduction
Over a century ago, clinical epidemiologists in the UK noted that epidemics of measles and whooping cough were typically out of phase—a major epidemic of one was followed approximately a year later by an epidemic of the other (Creighton 1894; Laing & Hay 1902). The precise mechanism responsible for any such interaction was unclear at the time and was assumed to be immune-mediated. Recently, Rohani et al. (1998, 2003) proposed a general ecological mechanism for interaction among antigenically distinct infections. The interaction is envisaged to arise via competition for susceptible hosts and the subsequent dynamic consequences of the removal of individuals after infection (temporarily due to quarantining and convalescence or permanently as a result of infection-induced mortality). Mathematical models demonstrated that the clearest signature of ‘interference’ between infections is systematic phase differences in multiennial dynamics: the epidemics of the two diseases oscillate out of phase (Rohani et al. 1998). This finding was shown to be consistent with European case fatality data for measles and whooping cough in the early decades of the twentieth century (Rohani et al. 2003). Given that—in addition to measles and whooping cough—there are a number of other widely co-circulating micro-parasitic infections of childhood (such as chickenpox, mumps and rubella) and that they all effectively compete for hosts, do we expect strong interference within this epidemiological community? It was argued by Rohani et al. (2003) that interference is likely to be most intense when infections compete for the same cohort of hosts, which in such infections is likely to be the case when infections have a similar distribution of age at infection, as determined by the basic reproductive ratio, R0 (Anderson & May 1991). The systematic exploration of this issue clearly requires the detailed age structure of transmission to be taken into account.
The issue of age dependency in contact rates, resulting from increased transmission within schools, has been of interest to epidemiologists for a long time (Anderson & May 1982a; Schenzle 1984). Great efforts have been made by empirical and theoretical epidemiologists to explore the age-related characteristics of diseases, such as the age distribution at infection and the age-specific force of infection (ASFOI), which is the probability per unit of time that a susceptible of a certain age is infected (Anderson & May 1985a,b, 1991). These age-related aspects of transmission are relatively well documented for the major childhood diseases. It is known, for instance, that in the pre-vaccine era in the developed world the mean age at infection (A) for measles and whooping cough was 4–5 years, whereas for chickenpox and rubella it was 6–8 and 9–11 years, respectively (Anderson & May 1982b). Additionally, there are subtle differences in the profile of ASFOI distribution between these infections. The epidemiological consequences of age-structured effects have been documented in a number of studies (Schenzle 1984; Dietz & Schenzle 1985; Greenhalgh 1988; Hethcote 1988, 1997; Inaba 1990; Bolker & Grenfell 1993; Greenhalgh & Dietz 1994; Ferguson et al. 1996).
Here, we aim to examine the age-related competition between different diseases by presenting a two-disease model, where both age dependency and seasonality in transmission rates are explicitly considered. By comparing the predictions of single-disease and two-disease models, we aim to examine two key questions: (i) what are the qualitative and quantitative consequences of disease interference, and (ii) how much overlap in the ASFOIs is necessary for the epidemics of two infections to interfere?
2. Model framework
We extend the simple two-disease SEICR model proposed by Rohani et al. (1998), with contact rates both age- and seasonally dependent. Initially, individuals are, S, Susceptible to both diseases. They enter the, E, Exposed class when contracting one disease. After the latent period, the individuals become, I, Infectious. Typically, children would be sent to hospital or home for, C, Convalescence once symptoms appear, and this usually would be followed by, R, complete Recovery and lifelong immunity. In the entire epidemiological process, we assume that the probability of co-infection is negligible. For childhood diseases, contact rates are the most important parameters in which age-related heterogeneity needs to be taken into account. The other epidemiological parameters, such as latent, infectious and convalescent periods, will be assumed to be age-independent for simplicity. The model with continuous time and continuous age can be described by a 13-dimensional set of partial differential equations (see appendix A). In application, individuals fall into age discrete groups (Schenzle 1984). Specifically, we adopt the common approach of splitting hosts into five age classes: 0–5, 6–10, 11–15, 16–20 and ≥ 21 years, which roughly correspond to, respectively, pre-school children, primary school children, middle school students, high school students and adults. We further assume that the contact matrices have the following form:
which is known as the WAIFW matrix (‘Who Acquires Infections From Whom’; see e.g. Anderson & May 1991). This type of WAIFW matrix has been intensively adopted in the literature and is believed to be plausible in modelling childhood infections. The matrix contains five distinct elements, which can be either fitted directly to disease incidence data (Bolker 1993; Bolker & Grenfell 1993) or estimated indirectly from a corresponding ASFOI distribution derived from case notification or serological data (Grenfell & Anderson 1985). We use the ASFOI distributions for micro-parasitic childhood infections documented in the literature (e.g. Grenfell & Anderson 1985; Farrington 1990; Anderson & May 1991; Farrington & Kanaan 2001; Whitaker & Farrington 2004). For the detailed algorithm to estimate the contact rates from a given ASFOI distribution, we refer interested readers to Anderson & May (1991). In addition to age-dependent contacts, we assume that transmission rates are determined by seasonality, mimicking the pattern of opening and closing of schools during the year (model details are presented in Appendix A).
3. Comparative numerical survey
In order to examine the relationship between disease interference and the age at infection profiles, we numerically study and compare the epidemic patterns in the two-disease model for some specific pairs of diseases. We focus on three specific pairs: measles and whooping cough, measles and chickenpox, and measles and rubella, in which whooping cough, chickenpox and rubella have similar epidemiological traits (latent/infectious periods), but have markedly different age at infection profiles (table 1). The difference in age at infection most likely results in different dynamical consequences when interacting with measles. The systematic numerical survey consists of three steps: (i) examine the dynamics of diseases in isolation, (ii) determine the dynamics of diseases when they are coupled in pairs and (iii) identify any interference effects by comparing the single and paired dynamics.
Table 1.
Epidemiological parameters associated with the four common childhood diseases (from Grenfell & Anderson 1985; Farrington 1990; Anderson & May 1991; Rohani et al. 1998). (‘LP’, ‘IP’ and ‘CP’ represent, respectively, latent, infectious and convalescent period.)
| disease | force of infection (five age classes) | R0 | LP (days) | IP (days) | CP (days) |
|---|---|---|---|---|---|
| measles | [0.18,0.40,0.42,0.2,0.02] | 17 | 8 | 5 | 7 |
| whooping cough | [0.15,0.48,0.24,0.05,0.05] | 17 | 8 | 10 | 14 |
| chickenpox | [0.13,0.22,0.19,0.14,0.08] | 11 | 10 | 10 | 14 |
| rubella | [0.08,0.14,0.12,0.09,0.05] | 7 | 9 | 11 | 14 |
(a) Single-disease dynamics
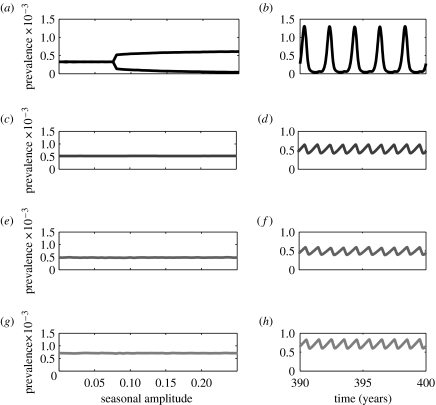
Under the term-time seasonal forcing, the single-disease measles model predicts annual cycles when the amplitude of seasonality is small. These annual epidemics give way to biennial cycles as seasonal amplitude increases (figure 1): a pattern that is consistent with numerous other studies (e.g. Bolker 1993; Rohani et al. 1998; Earn et al. 2000). In direct contrast, the epidemics of whooping cough, chickenpox and rubella are rigidly annual within the specified range of seasonality, due to their longer infectious periods (figure 1) (Keeling et al. 2001; Rohani et al. 2002; Greenman et al. 2004).
Figure 1.
One-parameter bifurcation diagrams and example time-series plotted for fixed seasonal amplitude (b=0.2) for the single-disease age-structured model. In the bifurcation diagrams, the vertical axis represents the annual average prevalence level. Measles, whooping cough, chickenpox and rubella are identified by different degrees of darkness in a decreasing order. (a, b) Measles; (c, d) whooping cough; (e, f) chickenpox; (g, h) rubella. The parameters associated with the four diseases, including the forces of infection (derived from data), latent periods and infectious periods, are given in table 1.
(b) Two-disease dynamics
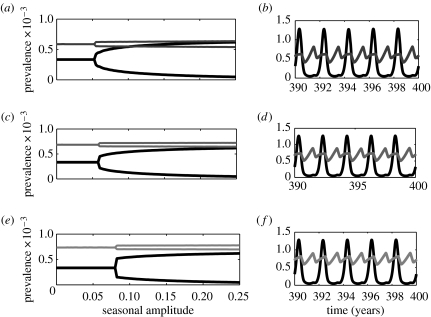
Coupling whooping cough, chickenpox and rubella with measles according to our two-disease age-structured model leads to three combinations of two-disease interactions. The measles–whooping cough dynamics clearly suggest a strong interference (figure 2), with three different aspects to this interaction. (I) The epidemics of whooping cough in this model become biennial as the amplitude of seasonality increases, in stark contrast with the single-disease model. (II) When epidemics are biennial, epidemics of the two diseases oscillate out of phase. (III) In the two-disease model, the bifurcation from annual to biennial outbreaks occurs at a lower amplitude of seasonality compared to the single-disease model. These interference signatures, which are fully consistent with previously reported patterns in age-independent models (Rohani et al. 1998; Huang & Rohani 2005), are used to explore the strength of interference effects between different pairs of infections. The interference signature (I) reflects the influence of measles on whooping cough, whereas the interference signature (III) embodies the impact of whooping cough on measles.
Figure 2.
One-parameter bifurcation diagrams and example time-series for the two-disease age-structured model. Bifurcation diagrams for (a) measles–whooping cough, (b) measles–chickenpox and (c) measles–rubella interactions. The related parameters are listed in table 1. Panels (b), (d) and (f) plot the cycles corresponding to the three pairs of two-disease interactions, respectively (for seasonal amplitude b=0.2). Similar to figure 1, measles, whooping cough, chickenpox and rubella are identified by different degrees of darkness in a decreasing order. The convalescent period is about 7 days for measles and 14 days for the other three diseases. Disease-induced mortality for both diseases is zero.
Examination of the three bifurcation diagrams in figure 2 (and comparison with the corresponding single-disease scenario) reveals interference signature (I). Namely, the epidemics of measles can also induce biennial cycles in chickenpox and rubella dynamics for a range of seasonal amplitudes. However, there are key differences in the interference signature (III) between the three cases. As shown in figure 2, the critical amplitude of seasonality at which the bifurcation from annual to biennial outbreaks occurs is smaller than that predicted by the single-disease model for measles–whooping cough and measles–chickenpox interactions. For measles–rubella, however, the critical seasonal amplitude is almost identical to that observed in the single-disease model. These differences suggest that whooping cough and chickenpox exert a detectable influence on measles dynamics, whereas the presence of rubella has almost no impact.
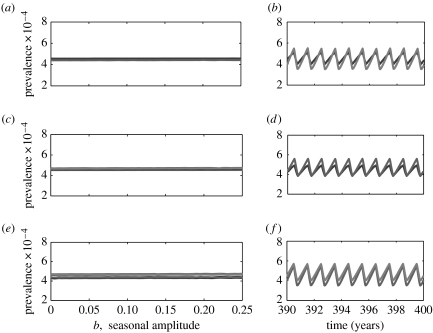
Further examining the dynamics of the other three pairs of diseases (whooping cough and chickenpox, whooping cough and rubella and chickenpox and rubella) we find that, for the given range of amplitude of seasonality, all diseases exhibit rigidly annual cycles as observed in the single-disease model and that there is no significant difference in the amplitude of cycles among the three cases (see figure 3).
Figure 3.
One-parameter bifurcation diagrams and example time-series for the two-disease age-structured model. Bifurcation diagrams for (a) whooping cough–chickenpox, (b) whooping cough–rubella and (c) chickenpox–rubella interactions. The related parameters are listed in table 1. Panels (d), (e) and (f) plot the cycles corresponding to the three pairs of two-disease interactions, respectively (for seasonal amplitude b=0.2). Whooping cough, chickenpox and rubella are identified by different degrees of darkness in a decreasing order.
(c) A continuous gradient of interference strength
When the two-disease model exhibits biennial cycles as a result of disease interference, the amplitude of cycles provides information about the strength of the interference effect. In this section we focus on a few scenarios to examine the change in the interference strength as the difference between the two diseases' ASFOIs is varied smoothly.
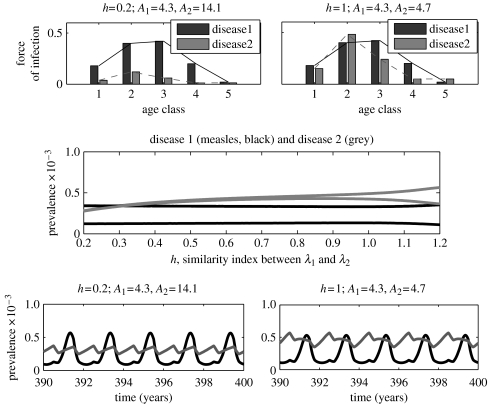
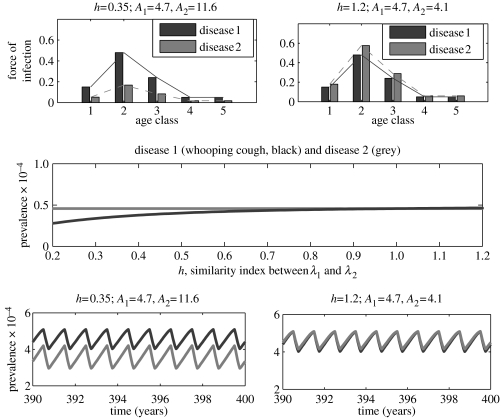
In the first case, disease 1 represents measles with fixed epidemiological traits, as given in table 1, while disease 2 represents an infection with the epidemiological traits of whooping cough except that the ASFOI is assumed to scale as λ2=hλwc, where λwc is the ASFOI for whooping cough (see table 1) and h≥0 is a positive parameter measuring the relative decrease (h<1) or increase (h>1) in the elements of λwc. Since λ1 is fixed, the parameter h also measures the degree of overlap (or similarity) between the two diseases' ASFOIs. It is clear, in this case, that the overlapping degree between the ASFOIs of the two diseases decreases as h decreases. By plotting the two-disease bifurcation diagram using h as the control parameter (figure 4), we find that the two diseases always exhibit biennial cycles, but the difference between successive annual peaks in disease 2 becomes increasingly small as h decreases, until the cycles look virtually annual. Since, for the same parameter values, the single-disease model predicts annual cycles for disease 2, these results suggest that two diseases exert a strong dynamical effect on each other when they infect children in similar age cohorts. The extent of interference is substantially weaker when they typically infect children in dissimilar age groups.
Figure 4.
A one-parameter bifurcation diagram and example time-series for the two-disease age-structured model. In all panels, diseases 1 and 2 are identified by black and grey, respectively. A1 and A2 represent, respectively, the mean age at infection for diseases 1 and 2. Disease 1 has the same epidemiological traits as measles (table 1), whereas disease 2 has the same epidemiological traits as whooping cough except that the force of infection is assumed to be λ2=hλwc, where λwc is the force of infection for whooping cough (table 1). The seasonal amplitude is fixed at b=0.2.
In the second case, disease 1 represents whooping cough, while disease 2 has exactly the same epidemiological traits as disease 1 except that the ASFOI is assumed to be λ2=hλ1=hλwc, with h as defined earlier. We find that as h decreases, the average prevalence level in disease 2 becomes increasingly low, but there are no significant changes in the amplitude of cycles (figure 5).
Figure 5.
A one-parameter bifurcation diagram and example time-series for the two-disease age-structured model. In all panels, diseases 1 and 2 are identified by black and grey, respectively. A1 and A2 represent, respectively, the mean age at infection for diseases 1 and 2. Disease 1 has the same epidemiological traits as whooping cough (table 1). Disease 2 also has the same epidemiological traits as whooping cough except that the force of infection is assumed to be λ2=hλwc. The seasonal amplitude is fixed at b=0.2.
In the third case, disease 1 represents measles, while disease 2 represents an infection with exactly the same epidemiological parameters as whooping cough except that the ASFOI distribution λ2 is allowed to vary from in the following manner:
| 3.1 |
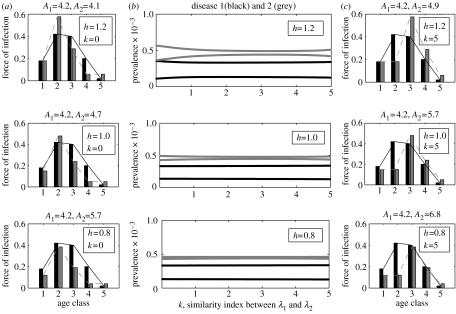
where λ2j and are, respectively, the jth elements of λ2 and λwc. Another index introduced to describe the relative difference of λ2 from λwc is k∈[0,5]. It can be seen that, for fixed h, the mean age at infection for disease 2 increases as k increases. In particular, λ2=λwc when h=1, k=0. Since the ASFOI for disease 1 is fixed, one can also see that the ASFOI for disease 2 becomes increasingly different from that for disease 1 as k increases.
To track the changes in the interference strength as k increases, we analyse the bifurcation diagrams for the two-disease model, where k is the control parameter (see figure 6c). In each diagram (which corresponds to a fixed h), it can be observed that the difference between successive annual peaks in disease 2 becomes increasingly small as k increases. For fixed k, there is also a similar trend as h decreases (see also figure 4, where h is the control parameter, while k=0). In all three diagrams, disease 1 (measles) exhibits rigidly biennial cycles. Since disease 1 alone exhibits biennial cycles and disease 2 alone always exhibits annual cycles for the same epidemiological parameters, the results suggest again that interference between the two diseases is relatively strong when they infect children with similar ages, and is relatively weak when they infect children with relatively different ages.
Figure 6.
Bifurcation diagrams for the two-disease age-structured model illustrating (b) the two-disease dynamics as a function of the similarity index k for some different values of h, and (a, c) the two diseases' ASFOIs for some pairs of h, k. The precise meaning of h and k can be found in the main text (see § 3.1). In all panels disease 1 is identified by black, disease 2 by grey. Seasonal amplitude b≡0.2.
4. Conclusions and discussion
Using the age-structured two-disease framework, we have systematically explored potential ecological interference between different diseases resulting from convalescence following infection with a competitor. Our analysis reinforces the previous conclusion that disease interference can have important dynamical consequences (Rohani et al. 1998, 2003; Huang & Rohani 2005). More importantly, this work demonstrates that the extent of any interference effect crucially depends on whether the protagonist diseases infect the same cohort of hosts, or, more precisely, on the degree of overlap between their distributions of age at infection. Our comparative numerical study has focused on the interactions of measles with whooping cough, chickenpox and rubella, which have roughly the same infectious periods. In all three cases, interactions via fluxes in susceptible numbers result in competing infections entrained onto the measles pattern of epidemics. As shown by Huang & Rohani (2005), this dynamical domination of measles is due to its relatively higher transmission rate.
The results presented here also demonstrate that measles dynamics may be influenced by the presence of competing infections, which effectively reduces the amplitude of seasonality required for biennial oscillations to occur. Such an influence can be clearly observed in the measles–whooping cough interaction, where the bifurcation from annual to biennial occurs for a smaller seasonal amplitude, compared to the measles alone SEIR (susceptible, exposed, infectious, recovered) model. In contrast, the interaction between measles and rubella has almost no discernible influence on measles dynamics.
The present mathematical framework, which takes age-structured details into account, has increased our understanding of the issue of when diseases might interfere. It has been demonstrated by simple age-independent models that the interference effects are most pronounced between infections with a similar basic reproductive ratio. However, a complete understanding of the issue cannot be achieved without taking into account the precise distributions of age at infection. This is simply because diseases having similar basic reproductive ratios or mean ages at infection may have quite different age-structured profiles.
In our age-structured two-disease model, we did not consider some important factors that are relevant to disease dynamics, such as co-infection, cross-immunity and vaccination. Our strategy was to focus on relatively simple scenarios by which we can effectively compare the dynamic patterns among different pairs of childhood infections, and to explore the age-structured effects on disease interference. Further exploration of the issue by more generalized models is needed in the future.
An important question that is implicit in this study concerns the extent to which we have to consider the influence of competing diseases when we try to understand epidemiological data. The present work has partially answered the question from the perspective of age-structured effects within a deterministic framework. To test model predictions, we would need reliable incidence data for measles, whooping cough, chickenpox and rubella from the same geographical location, covering the same period of time. Unfortunately, we currently do not have access to such data. Previous studies exploring interference effects between measles and whooping cough have uncovered little empirical support in case notification data from England and Wales in the 1950s and 1960s (Rohani et al. 1998). European case fatality data, however, exhibit patterns that are consistent with disease interference, leading Rohani et al. (2003) to propose that interaction between infections is substantially more pronounced when disease is associated with a significant risk of death. Ultimately, these findings suggest, perhaps, that in most developed countries factors such as demographic and environmental stochasticity may well mask any interference effects. The high risk of mortality following infection may mean that understanding the epidemiology of the infections considered here from developing world data, however, would be incomplete if only a single infection is considered.
Acknowledgements
This work was supported by the National Science Foundation, the National Institutes of Health and a New Scholar Award from the Ellison Medical Foundation to P.R. We thank Helen Wearing, Dan Vasco, Marc Choisy and Matt Bonds for discussions. We also thank three anonymous referees for their helpful comments.
Appendix A. The age-structured two-disease SEICR model
Let x, ei, yi, ui, vi, fi and zi be, respectively, the density of individuals susceptible to both disease, individuals initially exposed to disease i, disease i infectious individuals who have not been infected by the other disease, disease i infected individuals in convalescence, individuals susceptible to disease i who have been immune to the other disease, individuals exposed to disease i who are immune to the other disease and disease i infectious individuals who have previously been infected with (and are immune to) the other disease. According to the simplified epidemiological life history described in the main text, the interaction between two diseases can be described by the following system of partial differential equations (where the meaning of the parameters is given in table 2):
| A1 |
| A2 |
| A3 |
| A4 |
| A5 |
| A6 |
| A7 |
| A8 |
| A9 |
| A10 |
| A11 |
| A12 |
| A13 |
with initial conditions
| A14 |
and boundary conditions
| A15 |
where
| A16 |
is the force of infection for the disease i infectives of cohort a at time t. The function βi(a, α, t) describes the age- and time-related transmission rate (see table 2).
Table 2.
Brief description of parameters.
| parameter | description |
|---|---|
| λi(a, t) | probability per unit time that a susceptible of age a is infected with disease i at time t |
| βi(a, α, t) | probability per unit time that a disease i infective of age α will infect a susceptible of age a at time t |
| μ | age-independent per-capita natural death rate |
| ρi | age-independent probability of disease i infectives dying during the convalescent period (0≤ρi≤1) |
| 1/σi | age-independent average latent period of disease i infectives |
| 1/γi | age-independent average infectious period of disease i infectives (prior to being quarantined) |
| 1/δi | age-independent average convalescent period for disease i infectives |
In application, individuals fall into age groups. The model can be easily reformulated in this case. For instance, the equation for the fraction of individuals of age cohort j susceptible to both diseases (with density xj) is
| A17 |
| A18 |
| A19 |
Here, n=5 is the number of age classes. lj is the per-capita rate at which individuals enter or leave the age cohort j. λ1j(t) and λ2j(t) are, respectively, the time-dependent ASFOI for diseases 1 and 2:
| A20 |
where βi(k, j, t) corresponds to the (k, j) element of the contact matrix C defined in §2. Namely, we use ckj instead of βkj to denote the contact rate between age class k and j in the discrete-age models. For each disease i, the contact matrix has only five different elements cj (j=1, …, 5) which can be calculated by the following procedure.
The contact rates depend not only on the age structure of the host, but also on the seasonality of school terms. The function mimicking the seasonal forcing may vary from a continuous sine wave to a discontinuous binary one (Dietz 1976; Schenzle 1984). We chose the binary one in this paper. Since children in age class 2 and 3 (6–15 year olds) experience the strongest seasonality, we assume that
| A21 |
and that
| A22 |
where denotes the average transmission rate which can be estimated from data-derived ASFOI, b∈[0,1] is the seasonal amplitude, and fseas(t) is the term-time forcing defined as
| A23 |
in which [t] represents the maximum integer less than t (Bolker 1993).
References
- Anderson R.M, May R.M. The control of communicable diseases by age-specific immunisation schedules. Lancet. 1982a;1:160. doi: 10.1016/s0140-6736(82)90396-8. 10.1016/S0140-6736(82)90396-8 [DOI] [PubMed] [Google Scholar]
- Anderson R.M, May R.M. Directly transmitted infectious diseases: control by vaccination. Science. 1982b;215:1053–1060. doi: 10.1126/science.7063839. [DOI] [PubMed] [Google Scholar]
- Anderson R.M, May R.M. Vaccination and herd immunity to infectious diseases. Nature. 1985a;318:323–329. doi: 10.1038/318323a0. 10.1038/318323a0 [DOI] [PubMed] [Google Scholar]
- Anderson R.M, May R.M. Age-related changes in the rate of disease transmission: implications for the design of vaccination programmes. J. Hyg. Camb. 1985b;94:365–436. doi: 10.1017/s002217240006160x. [DOI] [PMC free article] [PubMed] [Google Scholar]
- Anderson R.M, May R.M. Oxford University Press; Oxford, UK: 1991. Infectious diseases of humans. [Google Scholar]
- Bolker B.M. Chaos and biological complexity in measles dynamics: a comparative numerical study. IMA J. Math. Appl. Med. Biol. 1993;10:83–95. doi: 10.1093/imammb/10.2.83. [DOI] [PubMed] [Google Scholar]
- Bolker B.M, Grenfell B.T. Chaos and biological complexity in measles dynamics. Proc. R. Soc. B. 1993;251:75–81. doi: 10.1098/rspb.1993.0011. [DOI] [PubMed] [Google Scholar]
- Creighton C. A history of epidemics in Britain. Cambridge University Press; Cambridge, UK: 1894. [Google Scholar]
- Dietz K. The incidence of infectious diseases under the influences of seasonal fluctuations. Lect. Notes Biomath. 1976;11:1–15. [Google Scholar]
- Dietz K, Schenzle D. Proportionate mixing models for age-dependent infection transmission. J. Math. Biol. 1985;22:117–120. doi: 10.1007/BF00276550. 10.1007/BF00276550 [DOI] [PubMed] [Google Scholar]
- Earn D.J.D, Rohani P, Bolker B.M, Grenfell B.T. A simple model for complex dynamical transitions in epidemics. Science. 2000;287:667–670. doi: 10.1126/science.287.5453.667. [DOI] [PubMed] [Google Scholar]
- Farrington C.P. Modelling forces of infection for measles, mumps and rubella. Stat. Med. 1990;9:953–967. doi: 10.1002/sim.4780090811. [DOI] [PubMed] [Google Scholar]
- Farrington C.P, Kanaan M.N. Estimation of the basic reproduction number for infectious diseases from age-stratified serological survey data. Appl. Stat. 2001;50:251–292. [Google Scholar]
- Ferguson N.M, Nokes D.J, Anderson R.M. Dynamical complexity in age-structured models of the transmission of the measles virus: epidemiological implications at high level of vaccine uptake. Math. Biosci. 1996;138:101–130. doi: 10.1016/s0025-5564(96)00127-7. 10.1016/S0025-5564(96)00127-7 [DOI] [PubMed] [Google Scholar]
- Greenhalgh D. Threshold and stability results for an epidemic models with an age-structured meeting rate. IMA J. Math. Appl. Med. Biol. 1988;5:81–100. doi: 10.1093/imammb/5.2.81. [DOI] [PubMed] [Google Scholar]
- Greenhalgh D, Dietz K. Some bounds on estimates for reproductive ratios derived from age-specific force of infection. Math. Biosci. 1994;124:9–57. doi: 10.1016/0025-5564(94)90023-x. 10.1016/0025-5564(94)90023-X [DOI] [PubMed] [Google Scholar]
- Greenman J, Kamo M, Boots M. External forcing of ecological and epidemiological systems: a resonance approach. Phys. D—Nonlinear Phenom. 2004;190:136–151. 10.1016/j.physd.2003.08.008 [Google Scholar]
- Grenfell B.T, Anderson R.M. Estimation of age related rates of infection from case notifications and serological data. J. Hyg. 1985;95:419–436. doi: 10.1017/s0022172400062859. [DOI] [PMC free article] [PubMed] [Google Scholar]
- Hethcote H.W. Optimal age of vaccination for measles. Math. Biosci. 1988;89:28–52. 10.1016/0025-5564(88)90111-3 [Google Scholar]
- Hethcote H.W. An age-structured model for pertussis transmission. Math. Biosci. 1997;145:89–136. doi: 10.1016/s0025-5564(97)00014-x. 10.1016/S0025-5564(97)00014-X [DOI] [PubMed] [Google Scholar]
- Huang Y, Rohani P. The dynamical implications of disease interference: correlations and coexistence. Theor. Popul. Biol. 2005;68:205–215. doi: 10.1016/j.tpb.2005.06.004. 10.1016/j.tpb.2005.06.004 [DOI] [PubMed] [Google Scholar]
- Inaba H. Threshold and stability results for an age-structured epidemic model. J. Math. Biol. 1990;28:411–434. doi: 10.1007/BF00178326. 10.1007/BF00178326 [DOI] [PubMed] [Google Scholar]
- Keeling M.J, Rohani P, Grenfell B.T. Seasonally forced disease dynamics explored as switching between attractors. Physica D. 2001;148:317–335. 10.1016/S0167-2789(00)00187-1 [Google Scholar]
- Laing J.S, Hay M. Whooping-cough: its prevalence and mortality in Aberdeen. Public Health. 1902;14:584–598. [Google Scholar]
- Rohani P, Earn D.J, Finkenstadt B, Grenfell B.T. Population dynamic interference among childhood diseases. Proc. R. Soc. B. 1998;265:2033–2041. doi: 10.1098/rspb.1998.0537. 10.1098/rspb.1998.0361 [DOI] [PMC free article] [PubMed] [Google Scholar]
- Rohani P, Keeling M.J, Grenfell B.T. The interplay between determinism and stochasticity in childhood diseases. Am. Nat. 2002;159:469–481. doi: 10.1086/339467. 10.1086/339467 [DOI] [PubMed] [Google Scholar]
- Rohani P, Green G.J, Mantilla-Beniers N.B, Grenfell B.T. Ecological interference between fatal diseases. Nature. 2003;422:885–888. doi: 10.1038/nature01542. 10.1038/nature01542 [DOI] [PubMed] [Google Scholar]
- Schenzle D. An age-structured model of pre- and post-vaccination measles transmission. IMA J. Math. Appl. Med. Biol. 1984;1:169–191. doi: 10.1093/imammb/1.2.169. [DOI] [PubMed] [Google Scholar]
- Whitaker H.J, Farrington C.P. Estimation of infectious disease parameters from serological survey data: the impact of regular epidemics. Stat. Med. 2004;23:2429–2443. doi: 10.1002/sim.1819. 10.1002/sim.1819 [DOI] [PubMed] [Google Scholar]


