Abstract
In the past few years, the framework of complex networks has provided new insight into the organization and function of biological systems. However, in spite of its potential, spatial ecology has not yet fully incorporated tools and concepts from network theory. In the present study, we identify a large spatial network of temporary ponds, which are used as breeding sites by several amphibian species. We investigate how the structural properties of the spatial network change as a function of the amphibian dispersal distance and the hydric conditions. Our measures of network topology suggest that the observed spatial structure of ponds is robust to drought (compared with similar random structures), allowing the movement of amphibians to and between flooded ponds, and hence, increasing the probability of reproduction even in dry seasons.
Keywords: complex networks, environmental stochasticity, graph-theory, habitat fragmentation, metapopulation, spatial ecology
1. Introduction
The network approach describing a set of nodes connected by links is a very useful framework to represent many physical, biological and social systems (see Albert et al. 2000; Strogatz 2001; Newman 2003; Proulx et al. 2005). In spite of its potential, however, network analysis techniques have only been used in ecology to characterize food webs (Pimm 1982; Cohen et al. 1990; Dunne et al. 2002; Melián & Bascompte 2002) and, more recently, plant–animal mutualistic interactions (Bascompte et al. 2003; Jordano et al. 2003).
Previous work has suggested the suitability of the network approach to the study of spatial ecology (Cantwell & Forman 1993; Urban & Keitt 2001), but only few attempts incorporate basic properties of network theory (Keitt et al. 1997; Bunn et al. 2000; Urban & Keitt 2001; Fagan 2002). In some cases, it is convenient to link habitat fragments whenever movement from one to another can be performed by a target species (landscape network models (Keitt 2003); spatially realistic models (Hanski 2001)). Analysis of network topology provides a new and straightforward way to quantify the robustness of a patchy population to habitat loss and the identification of ‘keystone’ patches that are critical to landscape connectivity and hence population persistence (Urban & Keitt 2001; Keitt 2003). Detailed information on network structure can also form the template or skeleton to superimpose metapopulation dynamics (Hanski & Simberloff 1997; Hanski 1998).
The spatio-temporal dynamics of amphibian populations can be adequately described by using spatial networks because (i) breeding ponds form discrete habitat patches (hereafter ponds or nodes) that can be easily identified and delimited (Gibbs 1993; Semlitsch & Bodie 1998; Marsh & Trenham 2001); (ii) amphibians' limited dispersal prevents them from reaching many ponds in the area (Marsh et al. 1999; Smith & Green 2005); and (iii) most amphibian species show high site fidelity, returning each breeding season to the same pond they previously reproduced in (Shields 1982).
Amphibian population dynamics is largely determined by the success of individual dispersal among breeding sites, which in turn depends on the spatial distribution of ponds (e.g. Marsh & Trenham 2001; Smith & Green 2005). Although amphibians cannot migrate long distances due to physiological limitations induced by water loss and thermoregulatory need, dispersal distances may not be as limited as has traditionally been suggested. As a group, amphibians exhibit a wide range of dispersal distances (see Smith & Green 2005). Previous studies have explored the importance of the density and distribution of wetlands (Laan & Verboom 1990; Gibbs 1993; Semlitsch & Bodie 1998; Marsh et al. 1999), but there is not a single study focusing on the structure of the whole network of ponds of an area and its role in amphibian persistence.
The bulk of studies on networks have assumed a fixed structure through time. While this is a good assumption for several systems, spatial networks of temporary ponds are highly variable in time. The highly fluctuating levels of drought may act as random deletions of some nodes, and thus we can talk of stochastic networks.
In this paper, we identify a large spatial network of temporary ponds, which are used as breeding sites by several amphibian species. We show that the alteration by drought of this undisturbed network not only reduces the total number of ponds where amphibians can reproduce and successfully recruit metamorphosing juveniles, but also changes the structural properties of the remaining pond network with implications for amphibian persistence. To account for the effect of spatial scale (Wiens 1989) on network structure, we consider three hypothetical groups of amphibians with different dispersal distances. Because landscape networks can easily be constructed from existing habitat maps, our approach has direct applications to conservation planning in wetlands.
2. Material and methods
(a) Spatial pond network
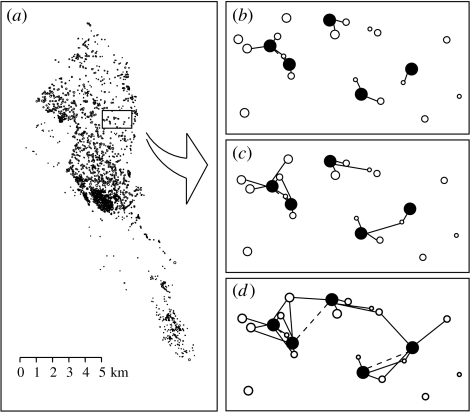
An image obtained from an airborne hyperspectral spectrometer was used to identify and locate 3335 temporary ponds (see figure 1a) in Doñana National Park (southwestern Spain). The image was taken in the period of maximum inundated area (April 2004), and the sizes of the ponds range from 25 to 550 500 m2. Because water has low reflectance in the band of the low and medium infrared, it is straightforward to identify the ponds within the matrix habitat. Aerial photographies and ground-truthing were used to assess the accuracy of the pond locations.
Figure 1.
(a) Spatial location of the ponds (circles; size is proportional to area on a logarithmic scale) in Doñana National Park. (b–d) Schematic representation of a subset of ponds linked by different dispersal distances d of three hypothetical amphibian groups ((b) d=100 m; (c) d=500 m; and (d) d=1000 m). Black nodes and white nodes represent flooded and dry ponds, respectively. Solid lines indicate directed links between dry and flooded ponds. Broken lines represent undirected links between flooded ponds. Note that we can identify network components (i.e. groups of interlinked flooded ponds) at different scales.
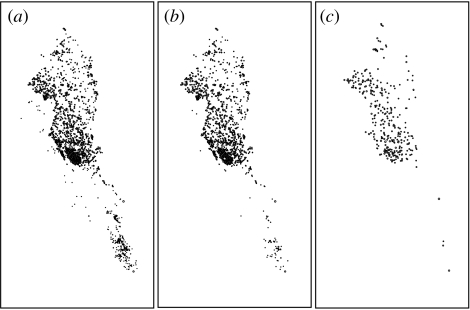
Temporarily flooded Mediterranean ponds are highly fluctuating. The risk of reproduction failure in Mediterranean amphibians depends on both the length of the hydroperiod and the delay or lack of annual rainfalls (Jakob et al. 2003). Hydroperiod is a critical determinant of amphibian population success and community structure in diverse ecosystems (e.g. Wellborn et al. 1996; Skelly et al. 1999). The hydroperiod is determined by pond surface area, depth and canopy cover among other factors (Werner & Glennemeier 1999; Skelly et al. 2002). In order to explore the effects of drought on the pond network, we simulate the progressive drying of flooded ponds, starting from the smallest pond and proceeding towards the largest one at regular intervals (see figure 2). Considering other factors influencing the length of the hydroperiod can alter the temporal sequence in which ponds dry out. But the bulk of ponds will probably follow the same sequence because pond depth and area are highly correlated. Note also that we only have information on pond position and area, which justifies our approximation. Still, this is one of the largest and most detailed spatial networks so far. Our procedure mimics, in this sense, the environmental effects of drought assuming that smaller ponds are the first to dry out. This assumption, however, is relaxed later on (see §2c).
Figure 2.
Maps of the spatial distribution of the flooded ponds under different drought levels (i.e. fraction of dry ponds, p). (a) p=0.1; (b) p=0.5; and (c) p=0.9.
In this paper, we consider two types of node: flooded and dry ponds. We assume that amphibians move from dry to flooded ponds within their dispersal distance in order to reproduce. This is a robust assumption despite the fact that some amphibian species have been reported to skip the breeding season if their local ponds become dry (Gibbs 1993; Jakob et al. 2003). We consider two types of hypothetical link that show the potential dispersal movement of amphibians between ponds: directed links from dry to flooded ponds (indicating one-way movement), and undirected links between flooded ponds (indicating two-way movement, see figure 3).
Figure 3.
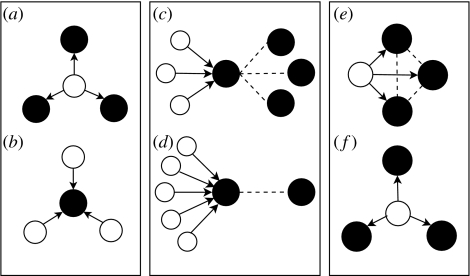
(a, b) Schematic representation of directed links of (a) a dry and (b) a flooded pond. Note that the direction of the link goes always from dry to flooded ponds simulating amphibian movement. (c, d) Schematic representation of two scenarios relating directed and undirected links of a flooded pond, correlation r. (e, f) Schematic representation of the clustering coefficient C among the flooded ponds connected to a dry pond ((e) C=1; (f) C=0).
Doñana National Park has an extremely high amphibian species richness (Mateo et al. 1998) belonging to all the families present in the Iberian Peninsula (Salamandridae, Discoglossidae, Pelobatidae, Pelodytidae, Bufonidae, Hylidae and Ranidae). Maximum dispersal distances of these species are not well known but we can assign the groups of toads, frogs and newts with dispersal distances of 1000, 500 and 100 m, respectively. In this sense, we have considered these three hypothetical dispersal distances corresponding also to a wide reported suite of amphibian species (Smith & Green 2005). For each level of drought, we calculate the relative frequency of all the potential links among ponds located within the maximum dispersal range (see figure 1b–d for a schematic representation). Pairwise distances among ponds are measured as the Euclidean distance from centroid to centroid of the two respective ponds (Urban & Keitt 2001). The matrix habitat is assumed to be homogeneous, so the cost of amphibian movement is proportional to distance, but not to the direction of movement (see, however, Stevens et al. 2004)
(b) Network topology measures
There are several measures to describe network topology (see Newman 2003). The simplest measure is the number of links per node (i.e. its degree). Here, we are interested in the directed degree of both dry and flooded ponds (figure 3a,b).
Real-life networks may show several degree distributions reflecting their architecture and robustness. Some networks such as the power-grid of Southern California show an exponential distribution (Watts & Strogatz 1998), and others such as the World Wide Web show a power-law (or scale-free) distribution (Albert et al. 2000). An exponential distribution implies that nodes have a well-defined average number of links. A power-law distribution, on the other hand, indicates a much higher variability in the number of links per node. That is, the bulk of nodes have a few links, but a few nodes are much more connected than expected by chance. A power-law distribution is much more right-skewed than an exponential one. The rationale for considering this measure of topology lies behind the fact that the pattern of degree distribution greatly affects the robustness of the network to node deletion (Albert et al. 2000). Scale-free, heterogeneous networks are very robust to random removal of nodes, but very fragile to the removal of the most connected nodes. The stronger this robustness/fragility pattern grows the higher the skewness of the degree distribution. Also, we want to assess to what extent the degree distribution affects the movement of amphibians across the pond network. Specifically, to how many flooded ponds can amphibians go from a dry pond? (figure 3a), and from how many dry ponds can amphibians arrive to a flooded pond? (figure 3b).
Another interesting measure of network structure is the correlation r between the directed degree and the undirected degree of flooded ponds with non-zero degrees (see figure 3c,d). This gives an idea of the role of a flooded pond connecting dry and flooded ponds through itself. Imagine that as drought increases, flooded ponds are neither isolated nor surrounded by dry ponds, but surrounded by other flooded ponds. Amphibians could then move from one flooded pond to another in the case where the former goes dry. In this case, a positive correlation would indicate that some ponds act as stepping stones, linking a large number of dry and flooded ponds and thus favouring amphibian dispersal (see figure 3c). Drought may create a bottleneck scenario with lots of dry ponds connected to a single, isolated flooded pond (or to a one connected pond, see figure 3d). But this can be ameliorated if r is high. Here, we explore how this correlation changes as the level of drought increases.
The clustering coefficient, C, measures the local group cohesiveness (see Newman 2003) and is defined, for any dry pond with non-zero directed degree in this case, as the fraction of total possible links that are realized between the flooded ponds that are linked to that dry pond (figure 3e,f). C is one if all flooded ponds linked to a dry one are also linked among themselves (figure 3e). On the other hand, C is zero if none of the flooded ponds linked to a dry pond are linked among themselves (figure 3f). The diverse habitat requirements of amphibians do not allow them to breed in all flooded ponds (Smith & Green 2005). A high clustering coefficient provides the chance for an amphibian who has moved from a dry to a flooded pond to move again to another flooded pond if the former one is not suitable for reproduction.
(c) Null models to test robustness
We have developed two null models to test network robustness. In the first one (null model 1), we have randomized the spatial locations of the ponds. In the second null model, we have randomly allocated the sizes of the ponds keeping their spatial locations. With null model 1, we can assess the effect of the spatial distribution of the ponds, and with null model 2, we can assess the effect of the spatial distribution of pond sizes, and hence, the effect of the temporal sequence in which ponds dry out.
3. Results
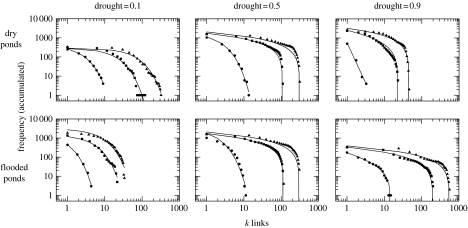
The cumulative directed degree distributions of dry and flooded ponds are shown in figure 4. Distributions for both dry and flooded ponds show a shift from exponential to truncated power-law as drought increases (this is clearer when amphibians have higher dispersal ability). Thus, the spatial network of ponds becomes very heterogeneous. This result indicates that as drought increases, the directed degree of dry ponds decreases because there are less flooded ponds but a few of them maintain a high number of links with the decreasing number of flooded ponds. Similarly, the decreasing number of flooded ponds increases their directed degree, and a few of them gather a high number of links with the increasing number of dry ponds. Therefore, as drought increases, a few flooded ponds can potentially receive amphibians from a high number of dry ponds. These flooded ponds are thus very relevant for the maintenance of the whole spatial network (keystone ponds). In contrast, dry ponds are usually linked to few flooded ones.
Figure 4.
Cumulative directed degree distributions for both types of pond under different drought levels (i.e. fraction of dry ponds), and amphibian dispersal ability d (d=100 m (circles), d=500 m (squares), and d=1000 m (triangles)). The number of ponds with at least k links decreases following different functions. For drought=0.1, the best fit is an exponential distribution in all cases, p<0.001. For drought=0.5, the best fit is an exponential distribution for d=100, and truncated power-law in the rest of cases, p<0.001. For drought=0.9, the best fit is to a truncated power-law in all cases (except d=100 for dry ponds, for which the best fit is a power-law), p<0.001.
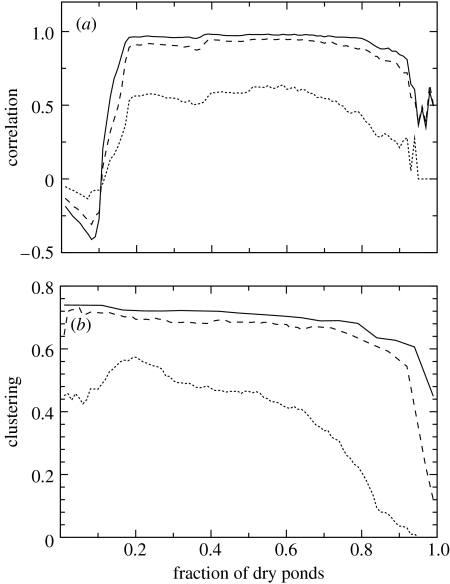
The correlation r between directed and undirected degrees of flooded ponds has several phases depending on the value of drought (figure 5a). This correlation first increases faster than expected just based on the balance between the number of dry and flooded ponds. The high value of r, present in most of the range of drought, implies that a flooded pond can act as a stepping stone linking multiple dry and flooded ponds. This effect is observed until high values of drought, for which r decays. The same tendency can be observed for the different dispersal distances considered, which suggests that our results on network structure are not dependent on the particular scale of dispersal, a parameter difficult to measure in the field.
Figure 5.
Relationships between (a) the directed and undirected link correlation r of a flooded pond and (b) clustering coefficient C, and drought intensity (i.e. fraction of dry ponds). Dispersal distance is d=1000 m (solid line), d=500 m (broken line) and d=100 m (dotted line).
The clustering coefficient remains high through almost all the gradient of drought (figure 5b), although it is lower for short dispersal distances. As drought increases, the clustering coefficient among the remaining ponds increases because the ponds disappearing are the ones less connected to the other ones (remember that the clustering coefficient is the fraction of connections among all the possible ones, see figure 3e,f).
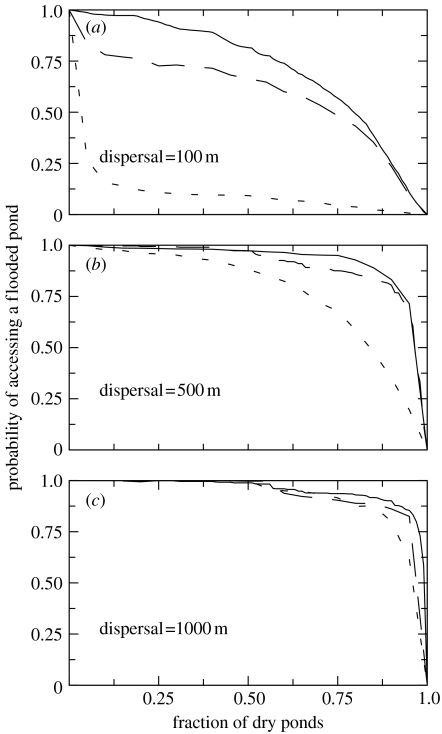
Arguably, the strongest evidence of the robustness of the network of ponds to drought is the high probability of an amphibian moving from a dry pond to a flooded one when we compare real network structure with the two null models (figure 6). This high probability is a consequence of the structure of the network of ponds uncovered by the previous measures. As shown in figure 6, this probability of movement remains high as drought increases, only decaying when the fraction of dry ponds is really high. Once more, the structure of the network of ponds helps to maintain potential dispersal connections between dry and flooded ponds despite drought. Note that the robustness of the real network (i.e. the difference between the behaviour for the real and the randomized networks) is higher for low dispersal distances (figure 6a). Null model 1 randomizes pond size, and so allows us to explore the role of the sequence by which ponds dry out (they dry out now in a different order than for the real network). By comparing the pattern for the actual network and their randomization through null model 1 (figure 6), we can see that the difference is small, so results are quite robust to differences in the assumed order by which ponds dry out. However, the difference between the real spatial position of ponds and the randomization by null model 2 is much larger. As a consequence, the structure of the network of ponds in Doñana National Park is very robust to drought mainly for amphibians with limited dispersal distances.
Figure 6.
Probability of moving from a dry to a flooded pond for three dispersal distances, (a) 100 m, (b) 500 m and (c) 1000 m, along all the gradient of drought intensity. Solid line, broken line and dotted line represent real data, null model 1 and null model 2, respectively.
4. Discussion
We have shown that a network approach is a useful tool for assessing the relevance of the spatial distribution of amphibian breeding sites and the consequences of their selective disappearance. This network approach goes back to the paper by Urban & Keitt (2001), but unfortunately has not been developed since then. While the few previous papers on spatial networks focus on a static landscape, here we introduce changes in this landscape driven by a gradient associated to a well-defined environmental force. We are able to assess how network structure changes across this environmental gradient. We can then quantify landscape robustness to increasing levels of drought compared with two spatial null models.
Our network approach allows the identification of macroscopic, network-wide patterns influencing the persistence of patchy populations. Network topology measures combined with null models suggest that the spatial structure of the ponds is robust to drought, allowing the movement of amphibians to and between flooded ponds. That is, even when drought reduces the number of flooded ponds, the spatial network structure linking the remaining ponds is such that it minimizes the negative effects of drought (mainly for low dispersal). This could explain why Doñana National Park is a successful amphibian breeding area (Mateo et al. 1998) even though it experiences frequent droughts. Note that other factors influencing hydroperiod such as pond depth and tree canopy cover can alter slightly the results presented here. However, the temporal sequence of pond removal has a very small effect compared with random removal.
The network approach presented here is particularly relevant for amphibian populations for two reasons. First, our paper extends the ‘ponds-as-patches’ approach (Marsh & Trenham 2001). Marsh & Trenham (2001) have criticized the applicability of the metapopulation paradigm in amphibians because many species regularly disperse between ponds. Thus, groups of ponds are a more meaningful unit of management than individual ponds. Our measures of network structure account for such a movement among patches and naturally defines groups of interlinked ponds as ecological units (see figure 1b–d). Second, few systems are as fluctuating as Mediterranean networks of ponds. The effect of habitat patch deletion simulated here plays a major role in the population dynamics of amphibians inhabiting such fluctuating networks of ponds.
From the point of view of network theory, our results extend previous work focusing on network robustness to node deletion. As shown by Albert et al. (2000), structure greatly affects robustness. The work by Keitt et al. (1997) on spatial networks focuses on node deletion reproducing the loss of forest fragments due to timber harvesting. In our system, the removal of nodes is neither random nor proceeding from the most connected ones. Ponds are removed as a function of their area (smaller ponds get dry earlier). The network of ponds seems to be very robust to this particular disturbance.
Only recently, space has been introduced into the analysis of complex networks. Previous studies (Barthélémy 2003; Guimera et al. 2005) have reported that network topology is affected by the spatial extension of the network. When considering that the network is not homogeneous but distributed in space, some nodes may be too far away, which reduces the probability of connecting to them. This produces a shift from a power-law to a truncated power-law distribution (Barthélémy 2003). The same shift is observed here when the level of drought and so the distance to flooded ponds increases. Spatial constraints in communication and transportation networks also favour the formation of clusters between spatially close nodes (Guimera et al. 2005), a result we also observe in the network of ponds (figure 5b). This is the reason behind the observed high value of the clustering coefficient.
The case study that we have discussed so far demonstrates that the application of existing network approaches to patchy populations can yield valuable insight. Network analysis is a powerful tool for analysing real landscapes and can be used as a basis for building more complex population viability models. For example, information on network structure can be integrated with optimization techniques to select a subset of available habitats that maximize species persistence (see Cabeza & Moilanen 2001 and references therein). Spatial network theory characterizes the structure of the physical template. On this template, colonization and extinction events would determine metapopulation dynamics. Future work linking structure and dynamics will provide insight on to what extent the novel levels of spatial structure described here will determine the regional abundance of a metapopulation.
Acknowledgements
We thank C. Díaz-Paniagua, C. J. Melián and P. Jordano for helpful discussions, and J. Bustamante, R. Díaz-Delgado and D. Aragonés (LAST-EBD) for technical support during the elaboration of the map. C. A. Pacheco (IGME) kindly gave us access to an AHS airbone image of the area taken by the Remote Sensing Laboratory from INTA on 27 April 2004. A. Moilanen, B. Wintle and two anonymous referees have contributed largely to improve the manuscript. This work was funded by the Spanish Ministry of Science and Education (Fellowships BES-2004-6682 to M.A.F. and AP-2001-3475 to C.G.-R., Grants REN 2003-04774 to J.B. and REN 2002-03759/GLO to C. Díaz-Paniagua), and the European Heads of Research Councils and the European Science Foundation through an EURYI award (to J.B.).
References
- Albert R, Jeong H, Barabási A.-L. Attack and error tolerance in complex networks. Nature. 2000;406:387–482. doi: 10.1038/35019019. [DOI] [PubMed] [Google Scholar]
- Barthélémy M. Crossover from scale-free to spatial networks. Europhys. Lett. 2003;63:915–921. 10.1209/epl/i2003-00600-6 [Google Scholar]
- Bascompte J, Jordano P, Melián C.J, Olesen J.M. The nested assembly of plant–animal mutualistic networks. Proc. Natl Acad. Sci. USA. 2003;100:9383–9387. doi: 10.1073/pnas.1633576100. 10.1073/pnas.1633576100 [DOI] [PMC free article] [PubMed] [Google Scholar]
- Bunn A.G, Urban D.L, Keitt T.H. Landscape connectivity: a conservation application of graph theory. J. Environ. Manage. 2000;59:265–278. 10.1006/jema.2000.0373 [Google Scholar]
- Cabeza M, Moilanen A. Design of reserve networks and the persistence of biodiversity. Trends Ecol. Evol. 2001;16:242–248. doi: 10.1016/s0169-5347(01)02125-5. 10.1016/S0169-5347(01)02125-5 [DOI] [PubMed] [Google Scholar]
- Cantwell M.D, Forman R.T.T. Landscape graphs: ecological modeling with graph theory to detect configurations common to diverse landscapes. Landscape Ecol. 1993;8:239–251. 10.1007/BF00125131 [Google Scholar]
- Cohen J.E, Briand F, Newman C.M. Community food webs: data and theory. Springer; Berlin, Germany: 1990. [Google Scholar]
- Dunne J, Williams R.J, Martinez N.D. Network structure and biodiversity loss in food webs: robustness increases with connectance. Ecol. Lett. 2002;5:558–567. 10.1046/j.1461-0248.2002.00354.x [Google Scholar]
- Fagan W.F. Connectivity, fragmentation, and extinction risk in dendritic metapopulations. Ecology. 2002;83:3243–3249. [Google Scholar]
- Gibbs J.P. Importance of small wetlands for the persistence of local populations of wetland-associated animals. Wetlands. 1993;13:25–31. [Google Scholar]
- Guimera R, Mossa S, Turtschi A, Amaral L.A.N. The worldwide air transportation network: anomalous centrality, community structure, and cities' global roles. Proc. Natl Acad. Sci. USA. 2005;102:7794–7799. doi: 10.1073/pnas.0407994102. 10.1073/pnas.0407994102 [DOI] [PMC free article] [PubMed] [Google Scholar]
- Hanski I. Metapopulation dynamics. Nature. 1998;396:41–49. 10.1038/23876 [Google Scholar]
- Hanski I. Spatially realistic models of metapopulation dynamics and their implications for ecological, genetic and evolutionary processes. In: Silvertown J, Antonovics J, editors. Integrating ecology and evolution in a spatial context. Blackwell Science; Oxford, UK: 2001. pp. 139–156. [Google Scholar]
- Hanski I, Simberloff D. The metapopulation approach, its history, conceptual domain and application to conservation. In: Hanski I, Gilpin M.E, editors. Metapopulation biology: ecology, genetics, and evolution. Academic Press; San Diego, CA: 1997. [Google Scholar]
- Jakob C, Poizat G, Veith M, Seitz A, Crivelli A.J. Breeding phenology and larval distribution of amphibians in a Mediterranean pond network with unpredictable hydrology. Hydrobiologia. 2003;499:51–61. 10.1023/A:1026343618150 [Google Scholar]
- Jordano P, Bascompte J, Olesen J.M. Invariant properties in coevolutionary networks of plant–animal interactions. Ecol. Lett. 2003;6:69–81. 10.1046/j.1461-0248.2003.00403.x [Google Scholar]
- Keitt T.H. Network theory: an evolving approach to landscape conservation. In: Dale V.H, editor. Ecological modeling for resource management. Springer; New York, NY: 2003. pp. 125–134. [Google Scholar]
- Keitt T.H, Urban D.L, Milne B.T. Detecting critical scales in fragmented landscapes. Conserv. Ecol. 1997;1:4. [Google Scholar]
- Laan R, Verboom R. Effects of pool size and isolation on amphibian communities. Biol. Conserv. 1990;54:251–262. 10.1016/0006-3207(90)90055-T [Google Scholar]
- Marsh D.M, Trenham P.C. Metapopulation dynamics and amphibian conservation. Conserv. Biol. 2001;15:40–49. 10.1046/j.1523-1739.2001.00129.x [Google Scholar]
- Marsh D.M, Fegraus E.H, Harrison S. Effects of breeding pond isolation on the spatial and temporal dynamics of pond use by the tungara frog, Physalaemus pustulosus. J. Anim. Ecol. 1999;68:804–814. 10.1046/j.1365-2656.1999.00332.x [Google Scholar]
- Mateo J.A, Blázquez C, López-Jurado L.F. Parque Nacional de Doñana y Parque Natural del Entorno de Doñana. In: Santos X, Carretero M.A, Llorente G.A, Montori A, editors. Inventario de las áreas importantes para los anfibios y reptiles de España. Colección Técnica, Organismo Autónomo de Parques Nacionales. Ministerio de Medio Ambiente, ICONA; Madrid, Spain: 1998. pp. 19–22. [Google Scholar]
- Melián C.J, Bascompte J. Complex networks: two ways to be robust? Ecol. Lett. 2002;5:705–708. 10.1046/j.1461-0248.2002.00386.x [Google Scholar]
- Newman M.E.J. The structure and function of complex networks. SIAM Rev. 2003;45:167–256. 10.1137/S003614450342480 [Google Scholar]
- Pimm S.L. Food webs. Chapman & Hall; London, UK: 1982. [Google Scholar]
- Proulx S.R, Promislow D.E.L, Phillips P.C. Network thinking in ecology and evolution. Trends Ecol. Evol. 2005;20:345–353. doi: 10.1016/j.tree.2005.04.004. 10.1016/j.tree.2005.04.004 [DOI] [PubMed] [Google Scholar]
- Semlitsch R.D, Bodie J.R. Are small, isolated wetlands expendable? Conserv. Biol. 1998;12:1129–1133. 10.1046/j.1523-1739.1998.98166.x [Google Scholar]
- Shields W.M. Philopatry, inbreeding, and the evolution of sex. State University of New York Press; Albany, NY: 1982. [Google Scholar]
- Skelly D.K, Werner E.E, Cortwright S.A. Long-term distributional dynamics of a Michigan amphibian assemblage. Ecology. 1999;80:2326–2337. [Google Scholar]
- Skelly D.K, Freidenburg L.K, Kiesecker J.M. Forest canopy and the performance of larval amphibians. Ecology. 2002;83:983–992. [Google Scholar]
- Smith M.A, Green D.M. Dispersal and the metapopulation paradigm in amphibian ecology and conservation: are all amphibian populations metapopulations? Ecography. 2005;28:110–128. 10.1111/j.0906-7590.2005.04042.x [Google Scholar]
- Stevens V.M, Polus E, Wesselingh R.A, Schtickzelle N, Baguette M. Quantifying functional connectivity: experimental evidence for patch-specific resistance in the natterjack toad (Bufo calamita) Landscape Ecol. 2004;19:829–842. 10.1007/s10980-004-0166-6 [Google Scholar]
- Strogatz S.H. Exploring complex networks. Nature. 2001;210:268–276. doi: 10.1038/35065725. 10.1038/35065725 [DOI] [PubMed] [Google Scholar]
- Urban D, Keitt T. Landscape connectivity: a graph-theoretic perspective. Ecology. 2001;82:1205–1218. [Google Scholar]
- Watts D.J, Strogatz S.H. Collective dynamics of small world networks. Nature. 1998;393:440–442. doi: 10.1038/30918. 10.1038/30918 [DOI] [PubMed] [Google Scholar]
- Wellborn G.A, Skelly D.K, Werner E.E. Mechanisms creating community structure across a freshwater habitat gradient. Annu. Rev. Ecol. Syst. 1996;27:337–363. 10.1146/annurev.ecolsys.27.1.337 [Google Scholar]
- Werner E.E, Glennemeier K.S. The influence of forest canopy cover on breeding pond distributions of several amphibian species. Copeia. 1999;999:1–12. [Google Scholar]
- Wiens J.A. Spatial scaling in ecology. Funct. Ecol. 1989;3:385–397. [Google Scholar]


