Abstract
The existence of biologically differentiated populations has been credited with a major role in conferring sustainability and in buffering overall productivity of anadromous fish population complexes where evidence for spatial structure is uncontroversial. Here, we describe evidence of correlated genetic and life history (spawning season linked to spawning location) differentiation in an abundant and highly migratory pelagic fish, Atlantic herring, Clupea harengus, in the North Sea (NS) and adjacent areas. The existence of genetically and phenotypically diverse stocks in this region despite intense seasonal mixing strongly implicates natal homing in this species. Based on information from genetic markers and otolith morphology, we estimate the proportional contribution by NS, Skagerrak (SKG) and Kattegat and western Baltic (WBS) fish to mixed aggregations targeted by the NS fishery. We use these estimates to identify spatial and temporal differences in life history (migratory behaviour) and habitat use among genetically differentiated migratory populations that mix seasonally. Our study suggests the existence of more complex patterns of intraspecific diversity than was previously recognized. Sustainability may be compromised if such complex patterns are reduced through generalized management (e.g. area closures) that overlooks population differences in spatial use throughout the life cycle.
Keywords: homing, genetic mixture analysis, diversity conservation, pelagic fisheries
1. Introduction
Marine conservation initiatives or fisheries management regimes that disregard or misidentify patterns of genetic and life-history differences among migratory populations that mix seasonally (i.e. intraspecific component of biocomplexity), have the potential to result in the erosion of genetic resources. This problem is especially acute for marine fish population complexes with diverse and potentially locally adapted migratory components that overlap spatially and seasonally. In such complex systems, the more easily exploited or the less-productive components will also be the most easily eliminated with the consequent loss of diversity and adaptive potential (Iles & Sinclair 1982; Policansky & Magnuson 1998). Although it is widely accepted that the loss of genetic diversity is likely to have profound negative effects on recruitment potential and population recovery (Ryman et al. 1995), the significance, and in fact the very existence of such biologically relevant (i.e. spatially and temporally explicit) diversity for highly abundant and widely distributed migratory marine fish, has traditionally been controversial (McQuinn 1997). Given the documented historical loss of species diversity in coastal ecosystems through extinctions caused by overfishing (Jackson et al. 2001), and the worldwide depletion of fish populations and communities (Pauly et al. 1998; Myers & Worm 2005) there is an urgent need to delineate extant patterns of within-species genetic diversity and to use such knowledge to quantify the relative contributions of population components to mixed fisheries. This need applies to marine fishes in general, but particularly to species such as herring, which in the past have exhibited large and persistent local spawning aggregations supporting human communities entirely dependent on their fishery (Alheit & Hagen 1997), and for which local extinction/recolonization events are well documented for at least the last century (Corten 2002).
Our research was designed to examine spatial structure in herring (Clupea harengus harengus L., Clupeidae, Teleostei) in the North Sea (NS) and adjacent areas and to use such knowledge to estimate the contribution by different herring assemblages to feeding aggregations targeted by the fisheries.
2. Material and methods
(a) Sample collection
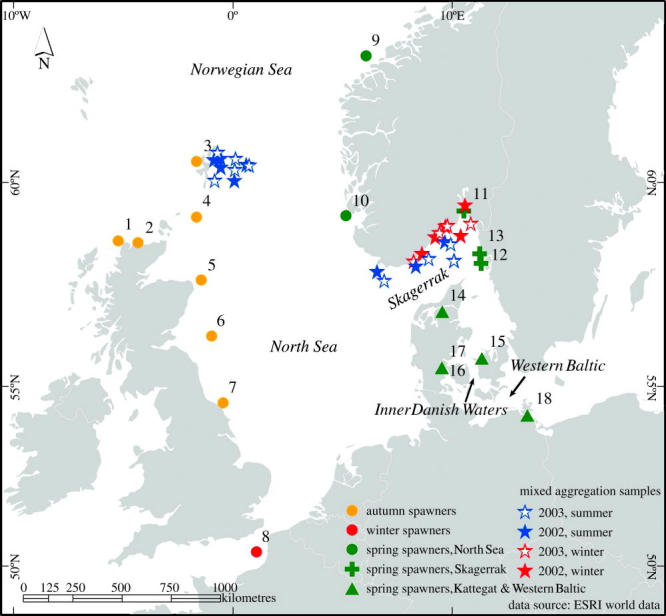
Temporally replicated samples of spawning herring were obtained in 2002 and 2003 (one sample collected in November 2001) from 18 spawning aggregations spanning the distributional range of herring in the NS and adjacent areas (global n=2997; figure 1, electronic supplementary material, table A1). Herring samples were also obtained from summer feeding aggregations in the northern North Sea (NNS) and Skagerrak (SKG) (July 2002 and 2003, NNS n=492 and 472, SKG n=600 and 400 respectively, figure 1; electronic supplementary material, table A2) and from overwintering aggregations in the SKG (December 2002 and 2003, n=500 and 400 respectively, figure 1, electronic supplementary material, table A2). All samples were analysed genetically with a suite of 9 microsatellite DNA loci (electronic supplementary material, table A3), and phenotypically for a number of otolith winter rings (proxy for age; ICES 2003) and otolith microstructure (proxy for season individual was hatched; Moksness & Fossum 1991).
Figure 1.

Sampling locations for herring in spawning condition and for herring in mixed feeding or overwintering aggregations. Spawning locations are numbered as in electronic supplementary material, table A1). For the MSA, locations 1–10, 11–13, and 14–18 were pooled into: region 1 (n=1332) comprising autumn (filled circle in orange), spring (filled circle in green) and winter (filled circle in red) spawners in the North Sea; region 2 (n=635), comprising spring spawners from the Skagerrak (plus), and region 3 (n=1010), comprising spring spawners (filled triangle in green) from the Kattegat and Western Baltic. The locations for the mixed aggregations are indicated by stars, solid stars (2002), open stars (2003): blue, summer feeding aggregations; red, overwintering aggregations, respectively. See electronic supplementary material for details.
(b) Molecular analysis
A total of n=5841 herring were screened with a suite of 9 microsatellite DNA loci (details available in electronic supplementary material). DNA extraction and PCR amplification procedures as well as information on population structure based on the collections of spawning herring are reported in Mariani et al. (2005) for the NS and in Bekkevold et al. (2005) for the SKG/Kattegat/WBS. The genetic composition of the feeding aggregations (global n=2864, details available in electronic supplementary material) is reported in the present paper.
(c) Phenotypic analysis
Otolith (sagitta) winter rings were counted as a proxy for age following standard procedures (ICES 2003). Ageing was conducted by experienced technical personnel at the MARLAB (FRS) in the UK, at IMR in Norway and at DIFRES in Denmark. Otolith central area microstructure was analysed by IMR and DIFRES to determine each individual's hatching season (spring, autumn or winter; Moksness & Fossum 1991). Both age and hatching season (microstructure) were estimated following inter-laboratory calibration and repeated quality control provisions (details available in electronic supplementary material).
(d) Statistical analysis
Population differentiation was estimated per sample pair and overall using the unbiased FST estimator θ (Weir & Cockerham 1984) and statistical significance was examined using permutation tests implemented in FSTAT (Goudet 2001). Temporal, within-location samples not exhibiting significant differentiation (at α=0.05) in these tests were pooled in subsequent analyses. Hierarchical AMOVAs were conducted using ARLEQUIN (Schneider et al. 2000). To examine the potential origin of herring collected from feeding aggregations in the NNS and in the SKG, we employed the partially Bayesian approach for the analysis of composition of stock mixtures developed by Pella & Masuda (2001). The software is available from the authors anonymous ftp site (ftp://ftp.afsc.noaa.gov/sida/mixture-analysis/bayes/). We followed the standard procedure as recommended in the MSA–BAYES user manual (Masuda 2002). In particular, for every computation, three independent Monte Carlo Markov chains were run, one per region (NS, SKG, WBS). Prior information on the proportions contributed by each of the three regions differed between runs. Computations were run for twice the number of iterations needed to achieve convergence, as assessed by two different diagnostics (see Masuda 2002). Estimates obtained before convergence were discarded; regional contributions are thus based on estimates obtained after convergence (Masuda 2002). MSA–BAYES was run independently for each of the six mixed aggregations' sample pools (NNS summer 2002 (n=414) and 2003 (n=310), SKG summer 2002 (n=600) and 2003 (n=400) and SKG winter 2002 (n=500) and 2003 (n=400; figure 3). MSA–BAYES was also run separately for herring in the mixture samples of different age-groups (juveniles (0 and 1 winter rings) and adults (2 and more winter rings)) and spawning season (spring, autumn, winter; figure 4).
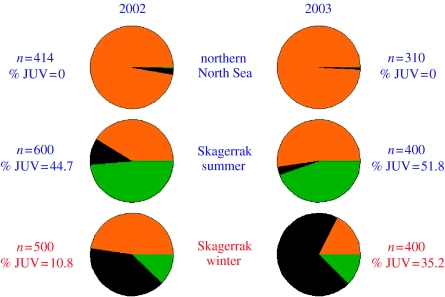
Figure 3.
Estimated composition of mixture samples. Mixture samples in the NNS were collected in July of 2002 and 2003. In the Skagerrak mixture samples were collected in July and in November–December of 2002 and 2003 (details in electronic supplementary material, table A2). Composition of the mixture samples is reported in terms of herring from three broad regions: North Sea, (shaded in orange), comprising North Sea autumn spawners, English Channel winter spawners and Norwegian spring spawners; Skagerrak spring spawners: (shaded in black); and spring spawners from the Kattegat and Western Baltic (shaded in green), comprising spring spawners from the Kattegat, Inner Danish Waters and Rügen.
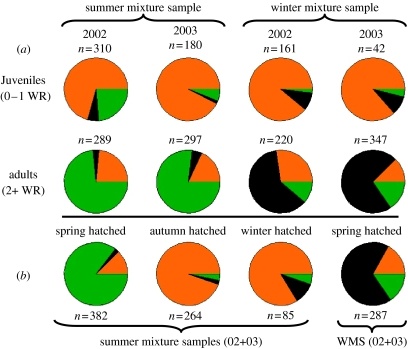
Figure 4.
Estimated composition of subsets of the mixture samples where subsets are (a) age groups or (b) season hatched (as assessed from otolith microstructure). (a) Age group: individuals were pooled into two subsets. Juveniles, fish with no or one otolith winter ring; adults, fish with two or more otolith winter rings. This analysis was conducted only for the Skagerrak mixture samples as there were no juveniles present in the NNS mixture samples. Colours are as in figure 3. (b) Season hatched: individuals in the Skagerrak summer mixture samples from 2002 and 2003 were pooled into three subsets: spring hatched, autumn hatched and winter hatched. Only spring-hatched individuals were present in numbers sufficient for an MSA in the Skagerrak winter mixture samples from 2002 and 2003.
(e) Simulation tests of precision and accuracy
Our baseline samples comprised temporally repeated collections of spawning herring collected from 18 locations distributed throughout the NS, the SKG and the WBS. We are, therefore, reasonably certain that these samples cover the spectrum of genetic variation of Atlantic herring in the area and that no important potential contributor to the mixed feeding aggregations was left un-sampled. The grouping of the baseline spawning herring collections into three relatively homogeneous regional pools (NS, SKG, WBS) provided the dual benefit of reducing the number of contributions to estimate, while simultaneously increasing the sample sizes within each baseline. Although the three regional stock-pools were genetically distinguishable (figure 2), the levels of differentiation were relatively low, hence, to gauge precision and accuracy of our estimates of mixture composition, we conducted a series of four simulations where mixture samples of n=400 were created with individuals randomly chosen in known proportions from the spawning aggregations sampled in 2002 and tested against three regional baselines based exclusively on allele frequency information for spawners collected in 2003. In the first simulation (electronic supplementary material, table A6) all three regional components contributed one-third each, whereas, contribution skewness increased in simulations 2–4, with each simulation differing in the details of which component contributed most. In general, precision and accuracy were high as indicated, respectively, by the relatively narrow 95% confidence intervals, and by the close relationship between the mean or median estimates and the true values. As expected, accuracy decreased with increasing skewness in the true composition of the simulated mixture samples, however, in all cases (except one where the true contribution was nil: simulation 3, region 2), the 95% confidence intervals encapsulated the true contributions.
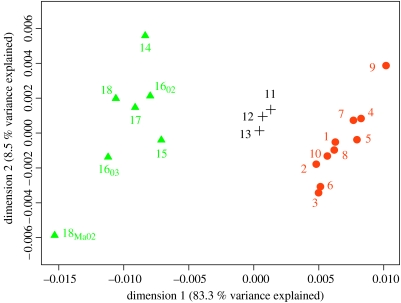
Figure 2.
Multi-dimensional scaling plot of pairwise FST estimates between herring spawning collections. Temporally replicated samples were pooled except when genetically distinguishable (i.e. Rügen and Koldingfjord). Symbols: filled circle in orange, samples pooled into region 1 (North Sea), comprising autumn spawners (1–7), spring spawners (9–10) as well as winter spawners (8); plus, samples pooled into region 2 (Skagerrak), comprising spring spawners (11–13); filled triangle in green, samples pooled into region 3 (Kattegat and Western Baltic) comprising spring spawners (14, 15, 1602, 1603, 17, 18, 18MA02). Hierarchical AMOVA estimates of variance: % variance among regions: 0.90 (p<0.001), % variance among populations within regions: 0.17. In the multi-dimensional scaling analysis we considered five dimensions. Dimensions 1 and 2 are plotted here; dimensions 3, 4 and 5 explained 4, 2.4 and 1.8% of the total variance, respectively.
3. Results
We found that there are clear and temporally stable hitherto undetected genetic differences among herring from three broad regions: (i) NS (n=1332), comprising NNS autumn spawners, English Channel winter spawners and Norwegian spring spawners, (ii) SKG (n=635), comprising SKG spring spawners and (iii) western Baltic (WBS, n=1010) comprising Kattegat and WBS spring spawners. These three regional components are characterized by relative homogeneity within and significant heterogeneity between them (two-level AMOVA, FCT(differentiation among regions)=0.009, p<0.001; FSC(differentiation among populations within regions)=0.002, p<0.001; figure 2).
These genetic differences, though generally low (maximum (mean) pairwise FST=0.027 (0.0085); see figure 2) as expected for an abundant, widely distributed and pelagic marine fish (Ward et al. 1994; DeWoody & Avise 2000; Palumbi 2003), are nevertheless of sufficient magnitude for a precise estimation of the regional contributions to mixed aggregations targeted by commercial fisheries in the NNS and SKG. To estimate such contributions, we employed a partially Bayesian approach for the analysis of stock mixtures (MSA–BAYES software; Pella & Masuda 2001; see electronic supplementary material).
Virtually all herring collected in July 2002 and 2003 within the NNS feeding aggregations likely originated in the NS with no contributions from SKG or the Kattegat and WBS (figure 3). The SKG feeding aggregations in contrast, unequivocally comprised herring of mixed origin: the summer feeding aggregations were composed partly of herring from the NS (mean estimated contribution 41.3% in 2002 and 52.4% in 2003) and partly from the Kattegat and WBS (mean 48.6% in 2002 and 44.7% in 2003; figure 3 and electronic supplementary material, table A4). Local SKG herring contributed only approximately 10% in 2002 and negligibly in 2003 (figure 3). The SKG winter mixture samples, which originated from locations closer to the coast of southeastern Norway (figure 1), exhibited a composition that was considerably different from that seen in summer samples: local SKG herring comprised 40 and 70% of the overwintering aggregations sampled in December 2002 and December 2003, respectively, with the remainder of the individuals originating from the NS (48% in 2002 and 18% in 2003) and the Kattegat and WBS (approximately 12–13% in both years; figure 3).
To examine the composition of the mixture samples in more detail, we next estimated contributions separately for juveniles (0–1 otolith winter rings) and adults (2 or more winter rings; figure 4, details in electronic supplementary material, table A5). This analysis was conducted exclusively for the SKG mixture samples as no juveniles were present in the NNS mixture collections. In both years (2002 and 2003) and both seasons (July and December) juveniles in the SKG mixed aggregations originated predominantly from the NS (figure 4; details in electronic supplementary material, table A5). SKG juveniles were virtually absent (figure 4), while the presence of juveniles from the WBS was relatively low throughout (figure 4; details in electronic supplementary material, table A5). This clearly indicates that the majority of juvenile herring in the SKG summer and winter aggregation samples are of NS origin.
The composition of adults within the SKG mixed aggregations differed from that of juveniles (figure 4). Within the summer (offshore) feeding aggregations most adults were of potential WBS origin with minimal contribution by NS herring in both years (figure 4). Within the overwintering (coastal) aggregations, most adults were of local SKG origin with remaining adults split between the NS and the WBS (figure 4; details in electronic supplementary material, table A5).
We inferred from otolith microstructure that each of the six pooled mixture samples (two in the NNS (2002 and 2003) and four in the SKG (2002 and 2003, summer and winter)) comprised subsets of individuals hatched in the spring, autumn and winter. Where sample sizes permitted (n≥85; figure 4 and electronic supplementary material, table A5), we thus examined the potential origin of individuals within such subsets. Predictably, for the NNS mixture samples results did not change from those described above: virtually all herring hatched in the autumn and winter were of NS origin (see electronic supplementary material, table A5). Of the n=382 spring-hatched herring present in the SKG summer mixture samples, 84.5% (mean estimate) were likely of WBS origin, with only about 12% probably originating from somewhere in the NS. In contrast, of the n=287 spring-hatched herring present in the SKG winter mixture pool, 67.4% (mean estimate) likely originated locally in the SKG (figure 4). Among the autumn-hatched (n=264) and winter-hatched (n=85) herring in the SKG summer aggregations the vast majority of individuals was, predictably, of likely NS origin (figure 4).
4. Discussion
Analysis of morphometric character differences on juveniles together with acoustic surveys and modelling studies (Iles & Sinclair 1982; Bartsch et al. 1989) suggest that larval and juvenile herring that hatch in the autumn and winter along the British NS coast drift across the northern and central NS into the SKG. These autumn-hatched juveniles spend the first year or two of life mixed with adult herring of local origin and with those of WBS origin on their annual feeding migrations into the Kattegat and SKG (Rosenberg & Palmén 1982; Aro 1989; ICES 1991; Johannessen & Moksness 1991). Historical records dating back to the tenth century (Alheit & Hagen 1997) suggest the degree to which NS herring intrude into the SKG correlates on decadal scales with certain climatic and hydrographic patterns. Our genetic results support a scenario of NS herring intruding into the SKG and mixing with local and WBS herring. Most importantly, they provide strong evidence for the persistence of genetic differences associated with life-history differences (spawning season, which is linked to spawning location, inferred from otolith central microstructure, migration pattern), among herring from three regions despite intermingling freely in large nursery, feeding and overwintering aggregations. The fact that such a complex pattern of intraspecific differentiation persists despite mixing supports the view of strong natal homing behaviour in herring (Iles & Sinclair 1982), at least at the broad geographic scale of our analysis.
Our results further suggest that the precise composition of the herring feeding aggregations in terms of the three major components varies both seasonally and spatially, a finding with profound implications for the conservation of genetic diversity in this species. We argue that sustainability (Hilborn et al. 2003), resistance to disturbance (e.g. Hughes & Stachowicz 2004), and perhaps even the ability to recover from low abundance following environmental change or climatic extremes (e.g. Reusch et al. 2005), are all likely to be compromised if this genetic diversity is reduced through generalized management or misdirected area closures that can disproportionately impact smaller or less-productive populations. Loss of, or reduction in such biocomplexity is likely to have ecological implications by affecting the dispersal patterns that sustain major fisheries and evolutionary implications by removing adaptive genetic variation. We stress that detailed spatial and seasonal information is required for assessing the impact of spatially explicit conservation measures (e.g. marine protected areas, FSBI 2001), even for widely abundant and highly migratory species with low levels of genetic differentiation. Overlooking population differences in spatial use throughout their life cycles will affect the viability of populations, their ability to recover from low abundance and their evolutionary potential.
Acknowledgments
This work is part of the research project HERGEN (http://www.hull.ac.uk/hergen) funded by the European Union within the fifth framework programme. We thank Dr Robin Waples and an anonymous referee for their insightful comments on an earlier version of this paper and J Milne (GIS, Killam Library, Dalhousie University) for assistance with figure 1.
Footnotes
Present address: School of Biological and Environmental Sciences, University College Dublin, Belfield Dublin 4, Ireland.
Present address: Scottish Fish Immunology Research Centre, University of Aberdeen, Tillydrone Avenue, Aberdeen AB24 2TZ, UK.
Present address: School of Biological Sciences, University of Wales, Bangor, Brambell Building, Bangor, Gwynedd LL57 2UW, UK.
These authors contributed equally to the study.
Supplementary Material
References
- Alheit J, Hagen E. Long-term climate forcing of European herring and sardine populations. Fish. Oceanogr. 1997;6:130–139. doi:10.1046/j.1365-2419.1997.00035.x [Google Scholar]
- Aro E. A review of fish migration patterns in the Baltic. Rapp. P.-v. Reun. Cons. Int. Explor. Mer. 1989;190:72–96. [Google Scholar]
- Bartsch J, Brander K, Heath M, Munk P, Richardson K, Svendsen E. Modelling the advection of herring larvae in the North Sea. Nature. 1989;340:632–636. doi:10.1038/340632a0 [Google Scholar]
- Bekkevold D, André C, Dahlgren T.G, Clausen L.A.W, Torstensen E, Mosegaard H, Carvalho G.R, Christensen T.B, Ruzzante D.E. Environmental correlates of population differentiation in Atlantic herring. Evolution. 2005;59:2656–2668. [PubMed] [Google Scholar]
- Corten A. The role of “conservatism” in herring migrations. Rev. Fish Biol. Fish. 2002;11:339–361. doi:10.1023/A:1021347630813 [Google Scholar]
- DeWoody J.A, Avise J.C. Microsatellite variation in marine, freshwater and anadromous fishes compared with other animals. J. Fish Biol. 2000;56:461–473. doi:10.1111/j.1095-8649.2000.tb00748.x [Google Scholar]
- FSBI, 2001 Marine protected areas in the North Sea. Briefing paper 1, Fisheries Society of the British Isles, Granta Information Systems, 82A High Street, Sawston, Cambridge CB2 4H, UK.
- Goudet, J. 2001 Fstat, a program to estimate and test gene diversities and fixation indices (version 2.9.3.2). Available from http://www.unil.ch/izea/software/fstat.html (2001).
- Hilborn R, Quinn T.P, Schindler D.E, Rogers D.E. Biocomplexity and fisheries sustainability. Proc. Natl Acad. Sci. 2003;100:6564–6568. doi: 10.1073/pnas.1037274100. doi:10.1073/pnas.1037274100 [DOI] [PMC free article] [PubMed] [Google Scholar]
- Hughes A.R, Stachowicz J.J. Genetic diversity enhances the resistance of a seagrass ecosystem to disturbance. Proc. Natl Acad. Sci. 2004;101:8998–9002. doi: 10.1073/pnas.0402642101. doi:10.1073/pnas.0402642101 [DOI] [PMC free article] [PubMed] [Google Scholar]
- ICES CM, 1991 Report of the Herring Assessment Working Group for the Area South of 62°N. ICES CM. 1991/Assess:15.
- ICES CM, 2003 Report of Herring Assessment Working Group for the Area south of 62° N. ICES 2003 2003/ACFM: 17.
- Iles T.D, Sinclair M. Atlantic herring: stock discreteness and abundance. Science. 1982;215:627–633. doi: 10.1126/science.215.4533.627. [DOI] [PubMed] [Google Scholar]
- Jackson J.B.C, et al. Historical overfishing and the recent collapse of coastal ecosystems. Science. 2001;293:629–638. doi: 10.1126/science.1059199. doi:10.1126/science.1063789 [DOI] [PubMed] [Google Scholar]
- Johannessen A, Moksness E. Herring larvae (Clupea harengus) in the Skagerrak area from December to April 1988. Fish. Res. 1991;11:155–170. doi:10.1016/0165-7836(91)90105-O [Google Scholar]
- Mariani S, et al. North Sea herring population structure as revealed by microsatellite analysis. Mar. Ecol. Prog. Ser. 2005;303:245–257. [Google Scholar]
- Masuda, M. 2002. User's Manual for Bayes: Bayesian Stock Mixture Analysis Program National Marine Fisheries Service, Alaska Fisheries Science Center, Auke Bay Laboratory, Juneau, AK, USA.
- McQuinn I.H. Metapopulations and Atlantic herring. Rev. Fish Biol. Fish. 1997;7:297–329. doi:10.1023/A:1018491828875 [Google Scholar]
- Moksness E, Fossum P. Distinguishing spring- and autumn spawned herring larvae (Clupea herengus L.) by otolith microstructure. ICES J. Mar. Sci. 1991;48:61–66. [Google Scholar]
- Myers R.A, Worm B. Extinction, survival or recovery of large predatory fishes. Phil. Trans. R. Soc. B. 2005;360:13–20. doi: 10.1098/rstb.2004.1573. doi:10.1098/rstb/2004.1573 [DOI] [PMC free article] [PubMed] [Google Scholar]
- Palumbi S.R. Population genetics, demographic connectivity and the design of marine reserves. Ecol. Appl. 2003;13:S146–S158. [Google Scholar]
- Pauly D, Christensen V, Dalsgaard J, Froese R, Torres F., Jr Fishing down marine food webs. Science. 1998;279:860–863. doi: 10.1126/science.279.5352.860. doi:10.1126/science.279.5352.860 [DOI] [PubMed] [Google Scholar]
- Pella J, Masuda M. Bayesian methods for analysis of stock mixtures from genetic characters. Fish. Bull. 2001;99:151–167. [Google Scholar]
- Policansky D, Magnuson J.J. Genetics, metapopulations, and ecosystem management of fisheries. Ecol. Appl. 1998;8:S119–S123. [Google Scholar]
- Reusch T.B.H, Ehlers A, Hämmerli A, Worm B. Ecosystem recovery after climatic extremes enhanced by genotypic diversity. Proc. Natl Acad. Sci. 2005;102:2826–2831. doi: 10.1073/pnas.0500008102. doi:10.1073/pnas.0500008102 [DOI] [PMC free article] [PubMed] [Google Scholar]
- Rosenberg R, Palmén L.-E. Composition of herring stocks in the Skagerrak–Kattegat and the relations of these stocks with those of the North Sea and adjacent waters. Fish. Res. 1982;1:83–104. doi:10.1016/0165-7836(81)90012-6 [Google Scholar]
- Ryman N, Utter F, Laikre L. Protection of intraspecific biodiversity of exploited fishes. Rev. Fish Biol. Fish. 1995;5:417–446. doi:10.1007/BF01103814 [Google Scholar]
- Schneider S, Kueffer J.-M, Roessli D, Excoffier L. Biometry Laboratory, University of Geneva; Geneva, Switzerland: 2000. Arlequin ver. 2000. A software for population genetics data analysis. [Google Scholar]
- Ward R.D, Woodwark M, Skibinki D.O.F. A comparison of genetic diversity levels in marine, freshwater, and anadromous fishes. J. Fish Biol. 1994;44:213–232. doi:10.1111/j.1095-8649.1994.tb01200.x [Google Scholar]
- Weir B.S, Cockerham C.C. Estimating F-statistics for the analysis of population structure. Evolution. 1984;38:1358–1370. doi: 10.1111/j.1558-5646.1984.tb05657.x. [DOI] [PubMed] [Google Scholar]
Associated Data
This section collects any data citations, data availability statements, or supplementary materials included in this article.


