Abstract
Weakly electric fish emit and receive low-voltage electric organ discharges (EODs) for electrolocation and communication. Since the discovery of the electric sense, their behaviours in the wild have remained elusive owing to their nocturnal habits and the inaccessible environments in which they live. The transparency of Lake Malawi provided the first opportunity to simultaneously observe freely behaving mormyrid fish and record their EODs. We observed a piscivorous mormyrid, Mormyrops anguilloides, hunting in small groups in Lake Malawi while feeding on rock-frequenting cichlids of the largest known vertebrate species flock. Video recordings yielded the novel and unexpected finding that these groups resembled hunting packs by being largely composed of the same individuals across days. We show that EOD accelerations accompany prey probing and size estimation by M. anguilloides. In addition, group members occasionally synchronize bursts of EODs with an extraordinary degree of precision afforded by the mormyrid echo response. The characteristics and context of burst synchronization suggest that it may function as a pack cohesion signal. Our observations highlight the potential richness of social behaviours in a basal vertebrate lineage, and provide a framework for future investigations of the neural mechanisms, behavioural rules and ecological significance of social predation in M. anguilloides.
Keywords: Mormyridae, predation, electrosensory, natural history, electric organ discharge
1. Introduction
African mormyrid fish emit and receive weak electric organ discharges (EODs) to sense objects in their environment and to communicate (Moller 1995). Electrogenic fishes have served as important models for studying a wide range of problems of general interest to neurobiology (Zakon 2003; Krahe & Gabbiani 2004; Rose 2004). Since the discovery of the electric sense (Lissmann & Machin 1958), behaviours of mormyrids and other weakly electric fishes have only been visually observed in the laboratory.
The high water clarity of Lake Malawi provided the first opportunity to simultaneously observe a freely behaving mormyrid species (Mormyrops anguilloides) and to record its electric signalling in a fully natural setting. Lake Malawi contains a large, endemic flock of cichlid fishes that have explosively speciated within the confines of a single body of water (Kocher 2004). We previously observed groups of M. anguilloides adults hunting several species of Lake Malawi's colourful rock-dwelling cichlids at night.
In addition to M. anguilloides, other mormyrid species are known to form conspecific aggregations in the wild. However, observations of these additional species have been made solely via nettings or ‘blind’ electrical recordings (Hopkins 1986; Moller 1995). Predation is one context in which several species of non-electrogenic fishes aggregate (Hiatt & Brock 1948; Nursall 1973; Potts 1980; Schmitt & Strand 1982; Sazima & Machado 1990; Merron 1993; Motta & Wilga 2001; Bshary et al. 2002). We made a series of video recordings in Lake Malawi to investigate the cohesiveness of hunting groups of M. anguilloides. Based on analyses of these recordings, we describe the predatory behaviours of M. anguilloides, as well as patterns of EODs produced by individuals during prey localization and interactions with other hunting group members.
2. Material and methods
(a) Video recordings, individual identification and group size estimation
A single SCUBA diver videotaped individuals of M. anguilloides in Jan 2000 and Dec 2002–Jan 2003 (18:38–20:40 h) at Mitande Rocks (14°01′ 33.4″ S; 34°49′ 27.0″ E) in the Cape Maclear region of Lake Malawi. Video was shot at depths ranging from 3 to 10 m using a Sony VX1000 miniDV camera in an Amphibico marine housing. The earliest recording time occurred after civil twilight (i.e. when the brightest stars become visible). Lighting was therefore provided by two 35 W halogen lamps. Mormyrops anguilloides showed no obvious response to illumination. Cichlids sometimes exhibited a startle response, but when they did it was generally after a delay of several seconds. We modified the video-out port of the housing to receive shielded input from a bipolar Ag/AgCl electrode, the raw signal of which was recorded on one audio track (48 kHz, 16 bit). The other audio track received input from the housing's on-board hydrophone.
At the beginning of each dive, the recordist searched the reef until M. anguilloides individuals were found. Whether solitary or grouped, the first individuals encountered were immediately followed and continuously recorded until they outpaced the recordist (or the recordist otherwise lost sight of them). Whenever the diver lost contact with the last of the predators being followed, he continued searching the reef without interrupting the recording (swimming up to ca. 20 m from that night's anchor point) until predators were encountered again and followed. During all recordings, the diver had no prior knowledge of individual distinctiveness or identity. We accumulated a total of 311 min of useful footage of the predatory behaviours of M. anguilloides.
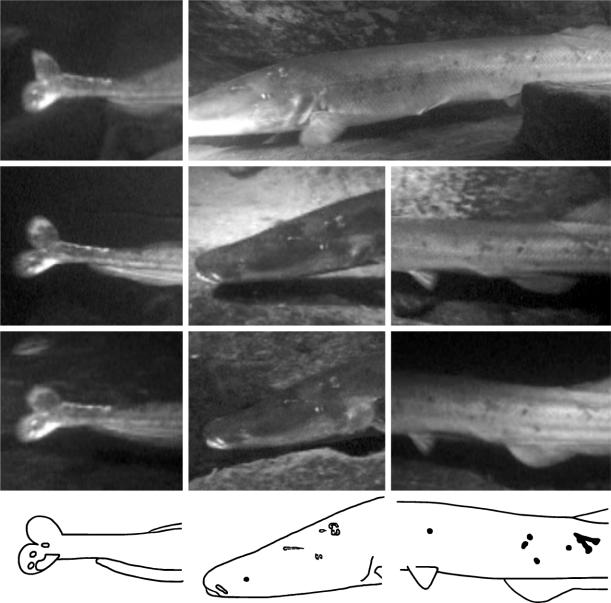
Sizes of individuals were estimated in two ways. Recorded images of fish were compared with the known length of the electrode, which appeared in most video frames. In addition, two individuals were filmed and then captured (using a monofilament net) at the end of our last night's recordings. Total lengths of both individuals were measured. One individual was released, while the other was euthanised with an overdose of MS222, fixed in 10% formalin and deposited in the Cornell University Museum of Vertebrates (cat. no. 88206). Given the size of the adults observed (ca 55–85 cm total length), we were able to record their behaviours from a distance of up to 3 m. Their size also allowed us to unambiguously identify individuals on the basis of distinctive scars, melanin patterns, large fin tears and other body markings (e.g. Kohda 1991; Nelson et al. 1994), which are clearly visible in video screen captures of M. anguilloides. Based on three sets of such characters in different body regions (e.g. figure 1), in conjunction with estimated total length, one author identified and tracked individuals during video playback in the laboratory. Without prior knowledge of the resulting data, the second author subsequently confirmed individual identifications using only a library of sketches and video captures, which summarized the distinctive characters designated by the first author. We defined hunting groups of M. anguilloides as aggregations in which individuals appeared to actively seek, probe or strike at prey while maintaining a maximum spacing of two body lengths. The majority of the time in groups, the predators swam within one body length of their nearest neighbour. Pairwise association of ‘known’ individuals (i.e. those seen in more than one, continuous video sequence) was compared with expectation based on random occurrences within nights using a Kolmogorov–Smirnov goodness-of-fit test (Zar 1999).
Figure 1.
Examples of body markings used to identify individuals. Video captures from different nights (rows) are shown for three sets of distinctive characters (aligned vertically) present in the same individual. Line drawings from the bottom row of photos summarize the character sets used to identify this individual: left, three spots and a larger white patch on the lower caudal fin lobe; middle, six scars and a white snout marking on the left side of the head; and right, a V-shaped patch and several dark spots on the left flank.
(b) Predatory behaviours
We characterized a stereotyped prey inspection behaviour exhibited by M. anguilloides and describe it (below) relative to motor behaviours previously recorded for other mormyrid species in the laboratory. For individual predators, we enumerated all such inspections as well as strike attempts and successful prey captures, which could be recognized both visually and audibly (by the sound of jaw closure). Greatest body depths of predators and targeted cichlids (not including fins) were measured from still frames for two categories of predatory behaviour: (i) stereotyped inspections after which predators passed up the prey to continue searching the reef (strike decision=‘no’); and (ii) unsuccessful and successful strikes, whether or not they were preceded by prey inspection (strike decision=‘yes’). Such measurements were only made for cases in which predator and prey were judged to be the same distance from the camera and the camera angle appeared orthogonal to each fish's medial dorsoventral axis. Relative prey size was taken as the ratio of prey body depth to predator body depth. The relative size of targeted prey was compared between strike decision categories using a Wilcoxon paired-sample test of medians calculated for individual predators (Zar 1999).
(c) EOD detection and discrimination
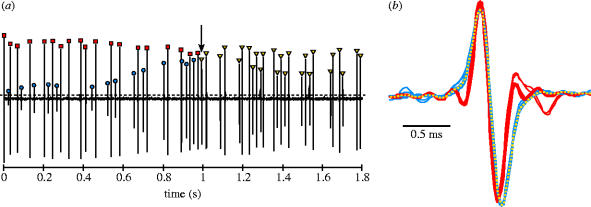
All analyses of recorded electrical activity were done using customized routines developed in Matlab 6.5 (MathWorks, Inc.). We extracted wave files containing electric signals from video clips and low-pass filtered them using a Butterworth digital filter (4 kHz cut-off) to reduce camera-generated noise. Each record was divided into 5-s blocks, and for each block we determined the EOD times of occurrence as the timing of positive peaks in the record that exceeded a threshold value set above the background noise level (figure 2a). For recordings from individual fish, this method was sufficient for determining the timing of EOD production. For recordings from hunting pairs, however, it was necessary to distinguish the EODs produced by each fish. As EOD amplitude is a function of both fish size and proximity to the recording electrode (Knudsen 1975), it was possible to separate the individuals' EODs in many cases by simply using differences in amplitude (figure 2a). Changes in the location or orientation of individuals relative to the electrode, however, often resulted in rapid changes in EOD amplitude, making such discrimination unreliable (figure 2a). Marked individual variation in the EOD waveform has been described for many species of mormyrids (Friedman & Hopkins 1996), and the total EOD durations of M. anguilloides recorded in the current study ranged from 0.7 to 2.4 ms. In order to discriminate EODs in cases where amplitude differences were insufficient, we therefore visually inspected each EOD waveform and compared it to all the preceding EOD waveforms in the record (figure 2b). In each case, stereotyped waveform differences were sufficient to easily discriminate the EODs produced by two different fish (and sometimes groups of more than 2 individuals). Simultaneous EOD production by both fish in a pair was extremely rare but easily detected due to the highly distorted waveform that resulted from EOD summation.
Figure 2.
Example of the method used to detect and discriminate EOD times of occurrence. (a) Short segment of a low-pass filtered continuous electrical recording of two individuals (videotaped together). EODs (marked by symbols) are detected as positive peaks in the electrical recording that exceed a manually set threshold (dashed horizontal line). (b) Overlays of all EODs up to the point in (a) marked by the arrow. EODs are centred on their head-positive peak with peak-to-peak amplitude normalized (head-positive plotted upwards). Starting with the first EOD in the sequence (arbitrarily designated as individual i), the expanded EOD waveform is displayed and colour coded red. The next EOD is then superimposed on the previous EOD. Based on visual comparison of waveforms, the second EOD is assigned to individual ii and colour coded blue. The third EOD is then superimposed on all preceding EODs and, in this case, assigned to individual i. This sequence is continued until all EODs in the record have been assigned. The arrow in (a) indicates the yellow EOD waveform currently being inspected in (b), which would be assigned to individual ii.
(d) Analyses of electric signalling
We constructed plots of the sequence of pulse intervals (SPI) between successive EODs emitted by predators while swimming but not searching for prey, and during active prey localization, inspection, and strikes. These SPI plots display the time-interval between adjacent EODs as a function of time and are, therefore, useful for examining temporal patterns of EOD production (e.g. see Carlson 2002, figs. 3, 4). Cross-correlation histograms (Chatfield 2004) were also constructed to analyse the temporal relationship between EOD outputs of two fish in eight pairwise recordings. The individual that produced fewer EODs served as the focal fish for these analyses. We determined times of occurrence of the second fish's EODs relative to all those produced by the focal fish. Relative times were binned into 2 ms segments and adjusted to show the relative probability of EOD occurrence by calculating cross-correlation coefficients (Chatfield 2004). Histograms of these coefficients give the relative probability that the second fish produced an EOD within a given bin, given that the focal fish produced an EOD at time zero. Significance of cross-correlation data was estimated by the following permutation procedure for each dyad. The ordering of original EOD intervals was randomly shuffled for both fish, a cross-correlation histogram was constructed from these randomized sequences, and the maximum and minimum of the resulting values were determined. A distribution of maxima and minima under the null hypothesis ‘no EOD interactions’ was generated by repeating this procedure 50 times with new random shuffling seeds. Cross-correlation peaks of the original data that deviated from the mean maximum value +(1.96s.d.) or the mean minimum value −(1.96s.d.) of the permuted data were identified (two-tailed α=0.05). EOD outputs of isolated or paired predators were also examined by constructing joint-interval histograms (JIHs), in which each interpulse interval (IPIk+1) was plotted as a function of the preceding interval (IPIk) for the same predator. This method provides a graphic illustration of the statistical dependency of adjacent interpulse intervals within individuals (Krahe & Gabbiani 2004).
3. Results and discussion
We observed M. anguilloides adults consistently hunting together at night at Mitande Rocks. Predatory aggregations ranged in size from 2 to 10 individuals (modal size=3; figure 3a). The hunting groups we followed were composed of combinations of the same adults within and across days (figure 3b). Pairwise association of individuals which made up these focal groups exceeded expectation based on random occurrences within nights (0.002<p<0.005; Kolmogorov–Smirnov goodness-of-fit test on 49 unique pair-per-night associations for 12 such individuals observed). Rather than converging on a single location, group members cohesively travelled together while continuously searching the rocks for cichlids, an abundance of which were relatively evenly distributed across the reef each night. Although we cannot report the actual paths taken by the predators owing to the lack of a grid, we estimate that the groups swam a circuitous route around the reef at a minimum rate of 0.2 m s−1. At times, they accelerated their pursuit significantly and outswam the recordist. During occasional pauses from hunting, members of a given social group of M. anguilloides returned together to a cave shelter where they could also be seen resting during the day. Based on recognizable landmarks in the rocky terrain, groups were observed up to 20 m away from their shelter while pursuing prey.
Figure 3.
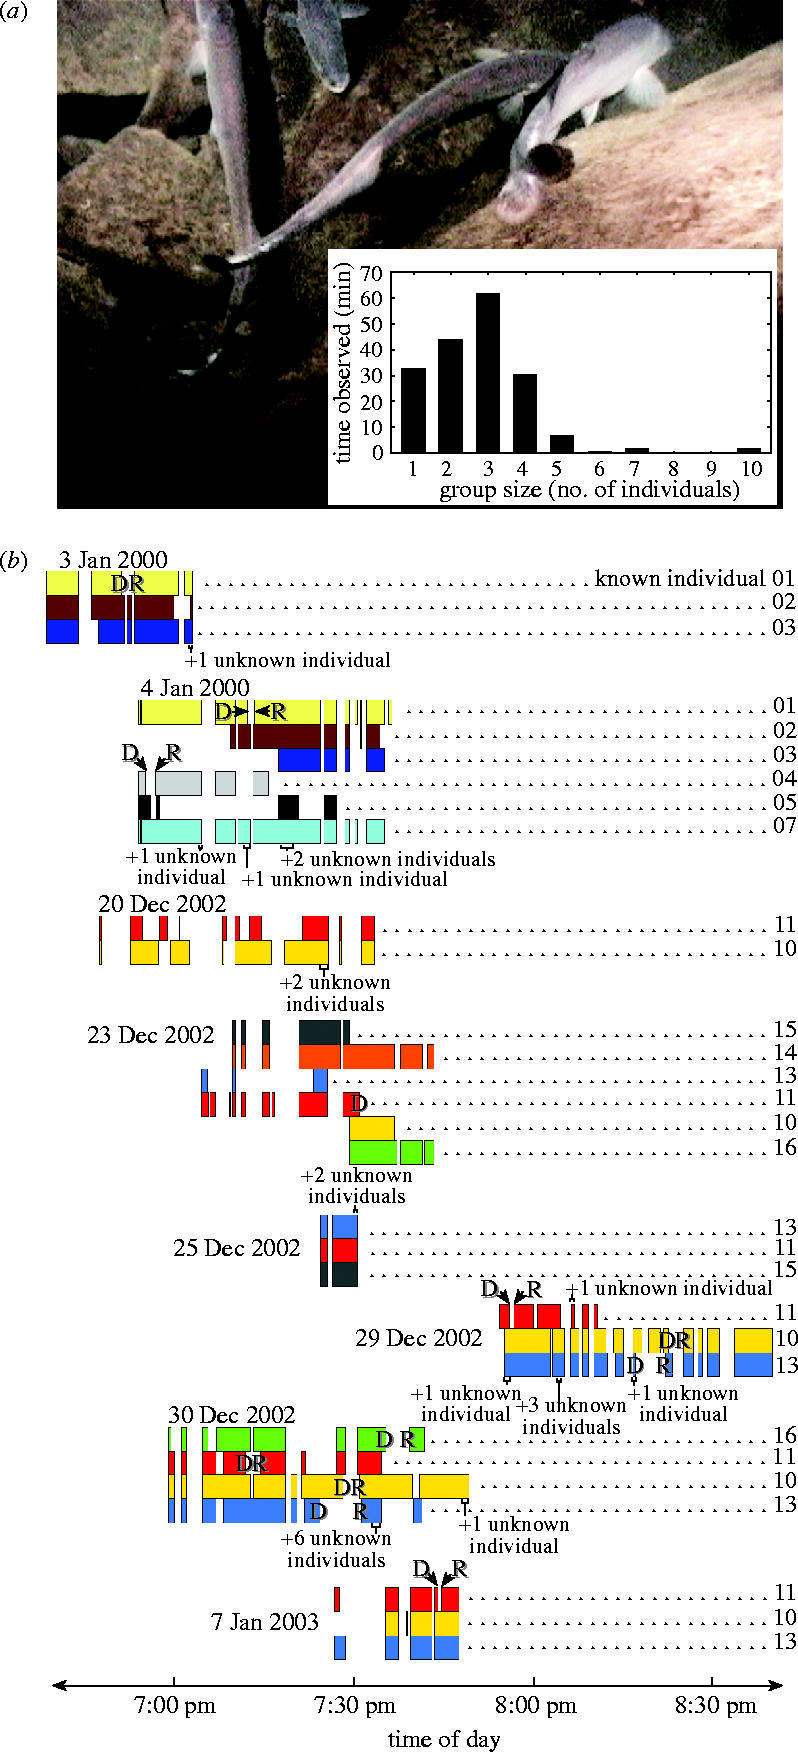
Gregarious hunting by M. anguilloides. (a) Group of four individuals searching for prey; (inset) size distribution of hunting groups. (b) Tracings constructed from all video recordings of continuously swimming individuals in search of prey. Placement and width of rectangles (coloured differently for unique individuals) indicate time of day and sighting duration for predators composing coherent groups whenever simultaneously recorded. ‘Known’ individuals that simultaneously entered (or exited) the recordist's field of observation, causing gaps in the tracings, were first (or last) seen swimming together in the same general direction and at the same approximate speed. Brief sightings are also shown for ‘unknown’ (i.e. non-focal) groups or individuals (also with distinctive body markings) that were not followed. ‘D’ and ‘R’ refer to stereotyped, rapid departure responses of single individuals upon prey capture and their eventual return to their same group, respectively.
The focal groups remained coherent at night, despite encounters in their presumed hunting range with non-focal conspecifics, some of which were members of other hunting groups on the reef (figure 3b). Indicative of group coherence, individual predators often rapidly departed upon capturing a cichlid, only to rejoin their original group after it had travelled as far as approximately 10 m in search of additional cichlids (figure 3b). A risk of having captured prey stolen by another member of an individual's hunting group (1 case observed) may be responsible for these temporary departures (occurring in 12 out of 13 cases when prey were not swallowed immediately). Given the restricted active space of EODs (Knudsen 1975; Moller 1995), departed predators probably lost electric contact with their group. It is unclear whether they used other potential cues (e.g. the sound of strike attempts) to orientate to conspecifics or if the departed individuals rejoined their group at preferred foraging sites. In addition, we could not determine whether departed individuals approached other groups before the correct one was located. Nevertheless, compositions of the groups we followed were relatively stable within and across nights, despite temporary mergings with other conspecifics in their hunting ranges. This observation suggests that individual recognition maintains group integrity. In other mormyrid species, individual variation in the EOD waveform (Friedman & Hopkins 1996) has been shown to provide sufficient information for individual recognition (Graff & Kramer 1992). Total EOD durations of M. anguilloides recorded in the current study ranged from 0.7 to 2.4 ms, raising the possibility that such waveform differences underlie group member recognition. Electrical playback experiments are needed to test this hypothesis, as are future efforts to map the ranges of neighbouring groups comprehensively.
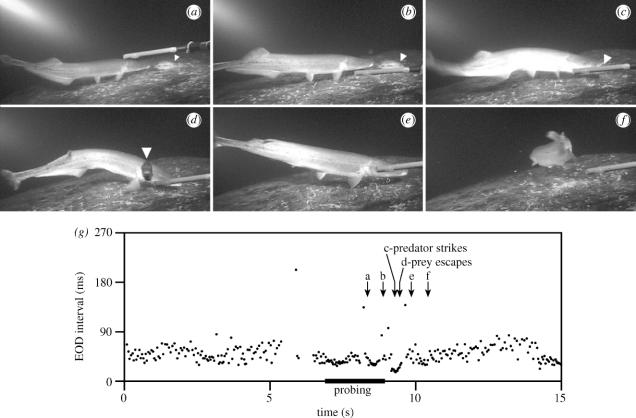
By detecting distortions in their own electric field, mormyrids can detect objects and discriminate their size, distance and electrical properties in the dark (von der Emde 1999). A number of laboratory studies have examined changes in the SPI during electrolocation by applying classical conditioning (von der Emde 1992) or introduction of novel stimuli (Toerring & Belbenoit 1979) to reliably elicit behaviour. In this study, SPIs of solitary M. anguilloides were characterized by irregular intervals ranging from approximately 40–300 ms whenever individuals were swimming across the reef but were not actively engaged in search or inspection behaviours. While searching the rocky substrate for cichlids, SPIs became more regular, and average intervals ranged from 40 to 70 ms. M. anguilloides first exhibited orientation responses to potential prey at a range of 0.3–1 predator body length. Typically, the predator then decreased its speed substantially, approached slowly to within 1–20 cm of the prey, and performed an inspection behaviour similar to ‘stationary probing’ described for other mormyrid species in the laboratory (Toerring & Belbenoit 1979; von der Emde 1992; Moller 1995). While probing, the predator remained nearly motionless. Analysis of electrical recordings revealed that predators decreased and regularized their pulse intervals to approximately 20–40 ms during stationary probing (e.g. figure 4).
Figure 4.
Video recording and SPI of a solitary predator during a typical hunting sequence. Still frames show: (a,b) stationary probing directed at a cichlid (white triangle); (c) strike attempt; (d) rapid prey escape towards the camera; and (e,f) resumption of searching by the predator. The recording electrode is visible in the foreground. (g) SPI during the same behavioural sequence (frame times marked by arrows; duration of stationary probing indicated by the black bar). A drop in intervals near the end of the plot corresponds to the probing of a second cichlid (also followed by an unsuccessful strike).
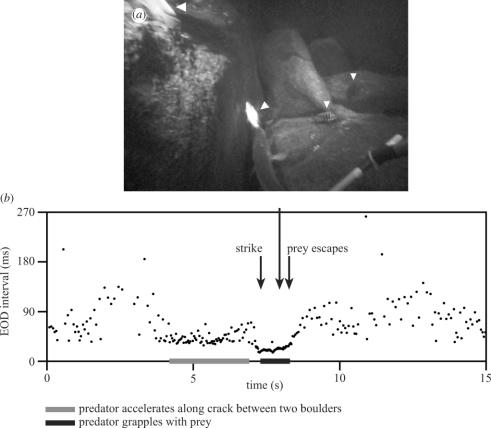
Of the 236 probing events, 73 were followed by strikes within a few seconds. Targeted cichlids often displayed little movement between the onset of probing and a strike, suggesting unawareness of predator proximity in many cases. During strikes, intervals characteristic of probing were maintained by the predators, or they were further stepped down to 18–20 ms (e.g. figure 5). EOD accelerations such as these enhance detection performance (Heiligenberg 1980), much like increased sound pulse rate augments echolocation performance in bats (Griffin 1958). A total of 17 cichlids were successfully captured. Cichlids that were probed but passed up were relatively larger than cichlids at which strike attempts were directed (p=0.0051; figure 6), implying that stationary probing and EOD accelerations allow M. anguilloides to estimate prey size. Determining the degree to which prey size can be judged via EOD-mediated (i.e. active) electrolocation, however, will require experiments that control for illumination in the visible spectrum, as well as other potential cues such as those sensed by ampullary (i.e. passive) electroreceptors or lateral line mechanoreceptors (Moller 2002).
Figure 5.
(a) Video capture of a predation attempt showing the position of four cichlids (white triangles). (b) SPI during the capture attempt. In this example, the predator accelerated its swimming speed towards a cichlid hiding in a crack between two boulders, while reducing and regularizing its EOD intervals. The predator further decreased its EOD intervals when it struck at the prey and temporarily captured it. The predator briefly grappled with the prey, but the cichlid escaped and fled.
Figure 6.
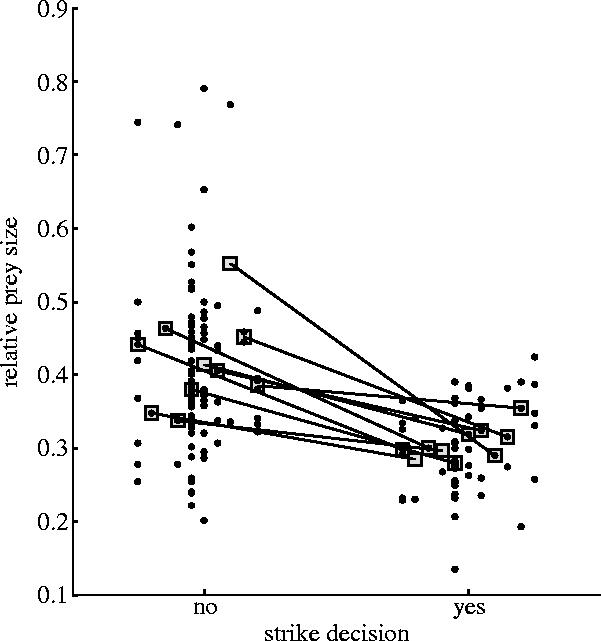
Relative prey sizes for two categories of predatory behaviour: strike decision= ‘no’; strike decision=‘yes’. Within each category, points corresponding to the same predator are aligned vertically and dithered relative to those of other individuals. Five strike attempts by ‘unknown’ individuals (see figure 3) are plotted at the far right. Prey size differs significantly between categories, whether predator medians (boxes connected by lines; p=0.0051; Wilcoxon paired-sample test) or all prey (p<0.000 01; Mann–Whitney U test) are compared.
Cohesive gregarious hunting in M. anguilloides begs the question, why should these fish hunt in close proximity to conspecifics if cichlids are abundant, kills are not divided and the possibility of intraspecific kleptoparasitism exists (Brockmann & Barnard 1979)? The observed rate of prey capture by individuals in groups (2.09 cichlids per predator per hour of hunting) exceeded that of solitary hunters (1.90 cichlids per predator per hour of hunting). In terms of behavioural events, we recorded a total of 16 successful captures and 181 unsuccessful acts of predatory effort (unsuccessful strikes and probing not followed by strikes) from predators hunting in groups (8.1% success). By contrast, solitary hunters successfully caught 1 cichlid and carried out 86 unsuccessful acts (1.1% success). Because most individuals rarely hunted alone, we were only able to compare grouped and solitary success within a single predator (individual no. 10; 3 captures and 47 unsuccessful acts when grouped; 0 captures and 69 unsuccessful acts when solitary; p=0.0393; χ2 test; Zar 1999).
We do not mean to imply that these observations provide definitive evidence of a group hunting advantage. Rather, our findings warrant additional experiments to confirm whether group predation actually augments the efficiency of resource acquisition by M. anguilloides. Coordinated hunting tactics were not obvious in our recordings, although enhanced capture rates (or increased success of predatory attempts) by individuals in packs might still arise from secondary captures of fleeing prey without overt coordination. Eventual detection of probing by some cichlids and rapid prey-escape responses to strikes resulted in a consistent scramble of cichlids among the grouped predators. In six cases, adjacent predators (less than half a body length apart) made multiple strikes at the same fleeing cichlid within 300 ms. In one case, a captured cichlid wriggled from the jaws of one predator only to be immediately captured by a second predator from the same hunting group.
Numerous observations have been made of other piscivorous fishes engaging in coordinated hunting. Herding by groups of jacks or tunas is thought to confuse and divide schools of prey fishes (Hiatt & Brock 1948; Schmitt & Strand 1982). Using field enclosures, Major (1978) demonstrated that this predatory behaviour can increase feeding efficiency. Deelder (1951) first applied the term ‘pack hunting’ to predatory fishes based on his observations of apparent cooperative foraging in perch. Predation by feeding shoals of migrating African catfish has subsequently been described as pack hunting (Merron 1993). What is missing from these reports, however, is evidence of temporally stable associations that characterize pack hunting carnivores and cetaceans (Kruuk 1966; Baird & Whitehead 2000). In our observations, predatory associations of M. anguilloides appeared relatively stable over nearly three weeks. Future study may reveal even longer lasting hunting associations in M. anguilloides, as well as confirm stable associations suspected in piranhas (Sazima & Machado 1990) and other kinds of fishes (Bshary et al. 2002).
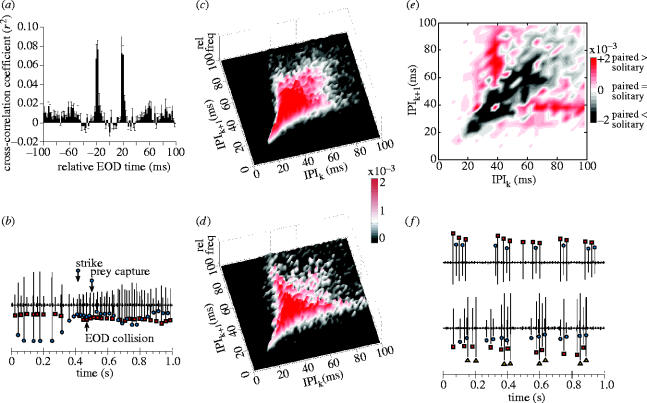
While hunting in groups, EOD regularizations and accelerations of individuals appeared similar to those of isolated fish. Considering the relative timing of EODs, however, there was a strong tendency for predators in groups to phase-lock EODs at approximately 18–20 ms delays relative to one another (figure 7a). This taxonomically widespread mormyrid ‘echo response’ (Russell et al. 1974; Heiligenberg 1977; Lücker & Kramer 1981; Moller 1995; Schuster 2001) is particularly robust in M. anguilloides in the wild. Significant cross-correlation peaks were found at −20 and +20 ms (i.e. symmetric echoing) in six out of eight dyads, and a single significant peak occurred in the remaining two dyads examined. Consistent with its ubiquitous and symmetrical nature in M. anguilloides, echoing is thought to be a jamming avoidance strategy. When the EOD of a neighbour is detected, an echoing fish adjusts the timing of its next EOD to minimize the likelihood of an EOD collision, which can impair electrolocation (Heiligenberg 1977). Despite echoing by each fish, individuals in groups typically generated EODs at their own variable rate (e.g. figures 2a and 7b).
Figure 7.
Interactions in EOD output of multiple predators. (a) Mean cross-correlation histogram of EOD occurrence times (±s.e.m.; n=8 pairs). (b) Voltage trace recorded from two hunting fish (different symbols mark the EODs of each individual). Reciprocal echoing at the beginning of the trace broke down and a collision of EODs occurred when both individuals increased their EOD output rates upon encountering a cichlid. Neither predator performed ‘stationary probing’. One predator captured the cichlid and rapidly departed. (c) Surface plot showing a JIH of pulse interval data from 13 video clips of solitary hunters (15 398 EOD intervals total). Each interpulse interval (IPIk+1) is plotted as a function of the preceding interval (IPIk), and the relative frequencies within each bin are indicated by surface height and colour (bin width=2 ms). (d) Same plot as in (c) but for pulse interval data from eight video sequences of paired hunters (5766 EOD intervals total). The colour bar (to the right, between (c) and (d)) is the relative frequency scale for both plots. (e) Contour plot of the difference between (d) and (c) (paired hunter JIH – solitary hunter JIH; bin width=4 ms). Contour height (red, positive difference) or depth (grey, negative difference) is indicated by the colour bar to the right. (f) Two examples of synchronized bursting: (upper voltage trace) between two individuals upon encountering one another after a brief separation during hunting; (lower trace) among three individuals in their cave shelter during a pause from hunting.
Another kind of electrical interaction among group members was revealed through the construction of JIHs. A JIH of the EODs produced by solitary hunters (figure 7c) reveals a strong linear dependence between adjacent EOD intervals less than 35 ms, reflecting the regularity of EOD intervals generated during probing and strikes. This linear dependence diminishes for larger intervals, however, as the distribution becomes more scattered (figure 7c), reflecting the less regular SPI patterns generated at other times. A second JIH generated for paired hunters (figure 7d) reveals a similar linear dependency for intervals less than 35 ms. For larger intervals, however, the JIHs of solitary and paired hunters had very different distributions, which became especially clear after subtracting the JIH of solitary hunters from the JIH of paired predators (figure 7e). This difference distribution reveals that the SPI patterns of paired hunters were characterized by a relatively high degree of ‘burstiness’, with intraburst EOD intervals tightly clustered at approximately 40 ms (Krahe & Gabbiani 2004).
Analysing the timing of burst production revealed that these bursts were generated synchronously by multiple individuals (figure 7f). EOD bursts have been associated with communication in a number of mormyrid species in the laboratory (Hopkins 1986; Kramer 1990; Moller 1995; Carlson 2002), but synchronized bursting has not been previously described. Relative to the ubiquity of echoing, bouts of synchronous bursting were brief (1–2.5 s) and discrete, with long intervals (up to several min) between them. They were particularly common when solitary hunters encountered members of their own group after temporary separation.
Although EOD activity within the bursts was characterized by reciprocal echoing (figure 7f), jamming avoidance is probably not the principal function of synchronized bursts because of their discreteness and more restricted behavioural context compared with echoing. Another distinction between these behaviours is that synchronously bursting fish not only echo individual EOD pulses, they also modify the frequency of EOD production in tandem. In contrast to sustained reciprocal echoing (figure 7b), the fish pause and discharge together during synchronized bursting, simultaneously modulating their rate of EOD production over time (figure 7f). Despite this synchrony in EOD rates, however, the maintenance of the echo response within the bursts indicates that electrolocation performance is not affected by this behaviour. Synchronous bursting in M. anguilloides may serve a function similar to other group cohesion signals that are common in socially foraging or pack-hunting animals and often involve mutual displays (Bradbury & Vehrencamp 1998). Based on the tight temporal coupling of synchronized bursts, we hypothesize that the bidirectional information conveyed by this unique electrical display is mutual acknowledgement of recognition, which would deter aggression and promote pack integrity. Testing our hypothesis will require playback experiments, which may be possible in the field given the relative ease of observing freely behaving M. anguilloides in their natural habitat compared with other mormyrid species.
Cognition and social interactions in fishes are increasingly being recognized as complex (Bshary et al. 2002). Our observations underscore the fact that unexpected behavioural richness can be revealed when model organisms are studied in their natural environment. M. anguilloides exerts a previously unknown predatory pressure on rock-dwelling cichlids of Lake Malawi using a private, electrosensory channel to evaluate and target prey, thereby potentially affecting cichlid evolution without constraining colour diversification. Our discovery of a behaviour resembling pack hunting in M. anguilloides demonstrates the existence of relatively well-developed social interactions in a basal vertebrate lineage outside the context of cooperative reproduction or cleaner fish mutualisms (Taborsky 2001; Bshary et al. 2002). Compared with pack-hunting carnivores and cetaceans, M. anguilloides provides a more tractable system with which to address a number of key questions raised by the observation of social predation, including the neural bases of individual recognition, spatial learning, group cohesion and navigation, as well as evolutionary questions related to the behavioural rules and functional significance of gregarious hunting.
Acknowledgments
This research was supported by an NIH/NIMH training grant (2 T32 MH15793 to M.E.A.). A. Ambali, J. Markert and Z. Sacranie generously offered logistical assistance in Malawi. Post-recording analysis was facilitated by C. Pelkie (and the Cornell Theory Center). B. Land provided advice on recording techniques and data visualization. We thank the entire Hopkins laboratory, G. von der Emde, P. Wrege, M. Kawasaki, T. Eisner, H.K. Reeve, P. McIntyre, A. Bass, A. McCune, P. Skelton and D. Elias for helpful conversations that refined our interpretations and improved our presentation.
References
- Baird R.W, Whitehead H. Social organization of mammal-eating killer whales: group stability and dispersal patterns. Can. J. Zool. 2000;78:2096–2105. [Google Scholar]
- Bradbury J.W, Vehrencamp S.L. Sinauer; Sunderland, MA: 1998. Principles of animal communication. [Google Scholar]
- Brockmann H.J, Barnard C.J. Kleptoparasitism in birds. Anim. Behav. 1979;27:487–514. [Google Scholar]
- Bshary R, Wickler W, Fricke H. Fish cognition: a primate's eye view. Anim. Cogn. 2002;5:1–13. doi: 10.1007/s10071-001-0116-5. [DOI] [PubMed] [Google Scholar]
- Carlson B.A. Electric signaling behavior and the mechanisms of electric organ discharge production in mormyrid fish. J. Physiol. (Paris) 2002;96:405–419. doi: 10.1016/S0928-4257(03)00019-6. [DOI] [PubMed] [Google Scholar]
- Chatfield C. 6th edn. Chapman & Hall/CRC Press; Boca Raton, FL: 2004. The analysis of time series: an introduction. [Google Scholar]
- Deelder C.L. A contribution to the knowledge of the stunted growth of perch (Perca fluviatilis L.) in Holland. Hydrobiologia. 1951;3:357–378. [Google Scholar]
- Friedman M.A, Hopkins C.D. Tracking individual mormyrid electric fish in the field using electric organ discharge waveforms. Anim. Behav. 1996;51:391–407. [Google Scholar]
- Graff C, Kramer B. Trained weakly-electric fishes Pollimyrus isidori and Gnathonemus petersii (Mormyridae, Teleostei) discriminate between waveforms of electric pulse discharges. Ethology. 1992;90:279–292. [Google Scholar]
- Griffin D.R. Yale University Press; New Haven, CT: 1958. Listening in the dark. [Google Scholar]
- Heiligenberg W. Studies in brain function. Springer; New York: 1977. Principles of electrolocation and jamming avoidance in electric fish: a neuroethological approach. [Google Scholar]
- Heiligenberg W. The evaluation of electroreceptive feedback in a gymnotoid fish with pulse-type electric organ discharges. J. Comp. Physiol. A. 1980;138:173–185. [Google Scholar]
- Hiatt R.W, Brock V.E. On the herding of prey and the schooling of the black skipjack, Euthynnus yaito Kishinouye. Pac. Sci. 1948;2:297–298. [Google Scholar]
- Hopkins C.D. Behavior of Mormyridae. In: Bullock T.H, Heiligenberg W, editors. Electroreception. Wiley; New York: 1986. pp. 527–576. [Google Scholar]
- Knudsen E.I. Spatial aspects of the electric fields generated by weakly electric fish. J. Comp. Physiol. 1975;99:103–118. [Google Scholar]
- Kocher T.D. Adaptive evolution and explosive speciation: the cichlid fish model. Nat. Rev. Genet. 2004;5:288–298. doi: 10.1038/nrg1316. [DOI] [PubMed] [Google Scholar]
- Kohda M. Intra- and interspecific social organization among three herbivorous cichlid fishes in Lake Tanganyika. Japan J. Ichthyol. 1991;38:147–163. [Google Scholar]
- Krahe R, Gabbiani F. Burst firing in sensory systems. Nat. Rev. Neurosci. 2004;5:13–23. doi: 10.1038/nrn1296. [DOI] [PubMed] [Google Scholar]
- Kramer B. Springer; New York: 1990. Electrocommunication in teleost fishes: behavior and experiments. [Google Scholar]
- Kruuk H. Clan-system and feeding habits of spotted hyaenas (Crocuta crocuta Erxleben) Nature. 1966;209:1257–1258. [Google Scholar]
- Lissmann H.W, Machin K.E. The mechanism of object location in Gymnarchus niloticus and similar fish. J. Exp. Biol. 1958;35:451–486. [Google Scholar]
- Lücker H, Kramer B. Development of a sex difference in the preferred latency response in the weakly electric fish, Pollimyrus isidori (Cuvier et Valenciennes) (Mormyridae, Teleostei) Behav. Ecol. Sociobiol. 1981;9:103–109. [Google Scholar]
- Major P.F. Predator–prey interactions in two schooling fishes, Caranx ignobilis and Stolephorus purpureus. Anim. Behav. 1978;26:760–777. [Google Scholar]
- Merron G.S. Pack-hunting in two species of catfish, Clarias gariepinus and C. ngamensis, in the Okavango Delta, Botswana. J. Fish. Biol. 1993;43:575–584. [Google Scholar]
- Moller P. Chapman & Hall; New York: 1995. Electric fishes: history and behavior. [Google Scholar]
- Moller P. Multimodal sensory integration in weakly electric fish: a behavioral account. J. Physiol. (Paris) 2002;96:547–556. doi: 10.1016/S0928-4257(03)00010-X. [DOI] [PubMed] [Google Scholar]
- Motta P.J, Wilga C.D. Advances in the study of feeding behaviors, mechanisms, and mechanics of sharks. Environ. Biol. Fish. 2001;60:131–156. [Google Scholar]
- Nelson J.S, Chou L.M, Phang V.P.E. Pigmentation variation in the anemonefish Amphiprion ocellaris (Teleostei: Pomacentridae): type, stability and its usefulness for individual identification. Raffles Bull. Zool. 1994;42:927–930. [Google Scholar]
- Nursall J.R. Some behavioral interactions of spottail shiners (Notropis hudsonius), yellow perch (Perca flavescens), and northern pike (Esox lucius) J. Fish. Res. Board Can. 1973;30:1161–1178. [Google Scholar]
- Potts G.W. The predatory behaviour of Caranx melampygus (Pisces) in the channel environment of Aldabra Atoll (Indian Ocean) J. Zool. Lond. 1980;192:323–350. [Google Scholar]
- Rose G.J. Insights into neural mechanisms and evolution of behaviour from electric fish. Nat. Rev. Neurosci. 2004;5:943–951. doi: 10.1038/nrn1558. [DOI] [PubMed] [Google Scholar]
- Russell C.J, Myers J.P, Bell C.C. The echo response in Gnathonemus petersii (Mormyridae) J. Comp. Physiol. 1974;92:181–200. [Google Scholar]
- Sazima I, Machado F.A. Underwater observations of piranhas in western Brazil. Environ. Biol. Fish. 1990;28:17–31. [Google Scholar]
- Schmitt R.J, Strand S.W. Cooperative foraging by yellowtail, Seriola lalandei (Carangidae), on two species of fish prey. Copeia. 1982;1982:714–717. [Google Scholar]
- Schuster S. Count and spark? The echo response of the weakly electric fish Gnathonemus petersii to series of pulses. J. Exp. Biol. 2001;204:1401–1412. doi: 10.1242/jeb.204.8.1401. [DOI] [PubMed] [Google Scholar]
- Taborsky M. The evolution of bourgeois, parasitic, and cooperative reproductive behaviors in fishes. J. Heredity. 2001;92:100–110. doi: 10.1093/jhered/92.2.100. [DOI] [PubMed] [Google Scholar]
- Toerring M.J, Belbenoit P. Motor programmes and electroreception in mormyrid fish. Behav. Ecol. Sociobiol. 1979;4:369–379. [Google Scholar]
- von der Emde G. Electrolocation of capacitive objects in four species of pulse-type weakly electric fish. II. Electric signalling behaviour. Ethology. 1992;92:177–192. [Google Scholar]
- von der Emde G. Active electrolocation of objects in weakly electric fish. J. Exp. Biol. 1999;202:1205–1215. doi: 10.1242/jeb.202.10.1205. [DOI] [PubMed] [Google Scholar]
- Zakon H.H. Insight into the mechanisms of neuronal processing from electric fish. Curr. Opin. Neurobiol. 2003;13:744–750. doi: 10.1016/j.conb.2003.07.001. [DOI] [PubMed] [Google Scholar]
- Zar J.H. 4th edn. Prentice Hall; Upper Saddle River, NJ: 1999. Biostatistical analysis. [Google Scholar]


