Abstract
Prior studies have shown that exposure to carbon monoxide (CO) will elevate the steady-state concentration of nitric oxide (⋅NO) in several cell types and body organs and that some toxic effects of CO are directed toward endothelial cells. Studies reported in this paper were conducted with bovine pulmonary artery endothelial cells exposed to 10 to 100 ppm CO to achieve concentrations between 11 and 110 nM in air-saturated buffer. Exposure to 11 nM CO increased synthesis of manganous superoxide dismutase and conferred resistance against the lethal effects of 110 nM CO. At concentrations of 88 nM CO or more, exposures for 1 h or longer caused cell death that became apparent 18 h after the exposure ceased. Caspase-1 was activated in response to CO, and cell death was inhibited by a caspase-1 inhibitor. Alteration of proteolytic pathways by CO was indicated by the presence of ubiquitin-containing intracellular inclusion bodies. Morphological changes and caspase activation indicated that cell death was an apoptotic process. Cells exposed to 110 nM CO had higher concentrations of manganous superoxide dismutase and heme oxygenase-1 but no changes in glutathione peroxidase, glucose-6-phosphate dehydrogenase, thiols, or catalase. Elevated levels of antioxidant enzymes and apoptosis were inhibited by the nitric oxide synthase inhibitor, S-isopropylisothiourea, and the peroxynitrite scavenger, selenomethionine. These results show that biochemical effects of CO occur at environmentally relevant concentrations, that apoptotic cell death follows exposure to relatively high concentrations of CO, and that these actions of CO are mediated by nitric oxide.
Carbon monoxide (CO) is a ubiquitous environmental pollutant. The National Ambient Air Quality Standards in the United States for CO have been set at 35 ppm for a 1-h average exposure, and 9 ppm for an 8-h average exposure. Concentrations of CO found in urban environments have been correlated with hospital admissions, mortality, and morbidity caused by cardiovascular and pulmonary diseases (1–8). Average CO concentrations have been found to be 1–9 ppm, but there are many occupational settings where exposures exceed these levels (9–17). The carboxyhemoglobin values associated with levels of CO typically found in the environment are so low that a direct hypoxic stress is doubtful and compensatory responses are sufficient to maintain tissue oxygenation (18–21). Therefore, the pathophysiological basis for toxic effects of low concentrations of CO is not clear.
The goal of the current investigation was to evaluate the mechanism for cell death and manifestations of oxidative stress in cultured endothelial cells exposed to CO. Studies in humans have suggested that CO exposures will cause vascular and perivascular abnormalities (22–25); these suggestions increase interest regarding the effects of CO on endothelial cells. Our previous work with experimental animals has shown that CO has a number of effects on the vasculature. Nitrotyrosine is a major product when peroxynitrite reacts with proteins, and CO exposure will enhance formation of nitrotyrosine in endothelium of lung, aorta, and brain (26–28). CO also triggers a capillary leak and enhances leukocyte sequestration (26–28). All the CO-associated effects can be inhibited if synthesis of the free radical nitric oxide (⋅NO) is inhibited.
Results from electron paramagnetic resonance spectroscopy indicate that CO elevates the concentration of ⋅NO in lung and brain (26, 27). Endothelial cells and platelets exposed to CO in vitro have elevations in the steady-state concentration of ⋅NO. This effect can be reversed by exposure to light, and CO does not increase ⋅NO synthase activity, increase production of reduced oxygen species, or inhibit oxygen consumption (29–31). We hypothesize that CO disturbs the intracellular control of ⋅NO concentration by reducing the availability in unliganded or “free” endogenous hemoproteins. The elevation in steady-state ⋅NO concentration caused by exposure to CO leads to production of toxic ⋅NO-derived oxidants as assessed by measurements of nitrotyrosine and extracellular oxidation of para-hydroxyphenylacetic acid (26–31).
In previous studies with cultured bovine pulmonary artery endothelial cells (BPAEC), we demonstrated that CO caused cells to die in a delayed fashion by an ⋅NO-dependent process (29, 31). One of the common pathways associated with delayed cell death is activation of caspases, a family of cysteine-aspartate proteases (32–34). Typically, cytotoxic stimuli activate caspase-1 and caspase-3 sequentially, although alternative pathways have been described (34–37). We sought the role of caspases in CO-exposed cell death and also investigated the induction of antioxidant enzymes, which have been found to play a role in some programmed death processes (38).
Experimental Procedures
Materials.
All chemicals were obtained from Sigma unless otherwise stated. Diethylamine-NONOate (DENO) and 3-morpholinosyndnonimine (SIN-1) were purchased from Cayman Chemicals (Ann Arbor, MI). Antibodies raised in rabbits against heme oxygenase (HO)-1 and HO-2 were purchased from StressGen Biotechnologies (Victoria, Canada), and horseradish peroxidase-conjugated anti-rabbit IgG was from Roche Molecular Biochemicals.
Cell Culture.
Starter cultures of BPAEC were a gift from E. J. Macarack (Connective Tissue Research Institute, University of Pennsylvania). Cells culture techniques were the same as those described (29). Experiments were performed at 1 to 3 days after confluence was established and between the fourth and seventh culture passages. Control samples, which were exposed to air plus 5% carbon dioxide (CO2), were included with each study, and both control and CO-exposed cells were split from the same parent flasks.
CO Supply.
All work with CO was performed in a fume hood, and a CO monitor was operated continuously to assure against leaks from the high-pressure tanks of gas. The concentrations of CO chosen for study were 10 to 100 ppm in the gas phase. Therefore, the concentrations of CO dissolved in buffer ranged from 11 to 110 nM. The desired concentration of CO for each study was achieved by using published methods (29). At the start of the experiment, the growth medium was replaced with either air- or air plus CO-equilibrated Krebs buffer; the small gas space above the buffer was flushed with the appropriate gas mixture; and the cells were incubated at 37°C.
Ethidium Homodimer-1 Uptake.
After cells were incubated with Krebs buffer containing the desired concentration of CO, buffer was replaced with fresh medium equilibrated with air and 5% CO2 that contained 15 nM ethidium homodimer-1 (Molecular Probes). The cells were placed in a 37°C incubator and examined at intervals under a Nikon Diaphot-TND epifluorescence inverted microscope. Ethidium uptake was quantified in cells incubated for 18 h after CO exposure. The overlying medium was removed; cells were washed twice with PBS, removed from the plastic plates with a solution of 0.05% (wt/vol) trypsin and 0.2% (wt/vol) EDTA, counted in a phase-contrast microscope, and sonicated twice for 30 s on ice with a Heat Systems-Ultrasonics sonicator (model W220-F) at setting 6. The cell lysate was centrifuged at 1,000 × g for 10 min. Fluorescence was measured in a Perkin–Elmer LS 50 B fluorometer, and the results were expressed as relative fluorescence units per 1 × 10⁴ endothelial cells.
The ability of a brief exposure to CO to render cells tolerant to toxic effects of CO was assessed by incubating cells for 40 min with Krebs buffer equilibrated with air/CO2 or to air/CO2 plus 10 ppm CO (11 nM). After this exposure, cells were incubated with standard air-equilibrated growth medium for 3 h and then for 2 h with Krebs buffer equilibrated with air/CO2 or air/CO2 and 110 nM CO. After this procedure, cells were incubated for 18 h with standard growth medium plus ethidium, and then ethidium uptake was measured as described above.
Investigations on Selectivity of Reactions with Selenomethionine.
Studies were conducted to evaluate whether selenomethionine reacted with ⋅NO, superoxide (O2⨪), H2O2, and/or with peroxynitrite by using published techniques (29–31). In brief, whether selenomethionine reacted with ⋅NO was evaluated by first measuring the rate of liberation of ⋅NO when 0.2 μM DENO dissolved in PBS. A stable solution of 200 μM DENO was prepared in 50 mM potassium phosphate (pH 9.0), and an aliquot was added to PBS. Generation of ⋅NO was monitored by using a polarographic ⋅NO meter (Iso-NO, World Precision Instruments, Sarasota, FL) in solutions with or without up to 30 μM selenomethionine. Reactivity with peroxynitrite was documented by monitoring selenomethionine-mediated inhibition of the rate of oxidation of 57 μM dihydrorhodamine-123 to rhodamine by 100 μM SIN-1. Peroxidase activity was assessed by incubating solutions of selenomethionine with H2O2 and monitoring changes in absorbance of 240-nm light (ɛm = 43.6 M−1⋅cm−1). Scavenging of O2⨪ was assessed as the impact of selenomethionine on the superoxide dismutase (SOD)-inhibitable rate of cytochrome c reduction in preparations containing xanthine oxidase and hypoxanthine.
Caspase Activities.
Assays for caspase activities were performed in 50 mM Tris⋅HCl (pH 7.4) containing 1 mM EDTA, 1 mM EGTA, 1 mM PMSF, 3 mM dithioerythritol, and either 50 μM fluorescent substrate for caspase-1 (acetyl-Tyr-Val-Ala-Asp-amino-4-methyl coumarin) or a substrate for caspase-3 (acetyl-Asp-Glu-Val-Asp-amino-4-methylcoumarin). Cell lysates were added to the solution (50 μg of cell protein), and fluorescence was monitored by using an excitation wavelength of 380 nm, an emission wavelength of 460 nm, and a 10-nm slit in a Perkin–Elmer LS 50 B fluorometer. Caspase-1 activity was taken as the difference in rate of change of the fluorescence signal in solutions with acetyl-Tyr-Val-Ala-Asp-amino-4-methyl coumarin incubated in the absence versus the presence of 500 μM acetyl-Tyr-Val-Ala-Asp-chloromethylketone, a specific inhibitor of caspase-1.
Antioxidant Defenses in BPAEC.
Endothelial cells were exposed for 40 min to Krebs buffer saturated with air/5% CO2 or air/CO2 plus 10 or 100 ppm CO (11 to 110 nM). After incubation with standard growth medium for 3 h, cells were lysed, and cell debris was separated from lysate solution by centrifugation at 12,000 × g for 10 min.
For assays of HO activity, cells were lysed in 100 mM potassium phosphate (pH 7.4) containing 2 mM MgCl2. The assay was performed on a microwell plate by adding aliquots of lysate to achieve a final volume of 200 μl of 100 mM potassium phosphate (pH 7.4) that contained 2 mM MgCl2, 200 μM glucose-6 phosphate, 160 μM NADPH, 0.2 units glucose-6-phosphate dehydrogenase, 40 μM hemin, and 0.3 mg of protein from rat liver cytosol. Liver cytosolic protein was prepared by homogenizing Wistar rat liver in 4 ml of PBS per g of liver, then centrifuging the homogenate at 755 × g for 10 min, and centrifuging the supernatant at 8,700 × g for 10 min and then at 105,000 × g for 45 min. The rate of bilirubin formation was measured while samples were incubated at 37°C by using a wavelength of 464 nm in a plate reader. Because there was always a background rate of rise in 464-nm absorbance in the multicomponent suspension, the activity related to HO was taken as the difference in rate between samples incubated in the absence versus presence of 50 μM tin protoporphyrin IX, an inhibitor of HO activity.
Assays of SOD were performed with cell lysates prepared in 50 mM potassium phosphate (pH 7.8) containing 1 mM diethylenetriamine pentaacetic acid, 50 μM bathocuproine sulfonate, 1 unit of catalase, and 0.13 mg/ml BSA according to methods described by Spitz and Oberley (39). Reduction in optical density of 28 mM nitroblue tetrazolium was monitored at 560 nm in lysis buffer containing 0.5 mM xanthine and sufficient xanthine oxidase to yield a rate of reduction in the absence of cell lysate of 0.02 OD units/min. The contributions of manganous SOD (MnSOD) versus copper-zinc SOD (CuZn SOD) were determined by running assays at pH 7.8 in the absence and presence of 5 mM NaCN and also at pH 10.0.
Glutathione peroxidase and catalase assays were performed after cells were lysed in 50 mM potassium phosphate (pH 7.4) with 1 mM diethylenetriamine pentaacetic acid and in 50 mM potassium phosphate (pH 7.6) with 0.5 mM MgCl2 for the glucose-6-phosphate dehydrogenase assays. Glutathione peroxidase was assessed as the rate of oxidation of 1 mM NADPH (ɛm at 340 nm = 6.22 × 10⁻⁶ M−1⋅cm−1) in lysis buffer containing 1 mM glutathione, 1.4 units glutathione reductase, and 1 mM H2O2. Catalase was measured by adding cell lysate (≈40 μg of cell protein) to lysis buffer containing 10 mM H2O2, and the rate of H2O2 disappearance was assessed with a spectrophotometer set at 240 nm. Glucose-6-phosphate dehydrogenase was assayed as described by Monaco et al. (40) by monitoring formation of NADPH in lysis buffer after subtracting the activity associated with 6-phosphogluconate dehydrogenase.
Reduced sulfhydryls were assayed in cells lysed by sonication in 50 mM potassium phosphate (pH 7.4) with 1 mM diethylenetriamine pentaacetic acid as described above. Lysate aliquots were incubated in 100 mM potassium phosphate (pH 8.1) with 70 μM 5,5′-dithio-bis(2)-nitrobenzoic acid. Reduced sulfhydryls were assayed by measuring the optical density of the solution at 412 nm. A standard curve was generated by using cysteine.
Microscopic Imaging.
Cells were exposed for 2 h in buffer preequilibrated with air/CO2 or air/CO2 plus 110 nM CO, as was done for the ethidium-uptake studies. The buffer was removed and replaced with growth medium that had been equilibrated with air/5% CO2, and the cells were incubated at 37°C for 2 h. Medium was removed, and cells were fixed for imaging as follows.
For electron microscopy studies, cells were washed twice in 0.1 M sodium cacodylate (pH 7.3) and fixed for 1 h in an ice cold solution of 2.5% (wt/vol) glutaraldehyde in 0.1 M sodium cacodylate (pH 7.3). Cells were scraped from the plastic dishes, washed at 4°C for 1 h in buffer, and centrifuged at 1,000 × g for 10 min. Cells were postfixed in a solution of 2% (wt/vol) osmium tetroxide in 0.1 M sodium cacodylate buffer at 4°C for 1 h, rinsed, and dehydrated by using graded acetone solutions [30%, 50%, 70%, 95%, and finally 100% (vol/vol)] with changes occurring every 20 min. Cells were embedded in Polybed 812 epoxy resin, sectioned, and imaged by using a Jeol JEM-100 CX electron microscope.
Fluorescence microscopy for ubiquitin was performed on cells washed with PBS, and cells were fixed with 80% (vol/vol) methanol for 10 min and placed onto poly-l-lysine-coated glass slides. Samples were incubated for 30 min in PBS containing 0.3% (vol/vol) Triton X-100, 5% (wt/vol) fatty acid-free BSA, and 10% (vol/vol) normal goat serum. Slides were washed in PBS containing 0.3% (vol/vol) Triton X-100 and incubated for 3 h in a 1:500 dilution of mouse anti-ubiquitin antibody from Biomol (Plymouth Meeting, PA). After washing for 5 min, slides were stained for 1 h with a 1:2,000 dilution of anti-mouse IgG conjugated with Cy3, washed, dried, coverslipped, and examined with a Nikon Diaphot-TND epifluorescence inverted microscope.
Western Blot Analysis.
Western analysis was performed on cell lysates diluted to a concentration of 100 μg of protein/10 μl in 0.1 M PBS containing 2% (vol/vol) SDS, 10% (vol/vol) glycerol, 5% (vol/vol) β-mercaptoethanol, and 0.00125% bromophenol blue, and cell lysates were boiled for 5 min. Cell protein (100 μg) subjected to SDS/12% PAGE was transferred to 0.45 μm poly(vinylidene difluoride) membrane (Bio-Rad) and incubated for 2 h with PBS containing 0.1% Tween 20 and 5% (vol/vol) nonfat dry milk and then for 2 h with either rabbit anti-HO-1 or anti-HO-2 antiserum (1:1,000 dilution). Membranes were washed and incubated with horseradish peroxidase-conjugated anti-rabbit IgG (1:3,000 dilution from Roche Molecular Biochemicals); imaging was carried out by enhanced chemiluminescence with enhanced chemiluminescence reagents and procedures obtained from Amersham Pharmacia on Kodak Reflection Film. The film was developed and scanned on a Microtek Scanmaker E6 (Redondo Beach, CA) with a transparency adaptor and analyzed with sigmascan (Jandel, Chicago).
Statistical Methods.
Statistical significance was determined by ANOVA followed by Scheffe's test. The level of significance was taken as P < 0.05. Results are expressed as means ± SEM.
Results
Ethidium Homodimer-1 Uptake.
Uptake of the vital stain, ethidium homodimer-1, was used to assess the delayed lethality of various CO exposures. As in previous investigations (29, 31), we observed no acute death in cells, but ethidium uptake was significantly increased 18 h after cells had been exposed to buffer equilibrated with 100 ppm CO (110 nM CO) for 2 h (see Experimental Procedures for exposure details). The mean ethidium uptake in control cultures was 0.31 ± 0.02 arbitrary fluorescent units per 1 × 10⁴ cells (n = 38), and in CO-exposed cells, it was 0.52 ± 0.04 per 1 × 10⁴ cells (n = 48; P < 0.001). To assess the impact of interventions over the course of the investigation, differences in ethidium uptake were compared against control samples included with each experiment. Therefore, results are expressed as the difference from control throughout this paper.
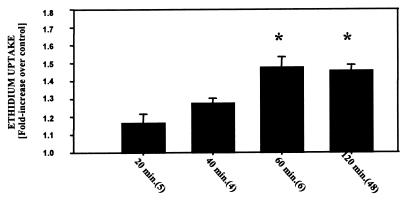
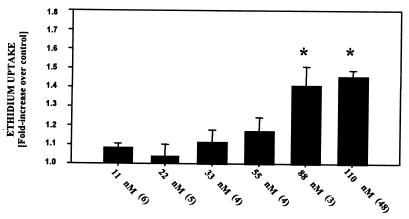
We first assessed the impact of duration of the CO exposure on delayed death. Cells were exposed to buffer that contained 110 nM CO for 20 min to 2 h. The magnitude of cell death, quantified by the fluorescence in cells 18 h later, was significantly increased when cells were exposed to CO for 60 or 120 min (Fig. 1). Ethidium uptake was also significantly increased when cells were exposed for 2 h to 88 nM CO but not when lower CO concentrations were used (Fig. 2).
Figure 1.
Uptake of ethidium homodimer-1 after various times of exposure to CO. Results are expressed as the difference in ethidium concentration 18 h after cells were incubated for 20 to 120 min in buffer containing 110 nM CO. Values are means ± SEM; numbers in parentheses indicate the number of trials. *, P < 0.05 (ANOVA).
Figure 2.
Uptake of ethidium homodimer-1 by BPAEC after exposure to various concentrations of CO. Results are expressed as the difference in ethidium concentration 18 h after cells were exposed for 2 h to buffer containing from 11 to 110 nM CO. Values are means ± SEM; numbers in parentheses indicate the number of trials. *, P < 0.05 (ANOVA).
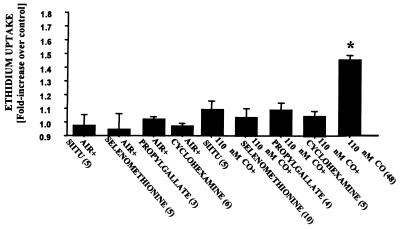
Several agents were found to inhibit CO-mediated killing if cells were incubated with the agent for 2 h preceding CO exposure (Fig. 3). Protective effects were observed with 100 μM SIITU, a potent competitive inhibitor of endothelial NO synthase activity (41); with 50 μM propyl gallate, an antioxidant; and with 30 μM selenomethionine. Selenomethionine is an agent reported to be effective for inhibiting reactions mediated by peroxynitrite (42). The three inhibitors of CO-mediated death had no significant effect on control cells (Fig. 3).
Figure 3.
Uptake of ethidium homodimer-1 by BPAEC after exposure to various agents. Results are expressed as the difference in ethidium concentration 18 h after cells were exposed for 2 h to buffer containing 100 μM S-isopropylisothiourea (SIITU), 30 μM selenomethionine, 50 μM propyl gallate, or 10 μg/ml cycloheximide saturated with air and 5% CO2 (control) or to the same buffer but with the addition of 110 nM CO. Values are means ± SEM; numbers in parentheses indicate the number of trials. *, P < 0.05 (ANOVA).
Morphological Changes in BPAEC Induced by CO Exposure.
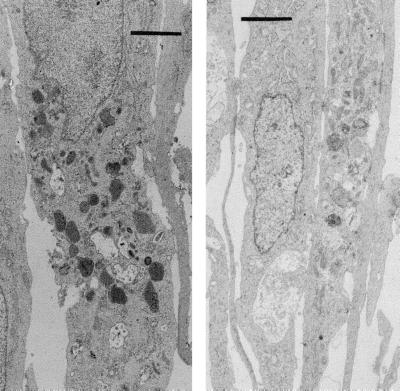
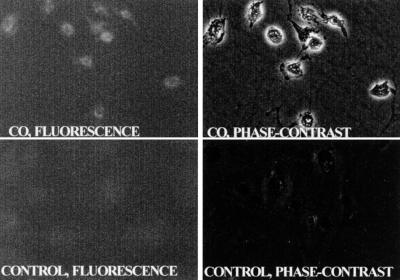
Cells were exposed for 2 h to buffer equilibrated with either air/CO2 or air/CO2 plus 110 nM CO and then fixed after a 2-h incubation with standard growth medium (see Experimental Procedures). There were three major differences in the appearance of CO-exposed versus control cells. CO-exposed cells had granular and condensed chromatin; there were markedly fewer mitochondria; and numerous inclusion bodies were present throughout the cytoplasm (Fig. 4). We speculated that these inclusion bodies may have some relation to alteration of proteolytic processing by CO. Therefore, cells were fixed and stained with antibodies against ubiquitin. As shown in Fig. 5, a distinct perinuclear pattern of fluorescence was visualized in CO-exposed cells, whereas no staining was observed in control cells.
Figure 4.
Electron micrographs of cells fixed 2 h after a 2-h incubation in buffer. (Right) Control cells. (Left) Cells exposed to 110 nM CO. (Bars = 2 μm.)
Figure 5.
Fluorescence micrographs after incubation with anti-ubiquitin antibodies. Cells were fixed 2 h after a 2-h incubation in buffer. (Upper) Fluorescent and phase-contrast images of cells exposed to 110 nM CO. (Lower) Control cells.
Caspase Involvement in CO-Mediated Cell Death.
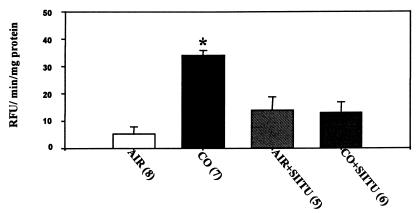
The cell death process triggered by CO exposure was inhibited when cells were incubated in the presence of cycloheximide (Fig. 3). Synthesis of a proapoptotic protein seemed likely, consistent with a role for one or more caspases. Cells were protected by acetyl-Tyr-Val-Ala-Asp-chloromethylketone, a specific inhibitor of caspase-1. If cells were incubated with 100 μM acetyl-Tyr-Val-Ala-Asp-chloromethylketone for 2 h preceding CO exposure until the end of a 2-h incubation with buffer containing 110 nM CO, ethidium uptake was 1.03 ± 0.09 (n = 7) times that of control. In contrast, when cells were incubated under exactly the same circumstances but with an inhibitor of caspase-3, acetyl-Asp-Glu-Val-Asp-chloromethylketone, no protection was observed (fluorescence 1.54 ± 0.11; n = 5; times control; P < 0.05, ANOVA). Neither caspase inhibitor had an effect on viability of air-exposed, control cells (data not shown). Lysates from CO-exposed cells had significantly increased caspase-1 activity compared with control (Fig. 6). Moreover, if cells were incubated with the NO synthase inhibitor SIITU, exposure to CO failed to increase caspase-1 activity (Fig. 6). No evidence of caspase-3 activity was found in cells exposed to CO or just to air.
Figure 6.
Caspase-1 activity measured as fluorescence by using acetyl-Tyr-Val-Ala-Asp-amino-4-methyl coumarin, present in lysates prepared from cells incubated for 2 h in buffer containing air and 5% CO2 without or with 100 μM SIITU or the same buffer plus 110 nM CO without or with 100 μM SIITU. Values are means ± SEM; numbers in parentheses indicate the number of trials. *, P < 0.05 (ANOVA). RFU, relative fluorescence units.
Selectivity of Selenomethionine for Peroxynitrite Versus ⋅NO.
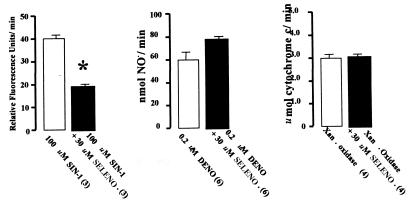
Interpretation of the protective effect of selenomethionine required an assessment of its propensity for scavenging reactive species. Therefore, we examined its reactivity with peroxynitrite, ⋅NO, O2⨪, and H2O2. As shown in Fig. 7, 30 μM selenomethionine inhibited the rate of rhodamine formation mediated by peroxynitrite that was generated by SIN-1. Selenomethionine did not react with ⋅NO, as measured by electrochemical detection of ⋅NO released from DENO, nor did selenomethionine inhibit O2⨪-dependent cytochrome c reduction by xanthine oxidase. Similarly, there was no peroxidase activity detected when 30 μM selenomethionine was incubated in the presence of up to 3.7 mM H2O2. Therefore, we conclude that 30 μM selenomethionine scavenged peroxynitrite but did not react with ⋅NO, O2⨪ or H2O2.
Figure 7.
Scavenging by 30 μM selenomethionine (SELENO) of peroxynitrite generated by SIN-1 and absence of scavenging of ⋅NO (generated by DENO) and O2⨪ [generated by xanthine oxidase (Xan Oxidase)]. See Experimental Procedures for experimental systems. Values are means ± SEM; values in parentheses indicate the number of trials. *, P < 0.05 (ANOVA).
Tolerance to CO by Preexposure to Low CO Concentrations.
Next, we examined whether cells could be rendered resistant to CO-mediated killing if they were first exposed to a nonlethal CO concentration. Exposure to buffer equilibrated with 11 nM CO for 40 min had no significant effect on ethidium uptake. The content in cells 18 h later was 0.31 ± 0.04 fluorescent units (n = 6; not significant versus control). Endothelial cells were preincubated for 40 min with buffer equilibrated with air/5% CO2 or air/CO2 plus 11 nM CO, and then cells were incubated for 3 h in complete growth medium equilibrated with air/5% CO2. After this period, both cell groups were incubated for 2 h with buffer containing 110 nM CO. Ethidium uptake assessed 18 h later in cells preincubated with 11 nM CO was only 9 ± 6% (n = 6) greater than control (no significant difference), whereas in the cells preincubated with just air/CO2, ethidium uptake was 34.8 ± 4% (n = 6) greater than control (P < 0.001). We conclude that exposure to a nonlethal concentration of CO conferred resistance to CO-mediated killing.
Antioxidant Levels in CO-Exposed Cells.
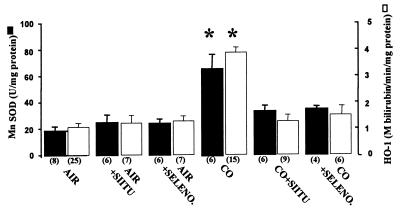
We hypothesized that low concentrations of CO may cause nonlethal oxidative stress and thus induce antioxidant defenses in BPAEC. The content of several enzymes in cells was measured after incubation for 40 min in buffer containing only air/CO2 (0 nM CO) or air/CO2 plus 11 or 110 nM CO followed by incubation in standard growth medium for 3 h to allow for new protein synthesis. The activities of glutathione peroxidase, glucose-6-phosphate dehydrogenase, and catalase were not increased (Table 1). However, exposure to CO caused significant increases MnSOD and HO-1 (Table 1). CuZn SOD activity may have been present at a low concentration but not detected, because an enzyme activity assay was used. Exposure to 110 nM CO did not alter the concentration of reduced thiols in cells, as has been shown to occur with some forms of oxidative stress. The concentration in cells immediately after exposure for 40 min was 46.1 ± 3.1 (n = 4) μmol/mg cell protein, a value insignificantly different from cells exposed to air-equilibrated buffer, 36.6 ± 2.3 (n = 4) μmol/mg cell protein. Consistent with this finding, incubation with 10 mM n-acetyl cysteine during or after CO exposure did not protect cells from death (data not shown).
Table 1.
Antioxidant enzyme levels in BPAEC
| Enzyme | Cells incubated with different concentrations of CO, nM
|
||
|---|---|---|---|
| 0 | 11 | 110 | |
| Glutathione peroxidase | 40.3 ± 5.0 | 38.8 ± 5.0 | 36.0 ± 5.2 |
| (M NADPH per min per mg protein) | (n = 4) | (n = 4) | (n = 3) |
| Glucose-6-phosphate deH2ase | 10.4 ± 1.8 | 7.9 ± 1.1 | 10.0 ± 4.0 |
| (M NADPH per min per mg protein) | (n = 6) | (n = 4) | (n = 4) |
| Catalase | 31.5 ± 2.1 | n.d. | 39.4 ± 7.0 |
| (mM H2O2 per min per mg protein) | (n = 4) | n.d. | (n = 4) |
| MnSOD | 18.0 ± 3.2 | 50.2 ± 3.3* | 65.9 ± 11.0* |
| (units/mg protein) | (n = 8) | (n = 6) | (n = 6) |
| HO-1 | 1.1 ± 0.1 | 1.6 ± 0.3 | 3.9 ± 0.2* |
| (M bilirubin per min per mg protein) | (n = 8) | (n = 8) | (n = 15) |
Values shown are means ± SEM. *, P < 0.05.
Western blotting identified an increase in content of the inducible HO-1 enzyme to an amount proportional to the increase in activity. Exposure to CO did not change the content of HO-2, the constitutive enzyme form (data not shown). The CO-mediated elevations in MnSOD and HO-1 were inhibited if cells were incubated with either the NO synthase inhibitor, 100 μM SIITU, or the peroxynitrite scavenger, 30 μM selenomethionine (Fig. 8). We conclude that induction of antioxidant enzymes in response to CO was mediated by ⋅NO-derived oxidants.
Figure 8.
Content of MnSOD and HO-1 in cells harvested 3 h after a 2-h incubation in buffer saturated with air plus 5% CO2 (control) or the same buffer with 110 nM CO. Where indicated, buffer also contained 100 μM SIITU or 30 μM selenomethionine (SELENO). Values are means ± SEM; numbers in parentheses indicate the number of trials. *, P < 0.05 (ANOVA).
Discussion
The results from this study show that concentrations of CO found in the environment cause endothelial cell oxidative stress responses and delayed death by an ⋅NO-dependent mechanism. Exposure to 11 nM CO caused BPAEC to increase synthesis MnSOD. To our knowledge, perturbations in cell biochemistry by CO have not been shown previously at concentrations this low. Elevations of MnSOD and HO-1 were associated with ⋅NO synthesis, because they were inhibited by the NOS inhibitor, SIITU. Several reports have shown that exposure to exogenous sources of ⋅NO or peroxynitrite or increasing the endogenous rate of ⋅NO production can induce synthesis of HO-1 (43–46). Our results indicate that endothelial cells increase MnSOD synthesis in response to ⋅NO-mediated stress. Synthesis of MnSOD by endothelial cells exposed to 11 nM CO may have been responsible for resistance to CO-mediated killing. Neurons increase MnSOD in response to an ⋅NO flux, and protection from killing was thought to be due to inhibiting formation of peroxynitrite (47).
In prior studies, we found that 110 nM CO did not inhibit oxygen consumption or enhance production of reduced oxygen species, but ⋅NO-derived oxidants were generated inside cells and also acted on extracellular targets (29). These findings, along with the current observations of no change in reduced thiols, indicate that CO exerts an adverse effect that is independent of its propensity to impair oxygen delivery in vivo or oxygen metabolism. Cell death resulted from exposures of 1 h or more to CO concentrations of 88 nM or greater. In prior investigations, we have reported membrane blebs in CO-exposed cells (29, 31), and in the current investigation, condensed chromatin was evident on electron micrographs. These morphological changes, as well as providing evidence of caspase-1 activation, lead to the conclusion that CO triggers apoptosis in BPAEC. Both ⋅NO and peroxynitrite have been shown to cause apoptosis (48–52). Protease activation was linked to delayed cell death by showing that a caspase-1 inhibitor prevented apoptosis. CO-exposed cells contained inclusion bodies with ubiquitin-decorated material, indicating that CO alters proteolytic processing. The electron micrographs of CO-exposed cells showed numerous inclusion bodies, and these structures may contain the proteolytic products observed in the sections stained with anti-ubiquitin antibodies. Inclusion bodies could arise because of abnormal protein aggregation after oxidative or nitrative modification or because of impaired or overwhelmed proteolytic pathways.
The results from this investigation add information to animal studies that have shown that exposure to concentrations of CO from 50 to 1,000 ppm can injure the vasculature. Exposure to CO causes ⋅NO-mediated oxidative stress to endothelium in the brain, aorta, lung, and skeletal muscle and release of glutathione from circulating erythrocytes (26–28, 53). These CO-associated effects can be inhibited when animals are treated with Nωnitro-l-arginine methyl ester to inhibit ⋅NO synthesis.
In terms of an environmental focus, MnSOD synthesis after exposure for 1 h to 10 ppm CO indicates that an oxidative stress response is triggered within the current National Institute for Occupational Safety and Health standard. From a physiological perspective, 11 nM CO is probably only slightly greater than the in vivo CO concentration of some organs, although this concentration will depend on local blood flow. For example, liver parenchyma has been estimated to generate approximately 0.45 nmol CO per g of liver per min (54). Additional investigations will be required to assess whether endothelial oxidative stress occurs in vivo in settings associated with excess endogenous CO production and whether the biochemical responses to environmental CO exposures have adaptive or pathological effects.
Acknowledgments
This work was supported by National Institutes of Health Grants ES-05211 (to S.R.T.) and HL-54926 (to H.I.).
Abbreviations
- BPAEC
bovine pulmonary artery endothelial cells
- DENO
diethylamine-NONOate
- SIN-1
3-morpholinosyndnonimine
- SOD
superoxide dismutase
- MnSOD
manganous SOD
- SIITU
s-isopropylisothiourea
- HO
heme oxygenase
References
- 1.Hexter A C, Goldsmith J R. Science. 1971;172:265–267. doi: 10.1126/science.172.3980.265. [DOI] [PubMed] [Google Scholar]
- 2.Stern F B, Halperin W E, Hornung R W, Ringenburg V L, McCammon C S. Am J Epidemiol. 1988;128:1276–1288. doi: 10.1093/oxfordjournals.aje.a115081. [DOI] [PubMed] [Google Scholar]
- 3.Kinney P L, Ozkaynak H. Environ Res. 1991;54:99–120. doi: 10.1016/s0013-9351(05)80094-5. [DOI] [PubMed] [Google Scholar]
- 4.Morris R D, Naumova E N, Munasinghe R L. Am J Public Health. 1995;85:1361–1365. doi: 10.2105/ajph.85.10.1361. [DOI] [PMC free article] [PubMed] [Google Scholar]
- 5.Schwartz J, Morris R D. Am J Epidemiol. 1995;142:23–35. doi: 10.1093/oxfordjournals.aje.a117541. [DOI] [PubMed] [Google Scholar]
- 6.Burnett R T, Dales R E, Brook J R, Raizenne M E, Krewski D. Epidemiology. 1997;8:162–167. doi: 10.1097/00001648-199703000-00007. [DOI] [PubMed] [Google Scholar]
- 7.Morris R D, Naumova E N. Environ Health Perspect. 1998;106:649–653. doi: 10.1289/ehp.98106649. [DOI] [PMC free article] [PubMed] [Google Scholar]
- 8.Yang W, Jennison B L, Omaye S T. J Toxicol Environ Health. 1998;55:185–196. doi: 10.1080/009841098158485. [DOI] [PubMed] [Google Scholar]
- 9.Baucom C D, Freeman J I, MacCormack J M. NC Mor Mortal Wkly Rep. 1987;36:543–545. [Google Scholar]
- 10.McCammon J B, McKenzie L E, Heinzman M. Appl Occup Environ Hyg. 1996;11:192–198. [Google Scholar]
- 11.Ely E W, Moorehead B, Haponik E F. Am J Med. 1995;98:145–155. doi: 10.1016/s0002-9343(99)80398-2. [DOI] [PubMed] [Google Scholar]
- 12.Gourdeau P, Parent M, Souilard A. Can J Public Health. 1995;86:414–417. [PubMed] [Google Scholar]
- 13.Materna B L, Koshland C P, Harrison R J. Appl Occup Environ Hyg. 1993;8:479–487. [Google Scholar]
- 14.Bellin P, Spengler J D. J Air Pollut Control Assoc. 1980;30:392–394. doi: 10.1080/00022470.1980.10464361. [DOI] [PubMed] [Google Scholar]
- 15.Jankovic J, Jones W, Burkhart J, Noonan G. Ann Occup Hyg. 1991;35:581–602. doi: 10.1093/annhyg/35.6.581. [DOI] [PubMed] [Google Scholar]
- 16.National Institute for Occupational Safety and Health. Health Hazard Evaluation Report. Springfield, VA: Natl. Inst. Occup. Saf. Health; 1994. , Publ. No. 90-0365-2415. [Google Scholar]
- 17.National Institute for Occupational Safety and Health. Preventing Carbon Monoxide Poisoning from Small Gasoline-Powered Engines and Tools. Springfield, VA: Natl. Inst. Occup. Saf. Health; 1996. , DHHS Publ. No. (NIOSH) 96-118. [Google Scholar]
- 18.Koehler R C, Jones M D, Traystman R J. Am J Physiol. 1982;243:H27–H32. doi: 10.1152/ajpheart.1982.243.1.H27. [DOI] [PubMed] [Google Scholar]
- 19.MacMillan V. Can J Physiol Pharmacol. 1975;53:644–650. doi: 10.1139/y75-089. [DOI] [PubMed] [Google Scholar]
- 20.Mayevsky A, Meilin S, Rogatsky G G, Zarchin N, Thom S R. J Appl Physiol. 1995;78:1188–1196. doi: 10.1152/jappl.1995.78.3.1188. [DOI] [PubMed] [Google Scholar]
- 21.Meilin S, Rogatsky G G, Thom S R, Zarchin N, Guggenheimer-Furman E, Mayevsky A. J Appl Physiol. 1996;81:1078–1083. doi: 10.1152/jappl.1996.81.3.1078. [DOI] [PubMed] [Google Scholar]
- 22.Bianco F, Floris R. J Neuroradiol. 1988;15:381–385. [PubMed] [Google Scholar]
- 23.DeReuck J, Decoo D, Lemahieu I, Strijckmans K, Boon P, Van Maele G, Buylaert W, Leys D, Petit H. J Neurol. 1993;240:430–434. doi: 10.1007/BF00867357. [DOI] [PubMed] [Google Scholar]
- 24.Maeda Y, Kawasaki Y, Jibiki I, Yamaguchi N, Matsuda H, Hisada K. Eur Neurol. 1991;31:380–383. doi: 10.1159/000116698. [DOI] [PubMed] [Google Scholar]
- 25.Silverman C S, Brenner J, Murtagh F R. Am J Neuroradiol. 1993;14:168–170. [PMC free article] [PubMed] [Google Scholar]
- 26.Ischiropoulos H, Beers M F, Ohnishi S T, Fisher D, Garner S E, Thom S R. J Clin Invest. 1996;97:2260–2267. doi: 10.1172/JCI118667. [DOI] [PMC free article] [PubMed] [Google Scholar]
- 27.Thom S R, Ohnishi S T, Fisher D, Xu Y A, Ischiropoulos H. Toxicol Appl Pharmacol. 1999;154:12–19. doi: 10.1006/taap.1998.8553. [DOI] [PubMed] [Google Scholar]
- 28.Thom S R, Fisher D, Xu Y A, Garner S, Ischiropoulos H. Am J Physiol. 1999;276:H984–H992. doi: 10.1152/ajpheart.1999.276.3.H984. [DOI] [PubMed] [Google Scholar]
- 29.Thom S R, Xu Y A, Ischiropoulos H. Chem Res Toxicol. 1997;10:1023–1031. doi: 10.1021/tx970041h. [DOI] [PubMed] [Google Scholar]
- 30.Thom S R, Ohnishi S T, Ischiropoulos H. Toxicol Appl Pharmacol. 1994;128:105–110. doi: 10.1006/taap.1994.1186. [DOI] [PubMed] [Google Scholar]
- 31.Thom S R, Ischiropoulos H. Health Effect Institute Research Report 80. Cambridge, MA: Health Effects Inst.; 1997. [PubMed] [Google Scholar]
- 32.Fraser A, Evan G. Cell. 1996;85:781–784. doi: 10.1016/s0092-8674(00)81005-3. [DOI] [PubMed] [Google Scholar]
- 33.Hale A T, Smith C A, Sutherland L C, Stoneman V E P, Longthorne V L, Culhane A C, Williams G T. Eur J Biochem. 1996;236:1–25. doi: 10.1111/j.1432-1033.1996.00001.x. [DOI] [PubMed] [Google Scholar]
- 34.Nagata S. Cell. 1997;88:355–365. doi: 10.1016/s0092-8674(00)81874-7. [DOI] [PubMed] [Google Scholar]
- 35.Dimmeler S, Haendeler J, Galle J, Zeiher A M. Circulation. 1997;95:1760–1763. doi: 10.1161/01.cir.95.7.1760. [DOI] [PubMed] [Google Scholar]
- 36.Pronk G J, Ramer K, Amiri P, Williams L T. Science. 1996;271:808–810. doi: 10.1126/science.271.5250.808. [DOI] [PubMed] [Google Scholar]
- 37.Woodle E S, Smith D M, Bluestone T A, Kirkman W M, Green D F, Skowronski E W. J Immunol. 1997;158:2156–2164. [PubMed] [Google Scholar]
- 38.Harada-Shiba M, Kinoshita M, Kamido H, Shimokado K. J Biol Chem. 1998;273:9681–9687. doi: 10.1074/jbc.273.16.9681. [DOI] [PubMed] [Google Scholar]
- 39.Spitz D R, Oberley L W. Anal Biochem. 1989;179:8–18. doi: 10.1016/0003-2697(89)90192-9. [DOI] [PubMed] [Google Scholar]
- 40.Monaco M D, Pizzini A, Gatto V, Leonardi L, Gallo M, Brignardello E, Boccuzzi G. Br J Cancer. 1997;75:589–592. doi: 10.1038/bjc.1997.102. [DOI] [PMC free article] [PubMed] [Google Scholar]
- 41.Southan G J, Szabo C, Thiemermann C. Br J Pharmacol. 1995;114:510–516. doi: 10.1111/j.1476-5381.1995.tb13256.x. [DOI] [PMC free article] [PubMed] [Google Scholar]
- 42.Briviba K, Roussyn I, Sharov V S, Sies H. Biochem J. 1996;319:13–15. doi: 10.1042/bj3190013. [DOI] [PMC free article] [PubMed] [Google Scholar]
- 43.Durante W, Kroll M H, Peyton K J, Schafer A I. Circ Res. 1997;80:557–564. doi: 10.1161/01.res.80.4.557. [DOI] [PubMed] [Google Scholar]
- 44.Morita T, Perrella M A, Lee M E, Kourembanas S. Proc Natl Acad Sci USA. 1995;92:1475–1479. doi: 10.1073/pnas.92.5.1475. [DOI] [PMC free article] [PubMed] [Google Scholar]
- 45.Motterlini R, Foresti R, Intaglietta M, Winslow R M. Am J Physiol. 1996;270:H107–H114. doi: 10.1152/ajpheart.1996.270.1.H107. [DOI] [PubMed] [Google Scholar]
- 46.Yee E L, Pitt B R, Billiar T R, Kim Y M. Am J Physiol. 1996;271:L512–L518. doi: 10.1152/ajplung.1996.271.4.L512. [DOI] [PubMed] [Google Scholar]
- 47.Gonzalez-Zulueta M, Ensz L M, Mukhina G, Lebovitz R M, Zwacka R M, Engelhardt J F, Oberley L W, Dawson V L, Dawson T M. J Neurosci. 1998;18:2040–2055. doi: 10.1523/JNEUROSCI.18-06-02040.1998. [DOI] [PMC free article] [PubMed] [Google Scholar]
- 48.Blaylock M G, Cuthbertson B H, Galley H F, Ferguson N R, Webster N R. Free Radical Biol Med. 1998;25:748–752. doi: 10.1016/s0891-5849(98)00108-7. [DOI] [PubMed] [Google Scholar]
- 49.Gow A J, Thom S R, Ischiropoulos H. Am J Physiol. 1998;274:L112–L118. doi: 10.1152/ajplung.1998.274.1.L112. [DOI] [PubMed] [Google Scholar]
- 50.Muhl H, Sandau K, Brune B, Briner V A, Pfeilschifter J. Eur J Pharmacol. 1996;317:137–149. doi: 10.1016/s0014-2999(96)00701-7. [DOI] [PubMed] [Google Scholar]
- 51.Messmer U K, Reed U K, Brune B. J Biol Chem. 1996;271:20192–20197. doi: 10.1074/jbc.271.33.20192. [DOI] [PubMed] [Google Scholar]
- 52.Okuda, Y., Sakoda, S., Shimaoka, M. & Yanagihara, T. (1996) 52, 135–138. [DOI] [PubMed]
- 53.Thom S R, Kang M, Fisher D, Ischiropoulos H. J Appl Physiol. 1997;82:1424–1432. doi: 10.1152/jappl.1997.82.5.1424. [DOI] [PubMed] [Google Scholar]
- 54.Goda N, Suzuki K, Naito M, Takeoka S, Tsuchida E, Ishimura Y, Tamatani T, Suematsu M. J Clin Invest. 1998;101:604–612. doi: 10.1172/JCI1324. [DOI] [PMC free article] [PubMed] [Google Scholar]


