Abstract
The interaction between DNA and a benzothiazole-quinoline cyanine dye with a trimethine bridge (TO-PRO-3) results in the formation of three noncovalent complexes. Unbound TO-PRO-3 has an absorption maximum (λmax) of 632 nm, while the bound dyes (with calf thymus DNA) have electronic transitions with λmax = 514 nm (complex I), 584 nm (complex II) and 642 nm (complex III). The blue shifts in the electronic transitions and the bisignate shape of the circular dichroism bands indicate that TO-PRO-3 aggregates with DNA. Complex I has a high dye:base pair stoichiometry, which does not depend on base sequence or base modifications. The bound dyes exhibit strong interdye coupling, based on studies with a short oligonucleotide and on enhanced resonance scattering. From thermal dissociation studies, the complex is weakly associated with DNA. Studies with poly(dGdC)2 and poly(dIdC)2 and competitive binding with distamycin demonstrate that complex II is bound in the minor groove. This complex stabilizes the helix against dissociation. For complex III, the slightly red-shifted electronic transition and the stoichiometry are most consistent with intercalation. Using poly(dAdT)2, the complexes have the following dye mole fractions (Xdye): Xdye = 0.65 (complex I), 0.425 (complex II) and 0.34 (complex III).
INTRODUCTION
Studies of the aggregation of small molecules with DNA have at least two motivations. First, improved base sequence recognition is accomplished by molecules that bind in the minor groove (1,2). Especially in the narrow, deep minor groove of AT-rich sequences, a large number of molecules are known to bind as monomers (3). A common feature of these ligands is their crescent shape, which complements the groove curvature. Entropic factors associated with water and ion binding with DNA are also significant in the formation of the monomeric complexes (4–7). Stacked dimers of polyamide and furamidine derivatives form in the wider minor groove of mixed sequence or GC-rich sequences, and this cooperative association expands base sequence recognition (1,5). For these complexes, entropic factors such as water and ion exchange are still important, but enthalpic factors (hydrogen and van der Waals bonds) drive complex formation (5,7).
Besides these short-range interactions, long-range cooperativity is also interesting. For example, the supramolecular assemblies of helical chromophore aggregates serve as models for light harvesting systems (8). DNA is an interesting template for small molecule aggregation because its length can be readily manipulated and it has regularly repeating binding sites. One such assembly involves porphyrins and DNA (9). Depending on the chromophore structure and the ionic strength of the solution, porphyrins exhibit multiple types of DNA binding, such as intercalation, outside binding and outside binding with stacking (10,11). For the stacked arrangement, strong electronic coupling is evident from the spectral shifts in the visible absorption bands, from the large circular dichroism (CD), and the enhancement of the resonance scattering (9,12). Aggregates of 104–105 porphyrins form more readily in higher ionic strength buffers (≥0.1 M NaCl), indicating that these electrolyte ions are critical in the complex structure (13,14).
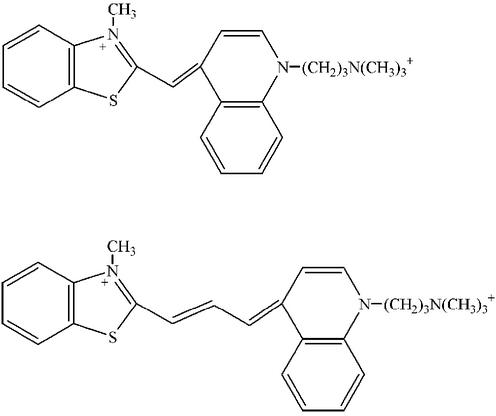
In this paper, we discuss the cooperative association of cyanine dyes with DNA. The structures of these chromophores are characterized by two heteroaromatic rings that are linked by an odd number of methine carbons (Fig. 1). The resulting hydrophobic character favors oligomer formation in aqueous solution, and aggregates with specific structures [J and H aggregates (15)] form at high dye concentrations (mM) and with polymer templates, on surfaces, and in monolayers (16–18). Depending on their structure, the cyanine dyes exhibit a variety of DNA binding motifs, including aggregation. For dyes with a single methine bridge, intercalation between the base pairs is the predominant binding motif at low dye:base pair concentrations (19–22). Cooperative binding is favored at relatively higher dye concentrations, based on exciton bands in the CD spectra and on shifts in the electronic transitions in the visible absorption spectra (20,23–25). Groove binding becomes more prevalent for the cyanine dyes with more than one methine bridge. For example, as demonstrated by linear and CD spectroscopies, cyanine dyes with trimethine bridges bind in the DNA minor groove as monomers and dimers (26). Thorough studies on cyanine dyes with pentamethine bridges show these dyes bind exclusively as dimers in the DNA minor groove (18). A significant characteristic of these complexes is the blue shift of the electronic transition, which occurs because of the close association of the DNA-bound dyes. Cooperative interactions are also evident from the exciton splitting in the CD spectra. The dimensions of the minor groove favor dimerization, as demonstrated through stoichiometry and molecular modeling studies. In addition, the ionic strength and the temperature of the buffer determine whether J or H aggregates are favored (27), and the herterocycle structure influences the propensity to aggregate (28). Finally, the tendency of cyanine dyes with longer methine bridges to dimerize in the DNA minor groove does not correlate with the hydrophobicity of the dye (28). Thus, the structure of the DNA template limits which molecules can dimerize in the minor groove. More complicated modes of interaction can result for these dyes (29).
Figure 1.
The structures of the cyanine dyes TO-PRO-1 (top) and TO-PRO-3 (bottom).
We describe work on the DNA interaction of a cyanine dye composed of a quinoline and benzothiazole connected by three methine carbons (TO-PRO-3 in Fig. 1). Previous spectroscopic studies at low temperature (4.2 K) suggest that TO-PRO-3 is externally bound and intercalated with DNA (30). In this work close to room temperature, we find three TO-PRO-3/DNA complexes with distinct stoichiometries in an aqueous buffer. Cooperative interactions are a significant feature for two of these complexes based on the blue shifts in the electronic transitions and exciton bands in the CD spectra. The strength of the interaction between the bound dyes is investigated with resonance scattering and through DNA length dependence studies. The DNA binding sites for these noncovalent complexes are investigated using variations in the DNA bases and competing ligands. Dissociation of the bound dyes at elevated temperatures shows that the coupling of the dyes with themselves and with DNA depends on the complex stoichiometry.
MATERIALS AND METHODS
Solutions of the cyanine dyes (Molecular Probes) in DMSO were used as received. They were stored at –20°C and protected from room lights during use. The concentrations of these stock solutions were spectrophotometrically determined using molar absorptivities of 141 600 M–1 cm–1 (at 635 nm in methanol) for TO-PRO-3 and 68 500 M–1 cm–1 (at 506 nm in aqueous buffer) for TO-PRO-1. The sterilized aqueous buffer contained tris(hydroxymethyl)aminomethane (Tris) with a concentration of 2 mM Tris/8 mM Tris-H+ (pH 7.5) and 10% methanol (based on volume), which reduced dye aggregation and adsorption to the walls of the cuvette (fused silica, 1.0 cm pathlength) (18). Higher concentrations of methanol (20%) do not change the results of the experiments. To further reduce dye adsorption, the cuvette walls were silane derivatized using SigmaCote (Sigma). The following types of DNA (with their molar absorptivities, ε, in aqueous solution) were used in the experiments: calf thymus (Type I, Sigma), ε = 12 824 M–1 cm–1 (260 nm); poly(dAdT)2 (Amersham), ε = 13 200 M–1 cm–1 (262 nm); poly(dGdC)2 (Amersham), ε = 16 800 M–1 cm–1 (254 nm); poly(dIdC)2 (Amersham), ε =13 800 M–1 cm–1 (251 nm); Bacteriophage T4, ε = 12 920 M–1 cm–1 (260 nm). The molar absorptivities are expressed in terms of the concentration of base pairs. T4 DNA was prepared from plaques after T4 transfection of Escherichia coli K12, which were grown on LB agar plates (31). The DNA was extracted using the Qiagen Lambda Maxi Kit, followed by ethanol precipitation and resuspension in 10 mM Tris/Tris-H+ buffer. The A260/A280 ratio for the resulting DNA was 1.8. To investigate the length dependence of the binding, the two complementary 12 base pair oligonucleotides (5′-GGGCGGCGACCT-3′) and (5′-AGGTCGCCGCCC-3′) were annealed by heating to 90°C for 15 min and then slowly cooling (>8 h) to room temperature. These oligonucleotides were chosen to favor duplex formation relative to hairpin or self-complementary structures. The transition temperature for strand dissociation occurred at the expected 62°C in a 50 mM NaCl buffer (32).
Visible absorption spectra were acquired using a Hewlett-Packard 8452A diode array spectrometer. For DNA titrations, the spectra were corrected for small (<10%) dilution due to the addition of the concentrated DNA solution. CD spectra were obtained from a Jasco J-710 spectropolarimeter at a scan rate of 200 nm/min and an integration time of 1 s. Resonance scattering experiments were conducted on a SPEX Fluorolog 2 fluorimeter with synchronous scanning of the excitation and emission monochromators and with three spectra averaged. For all measurements, the temperature of the cell holder was controlled by a recirculating refrigerated bath. To reduce water condensation, the cell chambers were purged with dry nitrogen. Melting studies were conducted in 1 or 2°C steps, and spectra were collected after no change in the absorbance. For the continuous variation analysis, TO-PRO-3 was removed from the solution and replaced with an equivalent amount of base pairs to maintain a total concentration of the two components of 10 µM (33). The absorbances were plotted as a function of the mole fraction of dye to determine the complex stoichiometry (34).
RESULTS AND DISCUSSION
Spectroscopic studies with calf thymus DNA
To provide insight into the structural basis of the interaction of TO-PRO-3 with DNA, we first discuss the benzothiazole-quinoline analog with a single methine bridge (TO-PRO-1 in Fig. 1). For low dye:base pair concentrations, the prominent DNA binding mode of TO-PRO-1 is intercalation as demonstrated by the helix lengthening of 1 base pair spacing/bound dye of closely related derivatives (22). In addition, the small red shift (+8 nm) of the electronic transition is expected for insertion of the dye into the nonpolar intercalation site (19,21). At higher dye concentrations (≥1 dye:2 base pairs), aggregation in the DNA binding sites occurs. CD studies of TO-PRO-1 and the analogous benzooxzole dye show exciton bands that are characteristic of interdye interactions (20,21). However, splitting of the excited electronic state energy levels that is expected for an aggregated complex is not observed in the visible absorption spectrum. We examined DNA solutions with high concentrations of TO-PRO-1 (up to 15 µM) at a low temperature (7°C), but only the intercalated complex with the red-shifted band at 514 nm is present.
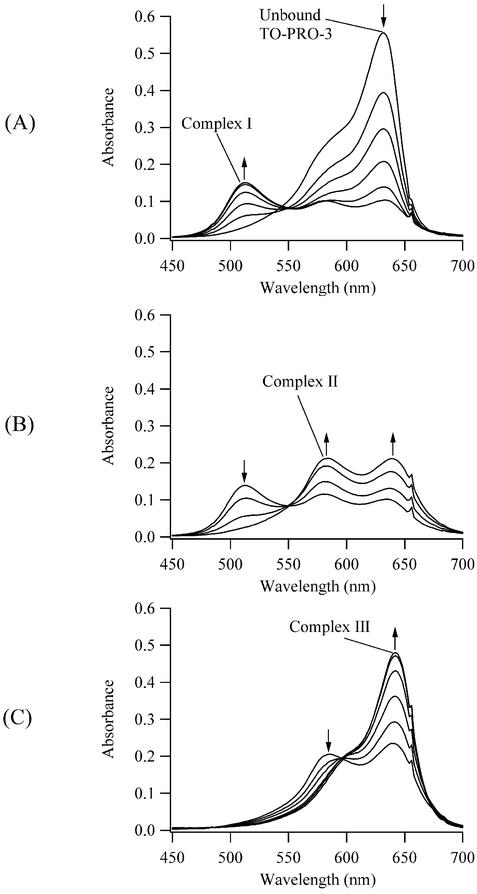
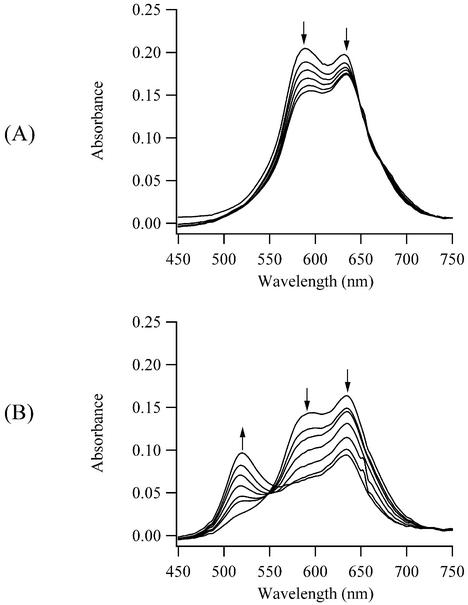
However, significant changes occur in the electronic spectra of the DNA complex with the quinoline-benzothiazole cyanine dye with a trimethine bridge TO-PRO-3 (Fig. 1). Three new electronic bands develop and disappear upon addition of DNA, indicative of three distinct TO-PRO-3/DNA binding modes that we label complex I, complex II and complex III (Fig. 2). Relative to the unbound dye with an absorption maximum (λmax) of 632 nm, two blue-shifted bands with λmax = 514 nm (complex I) and 584 nm (complex II) and a red-shifted band with λmax = 642 nm (complex III) are observed during the DNA titration. Isosbestic points at 551 and 596 nm are consistent with equilibria between these distinct complexes of TO-PRO-3 with DNA. The 642 nm transition is assigned to the intercalated complex based on its small red shift relative to the unbound dye (+10 nm) and on its prominence at low (<1:2) dye:base pair concentrations (Fig. 2C). This behavior is characteristic of many intercalating dyes, such as ethidium and TO-PRO-1 (21,35). The main focus of these studies is to investigate the complexes associated with the blue-shifted transitions. For closely associated chromophores, splitting of the excited state electronic energy levels can occur due to dipole interaction (36). The shift in the wavelength of the electronic transition and the transition probability depend on the number of interacting chromophores, their intermolecular distance and their relative orientation (16,37). For example, a end-to-end interaction results in a red-shifted transition (J aggregate) (17). For a parallel stacking arrangement (H aggregate), a blue-shifted transition is favored, as observed for complex I and complex II. The λmax of complex I has a large blue shift relative to the unbound dye, and changes of this magnitude have only been observed in a few cases (38,39). The maximum absorbances of both blue-shifted peaks is less than either the absorbance of the unbound dye or of complex III, consistent with the hypochromism expected for a face-to-face arrangement of the chromophores (36). Complex I has a higher dye:base pair stoichiometry than complex II, and a more quantitative analysis of the stoichiometries is provided in a later section. Finally, the absorbances of these peaks decrease with increasing temperature, so the studies were conducted at the lowest feasible temperature of 6–7°C. The absorbances of the blue-shifted peaks are stable to thermal cycling from 6 to 50°C back to 6°C.
Figure 2.
Visible absorption spectra during the titration of a 5.1 µM solution of TO-PRO-3 with calf thymus DNA at 7°C. Three new complexes with λmax = 514 nm (complex I), 584 nm (complex II) and 642 nm (complex III) form. The base pair concentrations are 0, 0.7, 1.5, 2.2, 2.9 and 3.6 µM in (A), 4.3, 5.7, 7.1 and 8.5 µM in (B), and 9.8, 13.6, 19.5, 29.9, 38.7 and 46.4 µM in (C). The arrows indicate how the absorption bands respond to the increases in the DNA concentration.
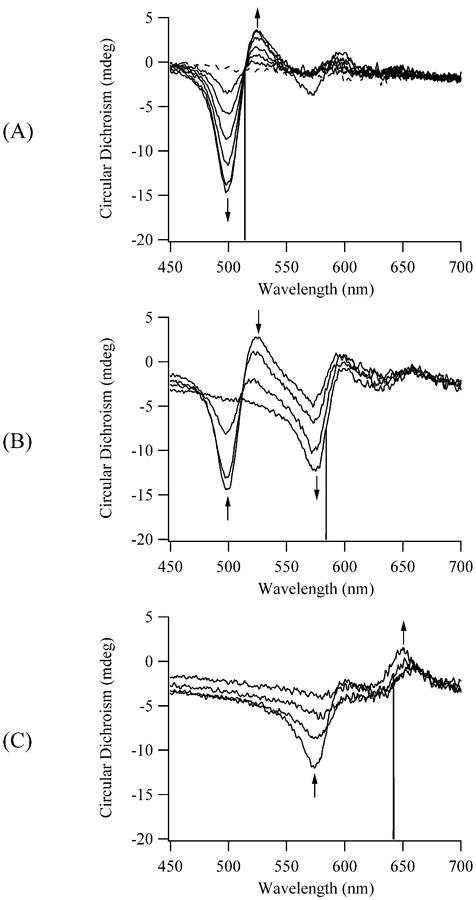
For the 514, 584 and 642 nm bands in the visible absorption spectra, corresponding transitions are also observed in the CD spectra (Fig. 3). The induced CD confirms these bands correspond to DNA associated complexes, and the biphasic shape of the peaks is most likely due to exciton coupling of stacked TO-PRO-3 molecules. The negative CD band at lower wavelength and the positive CD band at higher wavelength are characteristic of chromophores that have a right-handed orientation, as expected for dyes bound to B-form DNA (20). Presuming exciton coupling is the dominant interaction, the integrated positive and negative CD absorptions should cancel (36), but this is precluded by the close spectral proximity of the transitions. CD associated with the DNA bands show no significant changes during titrations at higher concentrations, which suggests the TO-PRO-3 complexes do not significantly alter the DNA structure. In other words, the DNA acts as a template for TO-PRO-3 aggregation, as observed for other cyanine dyes (18).
Figure 3.
Circular dichroism spectra during the titration of a 5.1 µM solution of TO-PRO-3 with calf thymus DNA at 7°C. The base pair concentrations are 0 (dashed line), 0.5, 1.0, 1.5, 2.0, 2.5 and 3.4 µM in (A), 3.9, 4.8, 6.0 and 7.1 µM in (B), and 8.3, 11.5, 16.7 and 25.8 µM in (C). The vertical lines at 514 nm (A), 584 nm (B) and 642 nm (C) correspond to the absorption maxima in Figure 2. The arrows indicate how the CD for these electronic transitions responds to the increases in the DNA concentration.
To investigate the extent of coupling between the chromophores, resonance-enhanced scattering was used. This method relies on the significant enhancement of the scattering cross section for large arrays of chromophores that are electronically coupled and has been used to characterize and monitor porphoryin assembly on DNA (12). In this work, resonance light scattering distinguishes the two complexes associated with the blue-shifted absorptions (Supplementary Material Fig. S1). For the 514 nm peak in the visible absorption spectrum (Fig. 2A), a corresponding transition is also observed in the resonance scattering spectrum, suggesting the TO-PRO-3 molecules in complex I exhibit strong cooperative interactions. With a further increase in the base pair concentration, the intensity of this peak decreases. For these higher base pair concentrations at which the 584 nm peak is present in both the visible absorption and CD spectra, enhanced resonance scattering is not observed. This result suggests the cooperative interactions for the chromophores in complex II have a shorter range than in complex I. While it is possible to obtain approximate estimates of the extent of aggregation through more extensive measurements (14), we use studies with a short oligonucleotide to address this issue.
DNA structural variations
Using the structural variations in natural and synthetic forms of DNA, we investigated the mode of binding for the TO-PRO-3/DNA complexes. The discussion focuses on complex I and complex II associated with the blue-shifted peaks. The other prominent absorption at 642 nm peak is most probably associated with an intercalated complex, as discussed earlier in the calf thymus studies. The DNA from bacteriophage T4 was used to examine the role of major groove binding (Fig. S2) (40–42). While it sterically hinders association in the major groove, the uncharged glucose linked to the 5-hydroxymethylcytosine does not significantly alter the DNA structure. No significant differences are observed between the titrations with calf thymus and T4 DNA. The λmax for the transitions is the same in both forms of DNA, and the maximum absorbances are comparable to those observed for calf thymus DNA. In addition, isosbestic points occur as with calf thymus DNA, suggesting no new complexes form with T4 DNA. It is feasible that major groove binding in AT-rich regions of T4 could be occurring, as the AT content of calf thymus and T4 DNA are similar [34–35% (43) and 42% (44), respectively]. However, we are unaware of previous studies that would suggest such a base selective interaction.
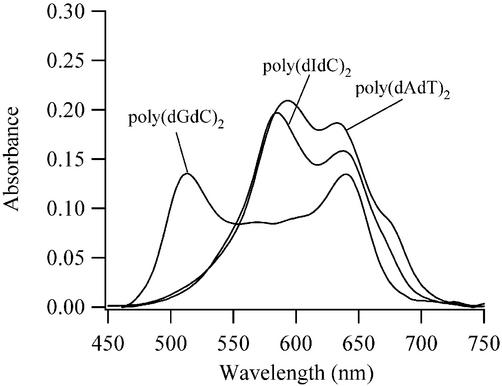
Duplex polynucleotides that possess homogeneous binding sites for TO-PRO-3 provide further information regarding the mode of binding. The following blue-shifted transitions are present for three polynucleotides: poly(dGdC)2, one peak with λmax = 512 nm (Fig. S3); poly(dIdC)2, two peaks with λmax = 514 and 584 nm (Fig. S4); poly(dAdT)2, two peaks with λmax = 514 and 590 nm (Fig. S5). The most blue-shifted transition shows little variation in the λmax, suggesting that the three forms of DNA have a common binding site for TO-PRO-3 in complex I. The small variation in the λmax of 590 nm for poly(dAdT)2 and 584 nm for poly(dIdC)2 suggests these spectral features are associated with the same mode of binding. Consistent with the behavior of other small molecule ligands, the absence of this peak for poly(dGdC)2 is most likely related to the amino group of guanine that projects into the minor groove of this polynucleotide (18,45). Thus, because the minor groove is not blocked for poly(dIdC)2 and poly(dAdT)2, these results indicate that complex II is associated with minor groove binding (Fig. 4). Furthermore, TO-PRO-3 aggregation is occurring in this binding site. First, the electronic transitions for complex II are blue-shifted relative to the unbound dye (Figs S4 and S5). In addition, the CD bands at 590 nm for poly(dAdT)2 and at 584 nm for poly(dIdC)2 have the same bisignate shape observed for calf thymus DNA (Fig. 3B). An estimate of the extent of aggregation is provided in the subsequent Stoichiometry section. Also to be discussed further is the transition at 674 nm for poly(dAdT)2 and possibly for poly(dIdC)2 (Figs S4 and S5).
Figure 4.
Comparison of the absorption bands of 5 µM solutions of poly(dIdC)2, poly(dAdT)2 and poly(dGdC)2 with the TO-PRO-3:base pair concentration of 1.0 at 7°C.
Besides structural variations in the nucleotide bases, the effect of the length of the DNA was investigated. For longer DNA strands, the enhancement of the resonance scattering suggests that an array of cooperatively bound TO-PRO-3 chromophores is responsible for the 514 nm transition (Fig. S1). Thus, the stability of complex I should depend on the DNA length, which was investigated using a 12 base pair oligonucleotide (Fig. S6). A significant difference from the longer DNA is the absence of the 514 nm band, which indicates that the cooperative interactions extend over a range >12 base pairs. Complex II is still observed but with a lower maximum absorbance and a shifted absorption maximum (578 nm) when compared to calf thymus DNA. We attribute these effects to the high GC content of this oligonucleotide.
Competing ligands
By using distamycin, which has a high affinity for the minor groove for poly(dAdT)2, we show a further distinction between complex I and complex II (Fig. 5). Distamycin was added to a poly(dAdT)2 solution with a 0.9 TO-PRO-3:base pair stoichiometry, for which the binding sites of complex II are saturated with TO-PRO-3. The resulting decrease in the concentration of the TO-PRO-3/DNA complex with increasing amounts of distamycin suggests complex II is associated with minor groove binding. However, a corresponding increase in the concentration of the unbound dye is not observed, as the absorbance of the 632 nm peak also decreases. One explanation is that TO-PRO-3 is not dissociated from the DNA but adopts a new binding site. Given the propensity of distamycin to form dimers in the minor groove of AT-rich DNA (1), mixed dimers of TO-PRO-3 and distamycin could form. In addition, the absorbance of the 514 nm peak increases at higher distamycin concentrations, which suggests that complex I forms when TO-PRO-3 is completely displaced from the minor groove (complex II) by distamycin. With a further increase in the concentration of distamycin, a red shift of the 514 nm peak occurs. For these conditions, we propose that complex I contains both distamycin and TO-PRO-3. Due to the long-range interaction of the dipoles, it is expected that the extent of splitting of the exciton states of TO-PRO-3 would decrease in such mixed aggregates, thereby explaining the observed shift to longer wavelengths.
Figure 5.
Titration of 4.9 µM TO-PRO-3 and 5.7 µM base pair poly(dAdT)2 with minor groove binder distamycin at 7°C. The concentrations of distamycin are 0, 0.08, 0.16, 0.24, 0.32 and 0.40 µM in (A) and 0.5, 0.6, 0.8, 1.0, 1.2, 1.5 and 1.7 µM in (B). The arrows indicate how the absorption bands respond to the increases in the DNA concentration.
Thermal stability
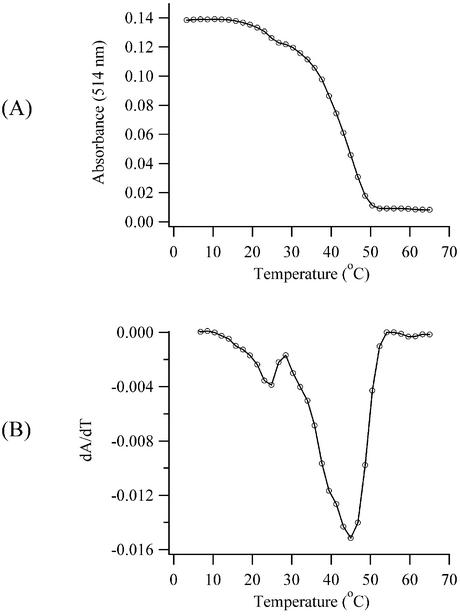
The resonance scattering spectra and the studies with the short oligonucleotide suggest that cooperative interactions are significant for complex I. To further examine inter- and intramolecular interactions in this complex, the temperature dependence of the dissociation of the bound dye from calf thymus DNA was measured (Fig. 6). With increasing temperatures, an isosbestic point at 552 nm is observed as the absorbances of the 514 and 632 nm peaks decreased and increased, respectively. Thus, the increase in the temperature shifts the equilibrium between the bound and unbound forms of the dye. From the derivative plot (Fig. 6B), the dissociation temperature is 45°C. The transition is not a simple two-state process as reflected by the non-Gaussian shape of the derivative plot, and such behavior has been observed for other cyanine dye/DNA complexes (27). The complexes have a weak interaction with the DNA helix, as they dissociate well before the calf thymus DNA melting transition of 70°C in the same buffer. Weak affinity has also been demonstrated for another high-density cyanine dye complex with DNA when the force gradient in a flowing solution caused dissociation (24). Besides the major transition at 45°C, an additional inflection at 25°C is observed. We determined that the magnitude of this deflection is larger when a sonicated DNA sample (average length ∼300 bp) is used, suggesting that a population of shorter fragments in the DNA samples is responsible. Further studies demonstrated that the transition temperature for complex formation is lower than for complex dissociation. Such hysteresis is expected when nucleation of a critical aggregate size is necessary for complex formation (46).
Figure 6.
Thermal dissociation of complex I for a solution of 4.9 µM TO-PRO-3 and 2.6 µM calf thymus DNA. The absorbances (A) and the derivatives of the absorbance (B) at 514 nm are plotted as open circles.
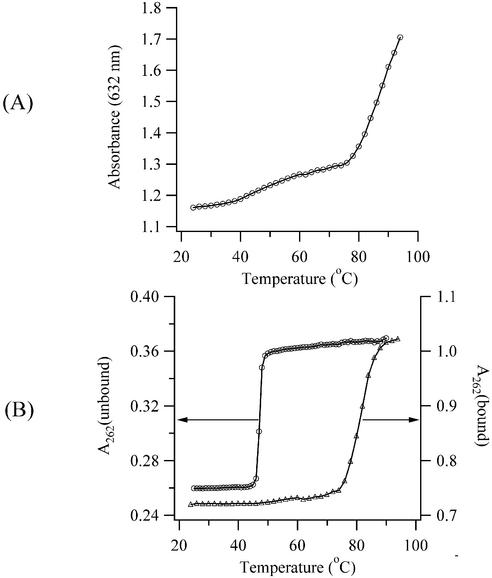
The thermal stability of complex II was examined using poly(dAdT)2 because this polynucleotide has a homogeneous array of favorable minor groove binding sites. Using a stoichiometry that favors formation of this complex (0.9 TO-PRO-3:base pair), Figure 7A shows how the concentration of the unbound dye changes with temperature. These results indicate that limited dissociation of complex II occurs at lower temperatures, while a more significant destabilization occurs at higher temperatures. The continued increase in the absorbance of the unbound dye at higher temperatures is attributed to the dissociation of aggregates that are not bound to DNA (23). Spectral changes for the bound dye are obscured by the nearby electronic transition of the unbound dye, which has a larger molar absorptivity. The relationship between the stability of complex II and the integrity of the double helix is illustrated in Figure 7B. In the absence of TO-PRO-3, the transition temperature for strand dissociation in poly(dAdT)2 is 48°C in the methanol/Tris buffer. With TO-PRO-3, the transition occurs at the significantly higher temperature of 86°C. The similarity between the transition temperatures for the dissociation of the complex and of the helix indicates that complex II significantly stabilizes duplex DNA against dissociation. Minor groove binders contribute to helix through hydrogen bond contacts with the bases (2,7). While hydrogen bonding is not pertinent for TO-PRO-3, electrostatic forces may be significant, given the low ionic strength of the buffer and the +2 charge of the dye. In addition, hydrophobic factors may contribute entropically to the helix stability, given the propensity of the cyanine dyes to aggregate in aqueous solution (16).
Figure 7.
(A) Thermal dissociation of complex II for a solution of 20 µM TO-PRO-3 and 22 µM poly(dAdT)2. The absorbance at 632 nm is plotted as open circles. (B) Thermal dissociation of poly(dAdT)2 for solutions with 22 µM poly(dAdT)2 (left axis and open circles) and 22 µM poly(dAdT)2/ 20 µM TO-PRO-3 (right axis and open triangles). The absorbance was measured at 262 nm.
Stoichiometry
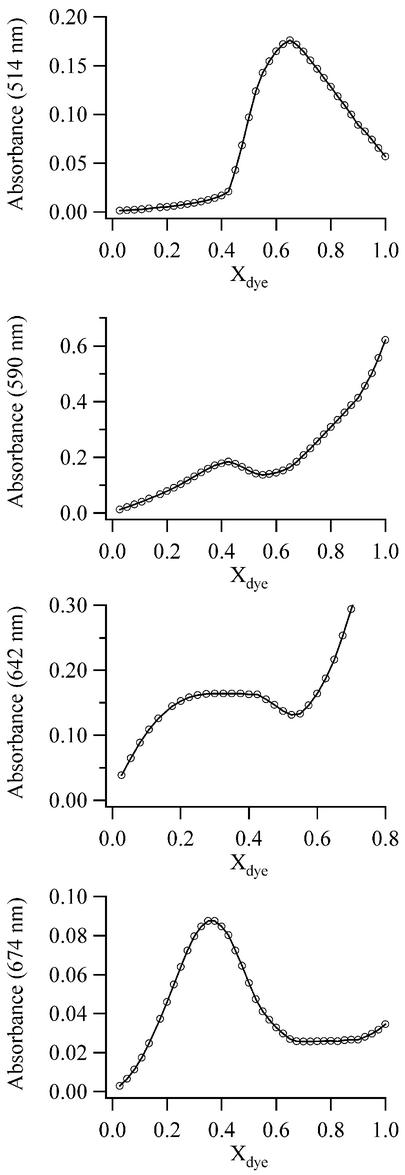
The spectral changes that accompany the addition of DNA to TO-PRO-3 solutions demonstrate the formation of three distinct complexes. While such titration experiments provide qualitative information on the stoichiometries of the complexes, a more rigorous analysis is achieved through the continuous variation analysis (34). This model-independent approach has been utilized to elucidate the multiple stoichiometries of DNA complexes (47,48). In this method, the total amount of dye and base pairs is held constant, while the mole fractions of the components are varied. At the wavelength associated with a particular complex, the stoichiometry is determined from the mole fraction of TO-PRO-3 (Xdye) corresponding to the maximum absorbance. Continuous variation analysis using poly(dAdT)2 provides the basis of this discussion because it has homogeneous binding sites and it forms all the possible complexes (Figs S5 and S6). The following empirical stoichiometries (expressed as the dye mole fractions, Xdye) are observed for TO-PRO-3 complexes with poly(dAdT)2: Xdye = 0.65 (complex I, 514 nm), 0.425 (complex II, 590 nm) and ∼0.34 (complex III, 642 nm) (Fig. 8). For complex III, only an estimate of the stoichiometry is possible from Figure 8 because the maximum occurs between Xdye = 0.30 and 0.375. A more definitive experiment was conducted using calf thymus DNA, for which a distinct transition at Xdye = 0.35 is observed. Thus, a reasonable estimate of the actual stoichiometry of this complex is 1 dye:2 base pairs, which suggests nearest neighbor exclusion of the binding sites (36). Along with the small 10 nm red shift of the electronic transition, this stoichiometry supports the assertion that complex III is associated with TO-PRO-3 molecules which are intercalated between the base pairs. For complex I, calf thymus and poly(dIdC)2 exhibited transitions at Xdye = 0.6 and 0.65, respectively. Thus, the stoichiometry of complex I does not depend strongly on the base sequence of the DNA. For poly(dAdT)2, the empirical stoichiometry of 1.86 dyes/base pair results in many possibilities for the actual stoichiometries of the form (2n – 1) dyes/n base pairs, where n is an integer. While the closest match with the experimental data is 13 dyes/7 base pairs, the actual stoichiometry of this complex cannot be deduced from these measurements. The key point is that a high-density dye complex forms with the DNA. With the +2 charge of the chromophore, the resulting complex has a net +1.7 charge/base pair. High-density aggregates have also been observed for other small molecule ligands, but charge neutralization appears to define the upper limit of binding (24,49,50), except for some porphyrins (51). Linear dichroism spectroscopy could clarify the arrangement of the bound chromophores by measuring how the transition dipoles of the dyes are oriented relative to the DNA axis. For complex II, the empirical stoichiometry is Xdye = 0.425. This result could be affected by the proximity of the electronic transitions for complex II, complex III and unbound TO-PRO-3. For higher dye concentrations, the contribution of the unbound dye to the absorbance at 590 nm is significant. However, in the region Xdye < 0.5, spectral fitting demonstrates that the peaks are sufficiently resolved so that complex II is the dominant contributor to the absorbance at 590 nm. Based on the empirical stoichiometry, actual stoichiometries of 2 dyes:3 base pairs (Xdye = 0.4) and 3 dyes:4 base pairs (Xdye = 0.43) are most reasonable based on the following structural arguments. Through our spectroscopic studies with poly(dGdC)2 and poly(dIdC)2 and through the competition experiments with distamycin, we have demonstrated that this band is associated with minor groove binding. The lengths of 3 and 4 base pair minor groove binding sites are ∼13 and ∼17 Å, respectively, based on a pitch of 35.4 Å for a 10.4 base pair turn and a helical diameter of 23.7 Å with 7.5 Å deep minor groove (52). Assuming the propylamine side chain of TO-PRO-3 is not bound in the minor groove, a 3 base pair binding site is feasible for the aromatic moiety of TO-PRO-3 (length ∼12 Å). However, if the side chain does bind in the minor groove, the 4 base pair binding site is more reasonable, given the length of ∼17 Å for TO-PRO-3 with the propylamine side chain. The question arises as to how the three dyes could be arranged. Both the visible absorption and CD spectra suggest that the dyes adopt a stacked arrangement. It seems unlikely that the minor groove is wide enough to accommodate the three dyes stacked on top of each other. Another possibility is that a dimer forms in the minor groove with a third dye bound in a side-to-side or partially sandwiched fashion, as suggested for Hoechst 33258 complexes with DNA (48). Our results with bacteriophage T4 DNA indicate that this higher order structure does not involve major groove binding and thus is localized in the minor groove. Given the significant stabilization of the helix by the complex, this structure deserves further investigation, and linear dichroism studies may provide a useful insight into the structure. Consistent with our spectroscopic studies of poly(dGdC)2 and poly(dIdC)2, a continuous variation study with calf thymus DNA supports the assertion that minor groove binding is not favored for GC-rich regions of the DNA. For calf thymus DNA, the empirical stoichiometry of associated with complex II is Xdye = 0.35. This stoichiometry is less than that observed for poly(dAdT)2 because of the hindrance to binding in the minor groove by the guanine bases. Finally, we note that the stoichiometry of the 674 nm transition is Xdye = 0.36, or 0.56 dye/base pair. The significant red shift of this band relative to the unbound dye (+39 nm) suggests formation of a J aggregate. However, we observed no fluorescence associated for this species.
Figure 8.
Continuous variation analysis for 10 µM solutions of TO-PRO-3 and poly(dAdT)2 at 7°C. The absorbances at 514 nm (complex I), 590 nm (complex II), 642 nm (complex III) and 674 nm are plotted as open circles.
CONCLUSIONS
In this work, we have investigated the association of DNA and the trimethine-bridged cyanine dye TO-PRO-3. Three distinct complexes with different stoichiometries form. At high dye concentrations, complex I forms with a stoichiometry of 1.86 dyes/base pair. Based on the evidence in this paper, dye stacking on the exterior of the DNA strand is occurring, presumably because of the favorable electrostatic interactions between the dye and the DNA phosphate groups and because of van der Waals interactions between these polarizable chromophores. Evidence for dye stacking comes from the 118 nm blue shift and the hypochromism of the electronic transition and the shape of the CD bands. Long-range intermolecular interactions are significant, as exhibited by the enhancement of resonance scattering for high molecular weight DNA and by the lack of complex formation with a short oligonucleotide. Based on the difference in the transition temperatures, the dissociation of complex I and of the duplex are not coupled, indicative of a weak interaction between the dyes and the DNA. Complex formation is not hindered by alterations in either the major or minor groove, suggesting a common binding site, which we propose to be on the exterior of the DNA strand. Complex II forms with a lower stoichiometry of 0.74 dyes/base pair. For this binding mode, the dyes also exhibit cooperative interactions, as evident from the 48 nm blue shift of the electronic band and the shape of the CD bands. The dyes associate in the minor groove of the DNA strand, as demonstrated through the comparison of poly(dGdC)2 with poly(dIdC)2 and poly(dAdT)2 and through a competition experiment with distamycin. The complex stabilizes the DNA helix against dissociation, and two possible structures are distinguished by how the alkylammonium side chain interacts with the minor groove. The dyes are intercalated between the base pairs in complex III, based on the small red shift of the electronic transition and the stoichiometry of 1 dye:2 base pairs, as expected for nearest neighbor binding.
Because of their favorable spectroscopic properties, cyanine dyes are useful for applications requiring sensitive DNA detection. However, these studies demonstrate that TO-PRO-3 forms complexes with DNA that exhibit fluorescence quenching when the concentration of dyes is high relative to the base pair concentration, an important consideration for applications that have unknown DNA concentrations (53,54). In addition, these and other studies illustrate the importance of intermolecular interactions in the association of small molecules with DNA. In particular, these results show that the minor groove bound species imparts significant stability of the helix, and a trimer stoichiometry is indicated from the continuous variation analysis. We are conducting further studies of the structure of this complex.
SUPPLEMENTARY MATERIAL
Supplementary Material is available at NAR Online.
Acknowledgments
ACKNOWLEDGEMENTS
We thank Professor Min-Ken Liao (Furman University) for assistance with the preparation of the T4 DNA. Professor Nick Hud (Georgia Institute of Technology) provided valuable insight regarding the continuous variation analysis and generous use of a spectrometer. The comments and suggestions of the reviewers are greatly appreciated. The National Institutes of Health and the National Science Foundation provided financial support.
REFERENCES
- 1.Wemmer D.E. (2000) Designed sequence-specific minor groove ligands. Annu. Rev. Biophys. Biomol. Struct., 29, 439–461. [DOI] [PubMed] [Google Scholar]
- 2.Wang L., Bailly,C., Kumar,A., Ding,D., Bajic,M., Boykin,D.W. and Wilson,W.D. (2000) Specific molecular recognition of mixed nucleic acid sequences: an aromatic dication that binds in the DNA minor groove as a dimer. Proc. Natl Acad. Sci. USA, 97, 12–16. [DOI] [PMC free article] [PubMed] [Google Scholar]
- 3.Wemmer D.E. and Dervan,P.B. (1997) Targeting the minor groove of DNA. Curr. Opin. Struct. Biol., 7, 355–361. [DOI] [PubMed] [Google Scholar]
- 4.Chaires J.B. (1998) Energetics of drug-DNA interactions. Biopolymers, 44, 201–215. [DOI] [PubMed] [Google Scholar]
- 5.Wang L., Kumar,A., Boykin,D.W., Bailly,C. and Wilson,W.D. (2002) Comparative thermodynamics for monomer and dimer sequence-dependent binding of a heterocyclic dication in the DNA minor groove. J. Mol. Biol., 317, 361–374. [DOI] [PubMed] [Google Scholar]
- 6.Pilch D.S., Poklar,N., Baird,E.E., Dervan,P.B. and Breslauer,K.J. (1999) The thermodynamics of polyamide-DNA recognition: hairpin polyamide binding in the minor groove of duplex DNA. Biochemistry, 38, 2143–2151. [DOI] [PubMed] [Google Scholar]
- 7.Rentzeperis D., Marky,L.A., Dwyer,T.J., Geierstanger,B.H., Pelton,J.G. and Wemmer,D.E. (1995) Interaction of minor groove ligands to an AAATT/AATTT site: correlation of thermodynamic characterization and solution structure. Biochemistry, 34, 2937–2945. [DOI] [PubMed] [Google Scholar]
- 8.Didraga C., Klugkist,J.A. and Knoester,J. (2002) Optical properties of helical cylindrical molecular aggregates: the homogeneous limit. J. Phys. Chem. B, 106, 11474–11486. [Google Scholar]
- 9.Pasternack R.F. and Gibbs,E.J. (1996) Porphyrin and metalloporphyrin interactions with nucleic acids. In Sigel,A. and Sigel,H. (eds), Metal Ions in Biological Systems. Marcel Dekker, New York, Vol. 33, pp. 367–397. [PubMed]
- 10.Fiel R.J. (1989) Porphyrin-nucleic acid interactions: a review. J. Biomol. Struct. Dyn., 6, 1259–1275. [DOI] [PubMed] [Google Scholar]
- 11.Kubát P., Lang,K., Král,V. and Anzenbacher,P.,Jr (2002) Preprogramming of porphyrin-nucleic acid assemblies via variation of the alkyl/aryl substituents of phosphonium tetratolyporphyrins. J. Phys. Chem. B, 106, 6784–6792. [Google Scholar]
- 12.Pasternack R.F., Bustamante,C., Collings,P.J., Giannetto,A. and Gibbs,E.J. (1993) Porphyrin assemblies on DNA as studied by a resonance light-scattering technique. J. Am. Chem. Soc., 115, 5393–5399. [Google Scholar]
- 13.Gibbs E.J., Tinoco,I.,Jr, Maestre,M.F., Ellinas,P.A. and Pasternack,R.F. (1988) Self-assembly of porphyrins on nucleic acid templates. Biochem. Biophys. Res. Commun., 157, 350–358. [DOI] [PubMed] [Google Scholar]
- 14.Collings P.J., Gibbs,E.J., Starr,T.E., Vafek,O., Yee,C., Pomerance,L.A. and Pasternack,R.F. (1999) Resonance light scattering and its application in determining the size, shape and aggregation number for supramolecular assemblies of chromophores. J. Phys. Chem. B, 103, 8474–8481. [Google Scholar]
- 15.James T.H. (1977) The Theory of the Photographic Process. Macmillan, New York.
- 16.West W. and Pearce,S. (1965) The dimeric state of cyanine dyes. J. Phys. Chem., 69, 1894–1903. [Google Scholar]
- 17.Möbius D. (1995) Scheibe aggregates. Adv. Mater. (Weinheim, Ger.), 7, 437–444. [Google Scholar]
- 18.Seifert J.L., Connor,R.E., Kushon,S.A., Wang,M. and Armitage,B.A. (1999) Spontaneous assembly of helical cyanine dye aggregates on DNA nanotemplates. J. Am. Chem. Soc., 121, 2987–2995. [Google Scholar]
- 19.Rye H.S., Yue,S., Wemmer,D.E., Quesada,M.A., Haugland,R.P., Mathies,R.A. and Glazer,A.N. (1992) Stable fluorescent complexes of double-stranded DNA with bis- intercalating asymmetric cyanine dyes: properties and applications. Nucleic Acids Res., 20, 2803–2812. [DOI] [PMC free article] [PubMed] [Google Scholar]
- 20.Larsson A., Carlsson,C., Jonsson,M. and Albinsson,B. (1994) Characterization of the binding of the fluorescent dyes YO and YOYO to DNA by polarized light spectroscopy. J. Am. Chem. Soc., 116, 8459–8465. [Google Scholar]
- 21.Petty J.T., Bordelon,J.A. and Robertson,M.E. (2000) Thermodynamic characterization of the association of cyanine dyes with DNA. J. Phys. Chem. B, 104, 7221–7227. [Google Scholar]
- 22.Bordelon J.A., Feierabend,K.J., Siddiqui,S.A., Wright,L.L. and Petty,J.T. (2002) Viscometry and atomic force microscopy studies of the interactions of a dimeric cyanine dye with DNA. J. Phys. Chem. B, 106, 4838–4843. [Google Scholar]
- 23.Nygren J., Svanvik,N. and Kubista,M. (1998) The interactions between the fluorescent dye thiazole orange and DNA. Biopolymers, 46, 39–51. [DOI] [PubMed] [Google Scholar]
- 24.Nordén B. and Tjerneld,F. (1977) Optical studies on complexes between DNA and pseudoisocyanine. Biophys. Chem., 6, 31–45. [DOI] [PubMed] [Google Scholar]
- 25.Ogul’chansky T.Y., Losytskyy,M.Y., Kovalska,V.B., Yashchuk,V.M. and Yarmoluk,S.M. (2001) Interactions of cyanine dyes with nucleic acids. XXIV. Aggregation of monomethine cyanine dyes in the presence of DNA and its manifestation in absorption and fluorescence spectra. Spectrochim. Acta A, 57, 1525–1532. [DOI] [PubMed] [Google Scholar]
- 26.Mikheikin A.L., Zhuze,A.L. and Zasedatelev,A.S. (2000) Binding of symmetric cyanine dyes into the DNA minor groove. J. Biomol. Struct. Dyn., 18, 59–72. [DOI] [PubMed] [Google Scholar]
- 27.Wang M., Silva,G.L. and Armitage,B.A. (2000) DNA-templated formation of a helical cyanine dye J-aggregate. J. Am. Chem. Soc., 122, 9977–9986. [Google Scholar]
- 28.Garoff R.A., Litzinger,E.A., Connor,R.E., Fishman,I. and Armitage,B.A. (2002) Helical aggregation of cyanine dyes on DNA templates: effect of dye structure on the formation of homo- and heteroaggregates. Langmuir, 18, 6330–6337. [Google Scholar]
- 29.Davidson Y.Y., Gunn,B.M. and Soper,S.A. (1996) Spectroscopic and binding properties of near-infrared tricarbocyanine dyes to double-stranded DNA. Appl. Spectrosc., 50, 211–221. [Google Scholar]
- 30.Milanovich N., Suh,M., Jankowiak,R., Small,G.J. and Hayes,J.M. (1996) Binding of TO-PRO-3 and TOTO-3 to DNA: fluorescence and hole-burning studies. J. Phys. Chem., 100, 9181–9186. [Google Scholar]
- 31.Maniatis T., Fritsch,E.F. and Sambrook,J. (1982) Molecular Cloning: A Laboratory Manual. Cold Spring Harbor Laboratory Press, Cold Spring Harbor, NY.
- 32.SantaLucia J.S. Jr, Allawi,H.T. and Seneviratne,P.A. (1996) Improved nearest-neighbor parameters for predicting DNA duplex stability. Biochemistry, 35, 3555–3562. [DOI] [PubMed] [Google Scholar]
- 33.Polak M. and Hud,N.V. (2002) Complete disproportionation of duplex poly(dT)·poly(dA) into triplex poly(dT)·poly(dA)·poly(dT) and poly(dA) by coralyne. Nucleic Acids Res., 30, 983–992. [DOI] [PMC free article] [PubMed] [Google Scholar]
- 34.Huang C.Y. (1982) Determination of binding stoichiometry by the continuous variation method: the Job plot. Methods Enzymol., 87, 509–525. [DOI] [PubMed] [Google Scholar]
- 35.Waring M.J. (1965) Complex formation between ethidium bromide and nucleic acids. J. Mol. Biol., 13, 269–282. [DOI] [PubMed] [Google Scholar]
- 36.Cantor C.R. and Schimmel,P.R. (1980) Biophysical Chemistry. W.H. Freeman, New York.
- 37.McRae E.G. and Kasha,M. (1964) The molecular exciton model. In Augenstein,L., Mason,R. and Rosenberg,B. (eds), Physical Processes in Radiation Biology. Academic Press, New York, pp. 23–42.
- 38.Smith J.O., Olson,D.A. and Armitage,B.A. (1999) Molecular recognition of PNA-containing hybrids: spontaneous assembly of helical cyanine dye aggregates on PNA templates. J. Am. Chem. Soc., 121, 2686–2695. [Google Scholar]
- 39.Kimura T., Takeuchi,M., Nagasaki,T. and Shinkai,S. (1995) Sugar-induced color and orientation changes in a cyanine dye bound to boronic-acid-appended poly(l-lysine). Tetrahedron Lett., 36, 559–562. [Google Scholar]
- 40.Davidson M.W., Griggs,B.G., Lopp,I.G., Boykin,D.W. and Wilson,W.D. (1978) Nuclear magnetic resonance investigation of the interaction of a 13C-labeled quinacrine derivative with DNA. Biochemistry, 17, 4220–4225. [DOI] [PubMed] [Google Scholar]
- 41.Yen S.-F., Germon,W. and Wilson,W.D. (1983) DNA major-minor groove binding specificity of daunorubicin. Anthramycin-modified and T-4 bacteriophage DNA studies. J. Am. Chem. Soc., 105, 3717–3719. [Google Scholar]
- 42.Barton J.K., Goldberg,J.M., Kumar,C.V. and Turro,N.J. (1986) Binding modes and base specificity of tris(phenanthroline)ruthenium(II) enantiomers with nucleic acids: tuning the stereoselectivity. J. Am. Chem. Soc., 108, 2081–2088. [Google Scholar]
- 43.Wetmur J.G. (1967) Studies on the kinetics of renaturation of DNA. PhD Thesis, California Institute of Technology.
- 44.Ren J. and Chaires,J.B. (1999) Sequence and structural selectivity of nucleic acid binding ligands. Biochemistry, 38, 16067–16075. [DOI] [PubMed] [Google Scholar]
- 45.Sehlstedt U., Kim,S.K. and Nordén,B. (1993) Binding of 4′,6-diamidino-2-phenylindole to [poly(dI-dC)]2 and [poly(dGdC)]2: the exocyclic amino group of guanine prevents minor groove binding. J. Am. Chem. Soc., 115, 12258–12263. [Google Scholar]
- 46.Rougée M., Faucon,B., Mergny,J.L., Barcelo,F., Giovannangeli,C., Garestier,T. and Hélène,C. (1992) Kinetics and thermodynamics of triplex-helix formation: effects of ionic strength and mismatches. Biochemistry, 31, 9269–9278. [DOI] [PubMed] [Google Scholar]
- 47.Chaires J.B. (2001) Analysis and interpretation of ligand–DNA binding isotherms. Methods Enzymol., 340, 3–22. [DOI] [PubMed] [Google Scholar]
- 48.Loontiens F.G., Regenfuss,P., Zechel,A., Dumortier,L. and Clegg,R.M. (1990) Binding characteristics of Hoechst 33258 with calf thymus DNA, poly[d(A-T)] and d(CCGGAATTCCGG): multiple stoichiometries and determination of tight binding with a wide spectrum of site affinities. Biochemistry, 29, 9029–9039. [DOI] [PubMed] [Google Scholar]
- 49.Bloomfield V.A. (1996) DNA condensation. Curr. Opin. Struct. Biol., 6, 334–341. [DOI] [PubMed] [Google Scholar]
- 50.Bradley D.F. and Wolf,M.K. (1959) Aggregation of dyes bound to polyanions. Proc. Natl Acad. Sci. USA, 45, 944–952. [DOI] [PMC free article] [PubMed] [Google Scholar]
- 51.Carvlin M.J., Datta-Gupta,N. and Fiel,R.J. (1982) Circular dichroism spectroscopy of a cationic porphyrin bound to DNA. Biochem. Biophys. Res. Commun., 108, 66–73. [DOI] [PubMed] [Google Scholar]
- 52.Stryer L. (1995) Biochemistry. W.H. Freeman, New York.
- 53.Anazawa T., Matsunaga,H. and Yeung,E.S. (2002) Electrophoretic quantitation of nucleic acids without amplification by single-molecule imaging. Anal. Chem., 74, 5033–5038. [DOI] [PubMed] [Google Scholar]
- 54.Doornbos R.M., De Grooth,B.G., Kraan,Y.M., Van Der Poel,C.J. and Greve,J. (1994) Visible diode lasers can be used for flow cytometric immunofluorescence and DNA analysis. Cytometry, 15, 267–271. [DOI] [PubMed] [Google Scholar]
Associated Data
This section collects any data citations, data availability statements, or supplementary materials included in this article.


