

Abstract
Management of patients, especially chronic patients, requires presentation and processing of very large amounts of time-oriented clinical data. Using regular means such as text or tables is often ineffective, thus we propose to use the visual presentation of the information in decision support, especially in the medical domain. Displaying only raw data is not sufficient, because it still requires the user to derive meaningful conclusions from large amount of data. In order to support the computation process, we provide automated mechanisms for temporal abstraction. These mechanisms perform derivation of context-specific, interval-based abstract concepts from raw time-stamped clinical data, by using a domain-specific knowledge base. Then, these abstractions can be visualized and explored. In addition, in many cases (e.g. when comparing the effect of new drugs on various groups of patients) a view of multiple records is more effective than a view of each individual record separately. We have designed and implemented a system called VISITORS (VisualizatIon of Time-Oriented RecordS) which includes several tools for intelligent visualization and exploration of raw data and abstracted concepts for multiple patient records.
Introduction: The Need for Knowledge-Based Visualization of Multiple Time-Oriented Medical Records
Many clinical and medical research tasks require fast processing of large amounts of time-oriented data as well as extraction of clinically meaningful abstract concepts that are derivable from these data. Standard statistical tools are not sufficient to answer these needs. The need is especially clear when using a medical decision support system.
The temporal-abstraction (TA) task is defined as follows [1, 2]: The input includes a set of timestamped parameters (e.g. blood glucose values), events (e.g. insulin injections), and abstraction goals, which create the necessary clinical context (e.g. therapy of patients who have insulin-dependent diabetes). The output includes a set of interval-based, context-specific parameters at the same or at a higher level of abstraction and their respective values (e.g. "a period of 5 weeks of grade 2 bone-marrow toxicity in the context of therapy with AZT"). (See Fig.1)
Fig. 1.

Temporal-abstraction of a single patient’s data in an oncology domain. Raw data (platelet and granulocyte counts) are plotted over time at the bottom. External events (BMT-bone-marrow transplantation and PAZ-a therapy protocol for treating chronic graft-versus-host disease CGVHD), and abstractions (B[n]- bone-marrow–toxicity grade n, an abstraction of platelet and granulocyte counts) computed from the data are plotted as intervals above the data.
We have designed a knowledge-based method for automated derivation of abstractions from time-oriented clinical data [2]. The output abstractions of our computational mechanism can then be visualized and explored using additional tool which we have designed [3]. The temporal abstraction method is based on underlying temporal abstraction ontology [2].
It has been demonstrated that a visual representation can often communicate information much move rapidly and effectively than any other method [4]. Research on information visualization in the areas of presentation and display techniques in general [5] and of human-computer interfaces [6] has developed useful visualization techniques for typically static presentations of raw data. In the area information browsing, various exploration techniques were developed, such as dynamic query, tree visualize techniques and graphical methodologies such as scatter grams, pie charts, bar charts and their derivative techniques. However, visualization of clinically meaningful domain-specific temporal abstractions derivable from the raw data might be significantly more insightful than exploration of only the raw data.
In addition, in many decision support tasks, there is a need to explore a group of patient records and not only the data of one single patient. In tasks such as quality assessment or analysis of clinical trials of new drugs, it is often meaningless to explore individual patient records. Furthermore, certain patterns can only be discovered through analysis of multiple patient records. Therefore, we are designing an approach that enables visualization of a group of time-oriented records at multiple levels of abstractions, by capitalizing on the use of our temporal abstraction mechanisms.
The rest of this paper is organized as follows. In next section, we present existing visualization systems in medical domains. After, we present our approach, which makes it possible to query a group of patients. We also demonstrate examples of several our visualization and exploration technique. Finally, we discuss the implementations of the new framework.
Background: Information Visualization in Medical Domains
Researchers in a medical domain have developed various visualization methods to display and explore the time-oriented patient data.
The LifeLines system [7] provides a general visualization environment for personal histories that can be applied to medical and court records, professional histories and other types of biographical data.
Another system, InfoZoom [8] uses a novel technique to display data sets as highly compressed table which always fit completely onto the screen. The user can interactively explore data of the patients group.
However, these methods emphasize the display only of raw patient’s data and do not focus on visualization of derived temporal conclusions or meaningful patterns using domain-specific knowledge
In our previous research we have implemented the framework called KNAVE. KNAVE and its more advanced version KNAVE–II [3] (See Fig. 2) is a distributed architecture for interactive visualization and intelligent exploration of time-oriented clinical data at multiple level of abstraction, regarding a single patient. KNAVE-II is an intelligent interface to IDAN [9]. The web-based architecture enables users (e.g., physicians) to query, visualize and explore clinical time-oriented databases. KNAVE-II supports visualization of context-sensitive interpretations (abstractions) of the time-stamped data, as well as the dynamic visual exploration of the raw data. The architecture enables exploration along both absolute (calendar-based) and relative (clinically meaningful) time-lines. The complete architecture has been implemented and evaluated by expert clinicians in the oncology domain [10].
Fig. 2.

A view of an individual patient’s data in the KNAVE-II system (in an oncology domain). On the left is a browser to the domain's ontology. On the right side are displayed as panels: raw data (bottom), computed on the fly interval-based temporal abstractions (middle) and instance of the meaningful pattern (top). Specialized operators enable users to perform actions such as zoom in or out in various time granularities, explore semantically related concepts, display the knowledge used to derive the concept, and show statistics.
In area of a visualization of abstract data regarding a group of patients, currently, no framework exists that completely and in a domain-independent fashion solves all aspects of such task. The design and implementation of such framework is the major goal of our current research.
The New Framework: VISITORS
We have designed a general architecture, VISITORS (VISualizatIon of Time-Oriented RecordS) for visualization and exploration of raw data, and, more importantly, abstract concepts, derivable from multiple time-oriented clinical data sets. In this section we explain how users can query sets of patients. We also present several examples of visualization tasks which we support.
There are three main unique features to our visual exploration research, whose combination distinguishes our approach from others:
Treatment of multiple records. The user can view information about not only individual patient data, but also regarding a whole group or union of patient’s records.
Treatment of the temporal dimension as a first class citizen. The temporal dimension is special, because it can be explored in various granularities, such as day, month, and year. It also has a direction, i.e. from the past to future.
The user interface is based on the temporal-abstraction ontology, which enables navigation and exploration of semantically related raw and abstract concepts. For example, the user can explore graphically the relation between the raw concept of temperature and the abstract concept of level of fever (which is derived from the temperature concept); she can also explore both the white-blood cell (WBC) count values over time as well as the related high-level concept of the increasing WBC count, which is a trend abstraction.
The general architecture of the VISITORS framework is described follow (See Fig. 3).
Fig. 3.
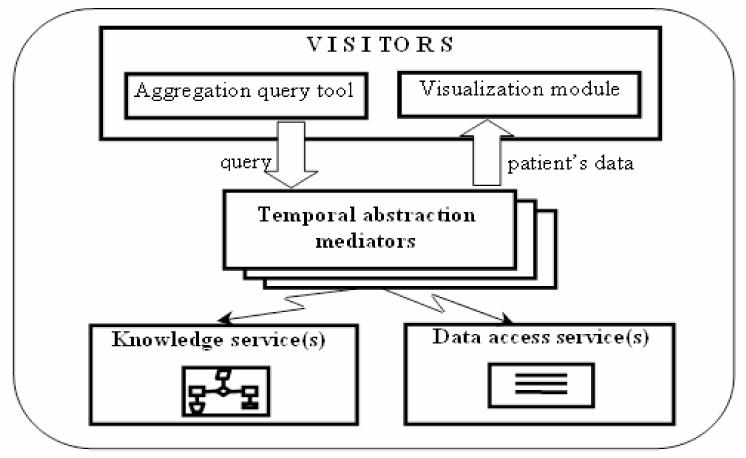
The VISITORS framework
End users (clinicians) interact with VISITORS to submit time-oriented queries of group of patients. The temporal-abstraction mediator [11], using data from the appropriate local data-source through the data-access service, and temporal-abstraction and visualization knowledge from the appropriate domain-specific knowledge base through the knowledge service, answers these queries. Patient‘s data return to visualization module which enables users to dynamically explore resultant abstractions and raw parameters, using a specialized graphical display. Problems of implementation of this architecture will be obtained bellow.
Aggregation Queries
An aggregation query is a query on a set of subjects. A typical scenario in a clinical domain includes two steps:
1. Selecting a set of patients to observe
The following are possible criteria for selection of patients:
Demographical data can be retrieved from the data base without a temporal abstraction mechanism, for example ID, age, and sex.
Domain-specific concepts which exist in a domain-specific knowledge base and that might require additional temporal-abstraction computation.
There are three main types: (1) raw concepts: temperature, hemoglobin; (2) events: operation, start of pregnancy; (3) abstract concepts: level of white blood cells count, trends of liver functions.
Using of Time Constraints to define the relevant time interval. There are two kinds of constraints: (1) Absolute or calendar time, for example: select a patient who has suffered a stroke on 11.09.01; and (2) Relative time, which refers to some event, for example: select patients who had decreasing liver function within two weeks after the transplantation.
2. Selection of a concept to explore
Which raw parameters or abstracted concepts we want to investigate, e.g. CO2, bands, level of hemoglobin.
Note that this type of query typically refers to a very large data set, which can make the time needed for processing the query very long. We are considering the following approach: performing the computation in parallel on multiple machines, using a version of the IDAN architecture [13].
Basic Visualization Tasks in VISITORS
Our system supports various types of visualization tasks. Note, that all types of visualization tasks will be supported for both kinds of data – raw and abstract, and for both – individual and multiple data sets.
1. Visualization of a single-concept over time
Visualization of one concept (raw or abstract) for one group of patients. (See Fig. 4, 5)
Fig 4.

A visualization of a raw parameter (e.g. CO2) for one group of patients. The horizontal axis represents the time line (e.g. Jan 1 – Jan 30) and the vertical axis – the value of the measured or computed parameter. In the graph we can see minimal value of the group as the bottom line, maximal value of group as the top line, and the average value of the group as the wide line inside. The level of saturation of color enables the viewer to judge average amount of the items belonging to each area. Data of one selected patient is displayed as line inside
Fig. 5.

A visualization of the distribution of an abstract parameter (e.g. Bands_State) for one group of patients. The horizontal axis represents the time line (e.g. Jan 1 – Jan 30) and the vertical axis – the distribution of the values of the derived parameter. Each value is presented by other color. The user can see the proportions of the number of patients in each value for the designed time interval
2. Visualization of multiple-concepts for a single-group within a time period
This type of visualization (See Fig. 6) is designed for the case in which we need to compare a number of concepts for one specific group of patients. We can answer to question: how constraining one parameter can affect the association between multiple concepts.
Fig. 6.

A simple scenario of comparing selected concepts within a selected time period: two primitive raw concepts (He-matocrit and WBC) and two abstract (Reticulocyte State and Hemoglobin State) concepts. Values for visualization were chosen from a time interval, e.g. January, specified dynamically by the user. (The user can explore the correlations among selected parameters within a various selected time intervals and within a various time granularity). Each point on a value axis represents the mean value of the corresponding concept for one single patient during the selected time period. At the top of the display the user can see the units of the corresponding axes. (a) Data of all patients in a group are represented in a graph. The values of all parameters for one patient are underlined by wide connected lines. (b) On this visualization, the user can apply necessary constraints. He can select reduce the range of the values on the raw data axis by trackbars, e.g. from 55 to 45 in Hematocrit axis and view how reducing influences on another parameters (e.g. there are not patients in a group with Hemoglobin State values “high” or “very high”); or choose some values to investigate, e.g. “normal” or “low” within the Hemoglobin State’s axis in order to view the correspondent values of other parameters in a group of patients.
3. Single-group, single-concept, multiple time records, within a given time range
During the treatment of chronic patients, for example patients which have diabetes, there is a need to determine the pattern that characterizes a typical time period, such as a day of the patient or patients, within a given time range (e.g. month). The generalization for any granularity, for example months or years, can be easily done.
Exploration Techniques in VISITORS
The designed architecture supports intelligent exploration of the data. The exploration contains the following features on the basis of Shneiderman mantra [6]:
Overview of the data
This is a zoomed-out view of the data that allows the user to over view a data collection with adjoining detail view. For example, we will use this feature to display multiple records or compare more than two parameters.
Zoom and pan
Panning is a smooth movement of a viewing frame. For example, in the time dimension user can move backward and forward among different time unit, e.g. month – Jan, Feb, etc. Zooming is the increasing (or decreasing) of viewing frame under his constraint. Zooming usually is used for magnification of picture and more detailed view of displayed data. Regarding zoom is necessary to notice about semantic zoom and, especially important, about temporal granularity. In difference from geometrical zoom, where all objects change only their size, with semantic zoom objects can additionally change their display’s form or display additional information. The visualization will support the time-granularity-sensitive zoom, i.e. users are enabled zoom into a specific period of time.
Filter task
We can filter out uninteresting data. For example, we can filter, when applying the compare-value task, so as to remove superfluous information from a graph or allocate a subgroup from record visualization, e.g. on basis age.
Details on demand
The usual approach will be to click on an attribute in the graph to get the values and an explanation, perhaps in a pop-up window. At additional technique is using a tooltip in the graph. With the move of mouse over the graph, information in the tooltip changes according to the data relevant to this area of the graph.
In additional to the above mentioned techniques the VISITORS system supports also: explanation of the abstractions using both relevant data and knowledge; and necessary statistics regarding raw and abstracted data and regarding group of patients.
Discussion
We have presented the VISITORS system, a general architecture for knowledge-based visualization and exploration of multiple time-oriented medical records. There are three main unique features which distinguish our approach from others: (1) we can support visualization of multiple clinical data sets, i.e. clinicians can view and explore data of an interested group of patients which can be defined by users; (2) the particular attention we give to the temporal dimension, i.e. we can explore the data in various time granularity, e.g. months, years or seconds; and, (3) our system is based domain-specific, but independent, knowledge based, that enabled visualization of temporal abstraction and not only raw data.
Implementation of the full system requires the solution of two additional tasks. First task is the acquisition of domain-specific knowledge. We are working on several approaches to acquire from expert clinicians of the temporal abstract knowledge base, including symbolic and graphical methods for acquisition of complex temporal patterns. Second task is the retrieval of a data from remote heterogeneous clinical databases, without explicitly knowing their local structure and vocabulary. We intend to solve this by MEIDA architecture [13], which links clinical databases to medical knowledge-based decision support applications. An example of using the MEIDA approach is within the IDAN temporal abstraction mediator [9].
Our plans for the future include evaluation, which will be performed on an existing clinical data base, and which will test: functionality, performance, and usability of the system. We will ask a small group of clinicians to answer a set of aggregation queries at different levels of difficulty.
Since a similar system to VISITORS does not currently exist, we can not compare our system with existing ones directly. However, we did perform an evaluation of a previous version of a system goaled for a single particulars small number of patients (KNAVE-II), which was successfully performed in collaboration with our colleges at Stan-ford [10].
We expect our system be useful in other domains such as electronic data security or intelligence, which require derivations of conclusions, based on existing domain-specific knowledge. However, our main immediate objective is to use system for better care of chronic patients, for quality assessment, and for clinical research.
Acknowledgments
This research was supported in part by NIH award no. LM-06806 and Israel Ministry of Defense Award No.89357628-01. We want to thank the staff of Ben-Gurion University's medical-informatics laboratory for their useful comments. We also want to thank our collages at Stanford University and the Palo Alto Veterans Administration Health Care Center, for their assistance in evaluating the IDAN/KNAVE architecture.
References
- 1.Shahar Y, Musen M. Knowledge-based temporal abstraction in clinical domains. Artificial Intelligence in Medicine. 1996;8(3) doi: 10.1016/0933-3657(95)00036-4. [DOI] [PubMed] [Google Scholar]
- 2.Shahar Y. A framework for knowledge-based temporal abstraction. Artificial Intelligence. 1997;90(1–2) doi: 10.1016/0933-3657(95)00036-4. [DOI] [PubMed] [Google Scholar]
- 3.Shahar, Y., Goren-Bar D., Boaz D., and Tahan G. (in press). Distributed, intelligent, interactive visualization and exploration of time-oriented clinical data. Artificial Intelligence in Medicine. [DOI] [PubMed]
- 4.Hearst, M. (2000) User interfaces and visualization. In Baeza Yates, R. and Ribeiro-Neto, B. (Eds.) Modern Information Retrieval, ACM Press, NY, Chapter 10, pp. 257–324.
- 5.Tufte, E.R. (1990) Envisioning Information, Graphics Press, CT.
- 6.Shneiderman, B. (2001) Designing the user interface: strategies for effective human computer interaction. Third Edition, Addison-Wesley Publ. Co., Reading, MA
- 7.Plaisant, C, et al (1998) LifeLines: Using visualization to enhance navigation and analysis of patient records. Revised version in AMIA. [PMC free article] [PubMed]
- 8.Spenke M. Visualization and interactive analysis of blood parameters with InfoZoom. Artificial Intelligence in Medicine. 2001;22(2) doi: 10.1016/s0933-3657(00)00105-6. [DOI] [PubMed] [Google Scholar]
- 9.Boaz D, Shahar Y. A distributed temporal-abstraction mediation architecture for medical databases. Artificial Intelligence in Medicine. 2005;34(1):3–24. doi: 10.1016/j.artmed.2004.07.009. [DOI] [PubMed] [Google Scholar]
- 10.Martins S.B., Shahar Y., et al (2004). Evaluation of KNAVE-II: A tool for intelligent query and exploration of patient data. Proceedings of Medinfo 2004, San Francisco. [PubMed]
- 11.Wiederhold G. Mediators in the architecture of future information systems. IEEE-Computer. 1992;25:38–50. [Google Scholar]
- 12.Ramati, M., and Shahar, Y. (in press). Probabilistic abstraction of multiple longitudinal electronic medical records. Proceedings of the 10th Conference on AIME, 2005.
- 13.German E., Shahar, Y (2005). A Framework for Linking Medical Decision-Support Applications to Clinical Databases. Technical report, Ben Gurion University, Beer Sheva, Israel.