Abstract
The Systematized Nomenclature of Medicine, Clinical Terms (SNOMED CT) was produced by merging SNOMED Reference Terminology (RT)1 with Clinical Terms version 3 (CTV3)2. It was first released in January 2002. This paper summarizes the overall size of the terminology and its rates of change over a period of three calendar years, comprising six subsequent releases each occurring at six-month intervals. Rates of change in raw table size are reported for the concepts, descriptions, and relationships tables. Other measures of change are the number of identifiers made inactive and the reasons for this, as well as the number and rate of changes in the subsumption hierarchies and defining relationships. Awareness of the rate of change in the terminology can help terminology developers focus attention on needed infrastructure support and capacity for handling updates and refinements, and can help application developers by highlighting the need for managing terminology change in applications.
INTRODUCTION AND BACKGROUND
Achieving the full potential of information technology in health care depends on the ability to record, communicate and automatically reason with detailed patient descriptions that are recorded using a standardized terminology. Issues surrounding the development of such a terminology have been the focus of intense effort for many years, while the issues surrounding maintenance and change management have received relatively less attention.
The need for terminology to evolve gracefully is listed as the eleventh of the twelve desiderata in Cimino's list3. Rector, acknowledging the influence of that list, mentions change management as the tenth of ten reasons why clinical terminology is so hard4, and Oliver et. al. described a model for representing change in clinical terminologies5. Since these publications appeared, however, there has been much more effort focused on development and selection of clinical terminologies. A significant amount of development has taken place in line with the specifications and requirements outlined.
SNOMED CT has been published for over three years and freely available in the US and UK for more than a year, and major government bodies and agencies have made recommendations for selection and use of existing terminologies6,7.
It now seems important once again to focus attention on questions of maintenance and change management. We can begin by asking basic questions about the terminology: How big is it? How fast is it changing? Is the rate of change accelerating or slowing? This paper provides concrete answers to these questions for each of the three major tables in the SNOMED CT distribution.
CONCEPTS TABLE: SIZE AND CHANGES
Changes to the concepts table include two major types: additions, and concept status changes. There is one row in the concepts table for each concept or entity‡. Following the principle that identifiers should be permanent, many SNOMED codes and Read Codes that are no longer active are still maintained in the table. The totals for each release by concept status are given in Table 1.
Table 1.
Total number of codes in the concepts table by concept status
| Release | Total | Active | Not active | % not active |
|---|---|---|---|---|
| Jan 2002 | 325,857 | 253,605 | 72,252 | 22.2 |
| Jul 2002 | 333,325 | 259,546 | 73,779 | 22.1 |
| Jan 2003 | 344,549 | 265,191 | 79,358 | 23.0 |
| Jul 2003 | 352,661 | 271,092 | 81,569 | 23.1 |
| Jan 2004 | 357,135 | 269,864 | 87,271 | 24.4 |
| Jul 2004 | 361,824 | 273,763 | 88,061 | 24.3 |
| Jan 2005 | 364,461 | 275,707 | 88,754 | 24.4 |
The two main drivers of changes to the total number of active concepts are the addition of new concepts and the retiring (making inactive) of existing ones.
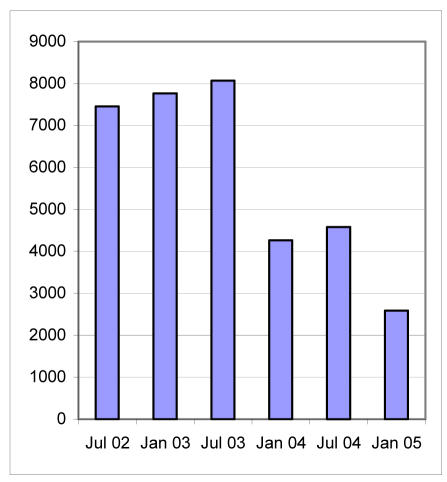
Figure 1 graphically displays the number of new active concepts added in the six recent releases. While the numbers are still in the thousands each release, it appears there may be a downward trend in new additions. However, exploring possible cause-effect relationships between the various influences that can change the number of new additions is beyond the scope of this paper. Obviously these numbers can change dramatically based on new demand for coverage of content areas that have not yet been addressed, or based on increases in pre-coordination (i.e. creating a new code to represent the desired meaning) in content areas that already permit post-coordination (i.e. combining existing codes to express the desired meaning).
Figure 1.
Number of new active concepts added to each release.
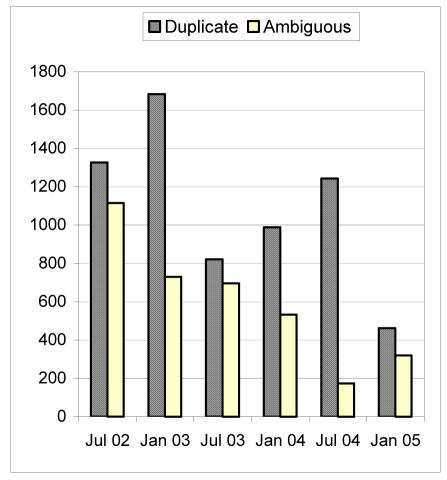
Figure 2 illustrates the number of duplicate and ambiguous concepts that were identified and retired in each release. In the January 2005 release, there are 7,398 more concept codes marked as duplicate, and 3,290 more concept codes marked as ambiguous, compared with the first (January 2002) release. Of the 253,605 active concepts in the first release, 11,822 or 4.7% are no longer active. This statistic is driven primarily by the duplicate and ambiguous concepts, but also includes those retired because they are erroneous, outdated, moved to an extension, or are merely retired for none of these specific reasons.
Figure 2.
Number of duplicate and ambiguous concepts identified and retired in each release.
Examining the figure for trends reveals a clear downward trend in identification of ambiguous concepts. The most common cause of a concept being ambiguous is the presence of a non-synonymous term. Concepts can also be ambiguous because of problems with the fully specified name. A large number of ambiguities resulted from errors in the process of mapping and merging SNOMED RT and CTV38. Continued vigilance is necessary to prevent ambiguities from being introduced as new user-friendly terms are added to existing concepts.
There also seems to be a downward trend in the number of duplicate concepts identified, except that there was a large increase in the two releases in 2004. Many of these can be attributed to additional tools and projects specifically designed to identify redundancy, and to examination of duplicates suggested by the National Library of Medicine (NLM) Unified Medical Language System (UMLS), in which two or more SNOMED concept codes were linked to the same UMLS Concept Unique Identifier (CUI)9. New concept additions also require careful scrutiny to avoid introducing new duplicates.
It is not possible from these data to accurately estimate the number or percent of remaining duplicate and redundant concept codes, but it is possible to put a lower bound on the number that were present in the January 2002 release.
DESCRIPTIONS TABLE CHANGES
Table 2 lists the number of rows in the descriptions table. Each row represents a term attached to a particular concept. For example, the concept named "kidney stone" has a row in the descriptions table for each of "renal calculus", "nephrolith", "renal stone", and five other terms. Linked to a single concept, these are called descriptions to distinguish them from isolated terms which might be attached to more than one concept. For example, "cold" is a term that can be attached to at least three different meanings. Each occurrence of "cold" counts as a different description.
Table 2.
Total number of terms (descriptions) in the descriptions table by description status
| Release | Total | Active | Not active |
|---|---|---|---|
| Jan 2002 | 822,348 | 612,555 | 209,793 |
| Jul 2002 | 874,391 | 645,646 | 228,745 |
| Jan 2003 | 913,696 | 662,299 | 251,397 |
| Jul 2003 | 939,705 | 676,719 | 262,986 |
| Jan 2004 | 957,349 | 677,374 | 279,975 |
| Jul 2004 | 974,943 | 689,134 | 285,809 |
| Jan 2005 | 984,536 | 695,160 | 289,376 |
When a concept is inactivated, all its descriptions are also inactivated, and the same string attached to a different concept identifier will have a different row in the descriptions table and a different description identifier.
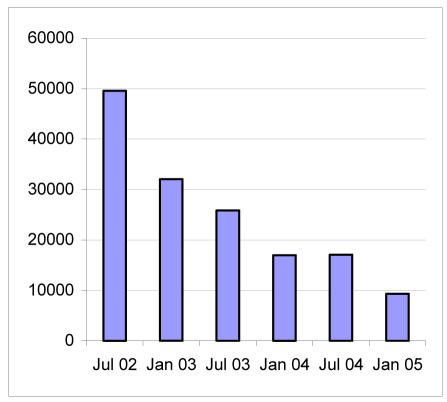
Figure 3 illustrates the number of new active descriptions that have been added in each release.
Figure 3.
Number of new active descriptions added to each release.
The second release (Jul 02) added a relatively large number of active descriptions partly because there were many CTV3 terms that were inadvertently omitted from the Jan 02 release. Nevertheless, there does appear to be a downward trend in the number of new active descriptions being added. As with concept additions, this is subject to user demand and can increase or decrease accordingly.
RELATIONSHIPS TABLE CHANGES
Of the three tables in the main distribution, the relationships table has the largest number of rows and also undergoes the most change from release to release. Unlike concepts and descriptions, relationships that are not active are not retained in the table. Table 3 lists the total number of relationships, dividing them into those that are defining versus those that are not. The non-defining ones include qualifier rows, a feature carried forward from CTV3 to assist with post-coordination, as well as historical relationships and "additional".
Table 3.
Total number of rows in relationships table
| Release | Total | Defining | Non-defining |
|---|---|---|---|
| Jan 2002 | 1,014,872 | 961,416 | 53,456 |
| Jul 2002 | 1,226,186 | 885,904 | 340,282 |
| Jan 2003 | 1,324,152 | 911,108 | 413,044 |
| Jul 2003 | 1,361,960 | 937,435 | 424,525 |
| Jan 2004 | 1,374,955 | 946,249 | 428,706 |
| Jul 2004 | 1,403,908 | 986,761 | 417,147 |
| Jan 2005 | 1,453,499 | 919,005 | 534,494 |
Prior to the Jan 05 release, historical relationships were distributed in a separate table. The large increase in non-defining relationships in Jan 05 reflects the addition of these historical relationships.
Distribution Form of Logic Definitions
One of the reasons the relationships table changes significantly from release to release is the fact that it represents a "normal form" for logic expressions10. Changes to the logic definitions of one concept high in the hierarchy can have a cascading effect on the normal form of many concepts below it in the hierarchy. In other words, one keystroke by an editor can result in hundreds or even thousands of changes in the relationships table. This fact raises questions about what it will take to achieve some degree of stability, in the long term.
Unlike the concepts and descriptions tables which have a monotonically increasing number of rows, and which generally demonstrate better content coverage with an increase in size, the relationships table may actually decrease in size with improvements in quality of the underlying definitions. A decrease in defining relationships for Jan 05 reflects a concerted effort to eliminate unnecessary role groups from the definitions.
Hierarchies: Stated and Inferred
Because they represent a normal form of logic-based definitions, the rows in the relationships table do not directly represent all possible pair-wise subsumption relationships between concepts. These subsumption relationships are often referred to as "is-a" relationships. The distribution normal form represents only the most immediate "is-a" links. From a graph theory perspective, the set of "is-a" links forms a directed acyclic graph (DAG), and the distributed "is-a" relationships are those in the transitive reduction of that DAG. These might be called the "stated is-a links".
Because logical subsumption is transitive, the DAG can also have a maximal form in which all possible pair-wise "is-a" relationships are included; this form is called the transitive closure of the DAG. Loss of is-a links in the distribution normal form from one release to the next is not particularly important, since the links may still be logically valid. Instead it is more important to examine the transitive closure of the SNOMED subsumption relationships to provide insight into the degree of stability or variability of the terminology across releases, since loss of is-a links in the transitive closure means that these links are no longer logically entailed by the terminology.
In order to explore this idea, we computed the transitive closure of the DAG implied by the relationships table in each of the seven releases of SNOMED.
Table 4 shows the number of distributed is-a links connecting active concepts, the number of is-a links in the transitive closure implied by the distributed is-a links. In addition, the final column shows the percentage of transitive closure is-a relationships from each release that survived into the subsequent release. For example, the number for the row Jan 2002 gives the percentage of is-a relationships in the transitive closure of the Jan 2002 release that were still valid in the transitive closure of the July 2002 release. This figure serves as a measure of the degree to which inferable is-a links can be counted on to be stable across releases.
Table 4.
Is-a relationships across releases
| Release | Distributed Is-a links | T.C (transitive closure) Is-a links | Percent of all is-a links surviving |
|---|---|---|---|
| Jan 2002 | 349,023 | 5,197,859 | 92.0 |
| Jul 2002 | 359,772 | 5,405,942 | 92.9 |
| Jan 2003 | 367,496 | 5,490,882 | 95.8 |
| Jul 2003 | 375,911 | 5,629,193 | 96.6 |
| Jan 2004 | 377,681 | 6,143,505 | 94.9 |
| Jul 2004 | 385,603 | 6,274,820 | 96.9 |
| Jan 2005 | 392,316 | 6,562,277 | - |
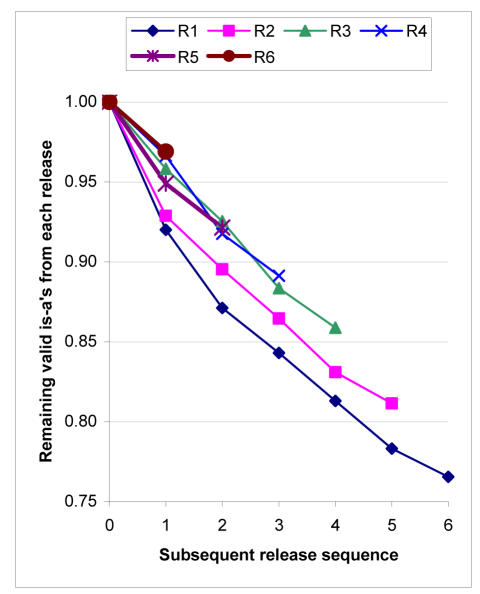
Figure 2 shows graphically what happens to the transitive closure is-a relationships in subsequent releases. Each line represents the percentage of such relationships from a given release that survive into each subsequent release.
It appears that the is-a hierarchy in SNOMED CT is gradually getting more stable, but more than 20% of the transitive closure is-a links from the Jan 02 release are not valid in the Jan 05 release. This means that over a million is-a links that were present (inferable) in the Jan 02 version are not present in the Jan 05 version. Clearly this presents an issue that requires attention by the curators and users of SNOMED.
DISCUSSION
The development and ontological support of terminologies for biomedicine continue to receive a large amount of interest and attention, and it is understandably more exciting to be involved in creation of the new than in refinement and maintenance of the old. On the other hand, the amount of effort that has gone into creating existing terminologies will be most effectively capitalized when we adequately understand and respond to the problems associated with maintenance.
This paper has briefly outlined some of the sizes and rates of change of a very large clinical terminology over a period of three years. The challenges associated with new concept and term addition seem to be diminishing. The degree of duplication and ambiguity in the terminology appear to be decreasing but likely will require significant effort for several more cycles, and ongoing vigilance thereafter.
The part of the terminology that appears to be undergoing the most change is the relationships table, and in particular the inferable subsumption relationships (is-a links). This is understandable given the efforts to improve the logic definitions. In addition, there is a down-stream effect of correcting duplicates and ambiguities. When a concept is made inactive, its is-a relationships also become inactive. If the concept is near the top of the hierarchy, a single concept inactivation can result in invalidation of hundreds of inferable is-as in the transitive closure. Also, as the concept model underlying the logic definitions is fleshed out and expanded over time, a large number of concepts currently marked with "primitive" definitions will be changed to fully defined, with consequent changes in the automatically inferred relationships table rows for those concepts. A growing degree of stability in the concepts table, because of fewer duplicate and redundant concepts, will result in greater stability of the inferable is-a relationships. The remaining changes will tend to be additions.
The present rate of change, with 3% to 5% of is-a links that fail to survive between releases, indicates that application developers who rely on the subsumption relationships need to carefully examine mechanisms for handling this degree of change.
Acknowledgments
This work is supported in part by a grant from the College of American Pathologists.
Footnotes
For the remainder of this paper we will continue the use of the word "concept" rather than "entity" but do not intend this to imply a resolution of the question of whether SNOMED has been (in the past) or should be (in the future) based on a conceptualist versus realist ontological stance.
References
- 1.Spackman KA, Campbell KE, Cote RA. SNOMED RT: A reference terminology for health care. Proceedings/AMIA Annual Fall Symposium. 1997:640–644. [PMC free article] [PubMed] [Google Scholar]
- 2.O'Neil MJ, Payne C, Read JD. Read Codes Version 3: A User Led Terminology. Meth Inform Med. 1995;34:187–921. [PubMed] [Google Scholar]
- 3.Cimino JJ. Desiderata for controlled medical vocabularies in the twenty-first century. Meth Inform Med. 1998;37:394–403. [PMC free article] [PubMed] [Google Scholar]
- 4.Oliver DE, Shahar Y, Musen MA, Shortliffe EH. Representation of Change in Controlled Medical Terminologies. Artificial Intelligence in Medicine. 1999;15(1):53–76. doi: 10.1016/s0933-3657(98)00045-1. [DOI] [PubMed] [Google Scholar]
- 5.Rector AL. Clinical Terminology: Why is it so hard? Meth Inform Med. 1999;38:239–252. [PubMed] [Google Scholar]
- 6.Lumpkin J. NCVHS Recommendations for PMRI Terminology Standards. Letter to US Dept. of Health & Human Service Secretary Thompson, Nov 5 2003. http://ncvhs.hhs.gov/031105lt3.pdf
- 7.SNOMED CT will be the language of the NHS Care Records Service. July 2004 http://www.npfit.nhs.uk/technical/standards/snomed/
- 8.Wang AY, Barrett JW, Bentley T, Markwell D, Price C, Spackman KA, Stearns MQ. Mapping between SNOMED RT and Clinical Terms V.3: A key component of the SNOMED CT development process. Proceedings/AMIA Annual Symposium. 2001; :741–745. [PMC free article] [PubMed]
- 9.Humphreys BL, Lindberg DA, Schoolman HM, Barnett GO. The Unified Medical Language System: an informatics research collaboration. J Am Med Inform Assoc. 1998 Jan–Feb;5(1):1–11. doi: 10.1136/jamia.1998.0050001. [DOI] [PMC free article] [PubMed] [Google Scholar]
- 10.Spackman KA. Normal forms for description logic expression of clinical concepts in SNOMED RT. Proceedings/AMIA Annual Symposium. 2001:627–631. [PMC free article] [PubMed] [Google Scholar]


