Abstract
Regulated expression of Ikaros is critical for normal hemopoiesis and lymphocyte development. To elucidate the mechanisms underlying transcription of Ikaros, tissue-specific DNase I-hypersensitive sites (DHS) were mapped throughout the Ikaros locus, and several promoters were identified. The activity of these regulatory regions was elucidated using an enhanced green fluorescent protein (EGFP) reporter in transgenic mice. Two genomic fragments, each containing a distinct promoter and its associated DHS cluster, were found to be active in the myeloid (DHS-C2 and DHS-C3) and B-cell (DHS-C3) lineages. Although neither of these regulatory regions was active within the majority of differentiating thymocytes and mature T cells, the DHS-C3 region was active at the earliest stages (DN1–DN3) of T-cell differentiation. However, when the DHS-C3 region was combined with the downstream intronic DHS-C6 cluster, its activity was maintained and raised to higher levels at subsequent stages of T-cell differentiation. This combination of regulatory elements provided reporter expression that closely resembles that of endogenous Ikaros during hemo-lymphopoiesis, and it decreased (but did not alleviate) position effect variegation within the expressing cell types.
Keywords: DHS/gene regulation/GFP/Ikaros/transgenic mice
Introduction
Studies on the function and regulation of genes expressed in hemopoietic stem cells (HSCs) and downstream precursors have provided significant insight into the mechanisms that control cell fate decisions in the hemo-lymphoid system. Gene expression studies of lineage-restricted markers have, in some instances, identified nuclear factors expressed earlier in the lineage which are necessary for normal differentiation to occur. These studies have led to the discovery of a number of regulatory genes which control cell fate decisions at specific stages of hemo-lymphoid development (Georgopoulos, 1997; Busslinger et al., 2000; Cantor and Orkin, 2001). Of these regulators, Ikaros encodes a family of zinc finger transcription factors which act from the earliest stages and throughout hemopoiesis, and is required for the balanced production and function of a variety of blood and immune cells (Cortes et al., 1999; Georgopoulos, 2002).
Mice with an inactivating mutation in the Ikaros gene display a reduction in HSC activity in both the fetus and the adult, indicating that the production of an HSC from a mesodermal precursor and possibly its self-renewal properties are impaired (Nichogiannopoulou et al., 1999). Significantly, Ikaros-null mice lack all B lymphocytes and fetal T-lineage cells, and only a small number of T-cell precursors are detected in the thymus after birth (Wang et al., 1996). In sharp contrast to the severe impairment in the production of B- and T-cell precursors, the number of myeloid precursors and their terminally differentiated progeny is increased in Ikaros-null mice (Nichogiannopoulou et al., 1999). Cells with granulocyte properties are present in these sites but display reduced levels of Gr-1, suggesting a deregulation of Ly-6G (Gr-1) gene expression (Wang et al., 1996; Dumortier et al., 2002). Thus, Ikaros expression is not only important for production and possibly maintenance of the HSC, but also for its regulated differentiation along the lymphoid and myeloid pathways.
Ikaros also plays a critical role at subsequent stages of differentiation along the T-cell pathway. The small number of postnatal T-cell precursors detected in the thymus of Ikaros-null mice can progress to the double-positive (DP) and to an apparent CD4+ single-positive (SP) stage of differentiation in the absence of pre-T-cell receptor (TCR) signaling (Winandy et al., 1999). In the presence of TCR signaling, an increase in the number of ‘CD4+ SP’ is detected and is accompanied by a decrease in DP thymocytes (Wang et al., 1996). The presence of this aberrant ‘CD4+ SP’ thymocyte population in Ikaros-null mice reflects an inability of a significant fraction of DP cells to express CD8, implicating Ikaros in the activation of this lineage marker (Harker et al., 2002). T-cell populations in mice which are heterozygous for the Ikaros-null or dominant-negative mutations do not appear to be grossly developmentally abnormal; however, in vitro stimulation through the TCR results in augmented proliferative responses (Avitahl et al., 1999). In vivo, these cells are predisposed to neoplastic transformation (Winandy et al., 1995).
The hemopoietic and lymphoid phenotypes manifested in Ikaros-deficient mice are consistent with its expression in the hemo-lymphoid system. Ikaros mRNA is seen at early sites of hemopoiesis in the developing embryo, including the blood islands of the E8 yolk sac, a small number of mesodermal cells within the embryo proper, and the fetal liver (Georgopoulos et al., 1997). Ikaros is expressed in the fetal thymus from E10.5, concomitant with the onset of its colonization with fetal lymphoid precursors (Georgopoulos et al., 1992). In the bone marrow, Ikaros is first detected in a population enriched for the pluripotent, self-renewing HSC and continues to be expressed in precursor populations enriched for myeloid and lymphoid potential (Morgan et al., 1997; Kelley et al., 1998; Klug et al., 1998). Upon differentiation to mature monocytes, macrophages and erythrocytes, Ikaros expression is downregulated, although it is maintained at significant levels in granulocytes (Klug et al., 1998). In contrast, Ikaros is upregulated in thymocyte precursors as they expand and differentiate, and continues to be expressed at high levels in mature T cells in the fetus and in the adult. It is also upregulated during B-cell differentiation from the pro-B to the pre-B cell stage (Morgan et al., 1997). Among the hemo-lymphoid populations, Ikaros expression is highest in DP thymocytes and mature T cells (Morgan et al., 1997), populations that display haplo-insufficiency phenotypes in mice heterozygous for the Ikaros mutations (Winandy et al., 1995; Avitahl et al., 1999).
Thus, regulation of Ikaros expression is critical for proper differentiation and homeostasis along the lymphoid pathways. Delineating the mechanisms that modulate Ikaros expression at the transcription level may, on the one hand, provide us with regulatory elements active in the HSC and its hemo-lymphoid restricted progeny, and on the other hand may allow us to regulate lymphocyte differentiation and proliferation by manipulating the level of Ikaros expression.
As a first step towards delineating the transcriptional regulation of Ikaros, we mapped the gene in 120 kb of genomic sequence and identified 10 DNase I-hypersensitive site (DHS) clusters in this locus. We next cloned the most 5′ of Ikaros mRNAs, which revealed the presence of two independently spliced untranslated exons that lie in the vicinity of two of the DHS clusters (DHS-C2 and DHS-C3). Fragments containing the DHS-C2 or DHS-C3 clusters exhibited differential activity in the myeloid and lymphoid lineages, respectively. The DHS-C2 region provided expression of an enhanced green fluorescent protein (EGFP) reporter only in granulocytes, whereas DHS-C3 was active predominantly in B cells, a small fraction of myelocytes and at the very early stages (DN1–DN3) of T-cell differentiation. A third fragment containing the intronic DHS-C6 cluster, when placed downstream of DHS-C3, maintained high levels of EGFP expression in differentiating and mature T cells, and decreased variegation in the expressing lymphoid and myeloid populations. Thus, one of the promoter regions of Ikaros in conjunction with one of its intronic enhancers appears to recapitulate the expression of Ikaros within the hemo-lymphoid lineages.
Results
Genomic organization and promoter mapping in the Ikaros locus
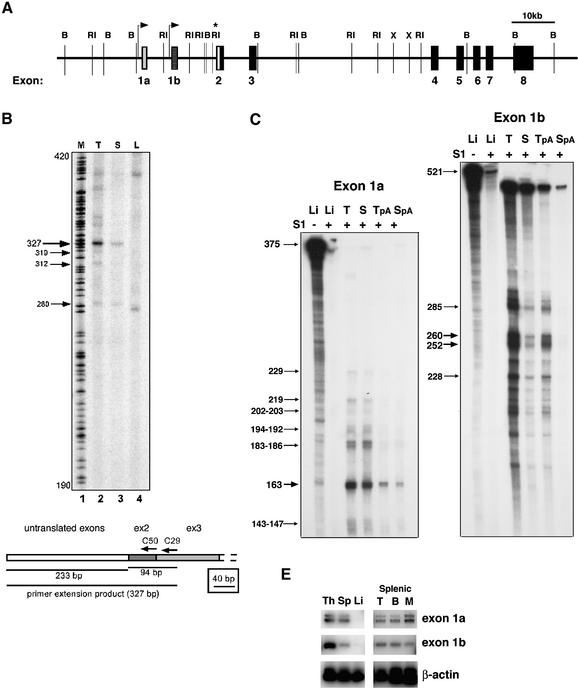
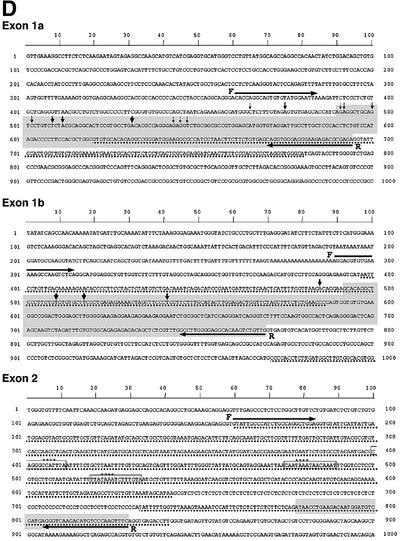
Our genomic organization studies on the Ikaros gene have determined that it spans ∼120 kb of DNA and consists of seven translated exons (Figure 1A, black boxes). To map the promoter region(s), we first analyzed the 5′ end of Ikaros mRNAs by primer extension and 5′ RACE (rapid amplification of cDNA ends) using primers from exons 2 and 3 (Figure 1B, C50 and C29). Primer extension gave a major product of 327 bp which was highly enriched in thymus, detectable in spleen but not detectable in liver mRNA (Figure 1B, using C50 from exon 2), thus reflecting Ikaros expression (or lack thereof) in these tissues. The size of the primer extension product shifted accordingly when a primer from exon 3 was used (C29, data not shown). A few less abundant primer extension products were also detected (Figure 1B). The 5′ ends of Ikaros mRNAs were cloned by 5′ RACE. Two types of 5′ RACE products were obtained, and the most full-length clones are shown on the Ikaros genomic sequences in Figure 1D. The first one consisted of exon 1a and the second one of exon 1b, each independently spliced to exon 2. The putative promoter regions upstream of exons 1a and 1b did not contain any TATA and CAAT box canonical promoter elements but were rather GC rich in composition, a feature that is common among some hemopoietic and lymphoid promoters. Areas of mouse–human conservation were identified within these regions and are shown in Figure 1D.
Fig. 1. Organization of the murine Ikaros locus and mapping of 5′ mRNA ends. (A) Genomic organization of the murine Ikaros locus. The horizontal line represents the locus in the 5′ to 3′ orientation. Vertical, short lines indicate BamHI (B) and EcoRI (RI) restriction sites. Translated exons are designated as black boxes, the untranslated region upstream of exon 2 is shown in white, and untranslated exons 1a and 1b are shown as grey and checked boxes, respectively. The arrows demarcate promoter regions in the locus. The asterisk indicates a highly conserved area between human and mouse upstream of exon 2. (B) Primer extension studies with poly(A) RNA from thymus (lane 2, T), spleen (lane 3, S) and liver (lane 4, L) and primer C50. A sequencing reaction in lane 1 serves as a marker (M). The predominant bands in thymus and spleen are at 327 bp. A cartoon diagram of the primer extension strategy is shown at the bottom. (C) S1 nuclease analysis for exons 1a and 1b was performed using total and poly(A)+ RNA from liver (Li), thymus (T, TpA) and spleen (S, SpA). In the first lane, an S1 nuclease (–) control is shown that provides the original probe length. The second lane shows S1 analysis with the non-expressing liver RNA. The protected fragments with thymus and spleen mRNA are shown by arrows and their sizes are provided. (D) Sequence analysis of genomic regions containing exon 1a, exon 1b and exon 2. The shaded box indicates the exon sequences corresponding to the longest 5′RACE product. The vertical arrows show the transcription start sites as determined in (C) and the size of the arrows indicates the frequency of their usage. The regions where the homology between human and mouse sequences are 80–98% are depicted with a dotted line. The primers used to generate the probes for S1 nuclease analysis are shown as F (forward) and R (reverse). CAAT box and TATA boxes are indicated in the upstream of exon 2. (E) RT–PCR analysis revealing lymphoid organ-specific utilization of exons 1a and 1b in Ikaros transcripts. PCR was performed on cDNA from wild-type thymus, spleen and liver (left blot), and from sorted splenic T, B and myeloid (M) subpopulations (right hand blot) using a 5′ primer within exon 1a or 1b and a 3′ primer within exon 2.
Sequence analysis of the area upstream of the first translated exon (exon 2) uncovered 618 bp of almost complete identity between mouse and human (Figure 1D, exon 2). Analysis of the conserved region for transcription factor-binding sites revealed the presence of TATA and CAAT boxes and the possibility of a canonical promoter. These basal promoter elements are located between 373 and 256 bp upstream of exon 2 and may also function in directing transcription initiation from a downstream site, bringing the number of putative promoters to three.
The ability of the three putative promoters to generate Ikaros transcripts was examined by S1 nuclease analysis on mRNA from thymus, spleen and liver using probes derived from genomic regions containing exon 1a, exon 1b and exon 2 (Figure 1C; data not shown). One major and several minor protected products were obtained using an exon 1a probe, indicating that in its vicinity several start sites were being utilized but at different frequencies (Figure 1C and D). Similar levels of the exon 1a-protected products were obtained with thymus and spleen mRNA, suggesting utilization of its upstream promoter in both differentiating and mature lymphocytes. Four major and several minor protected products were obtained with the exon 1b probe, again indicating the utilization of several start sites in this region. The level of exon 1b products was much higher in the thymus than in the spleen mRNA, suggesting a preferential utilization of this promoter by differentiating thymocytes. No protected product was obtained in the region of the putative third canonical promoter that lies 256 bp upstream of exon 2. This indicates either that it is not a promoter or that it is not utilized in the cell types tested in this assay.
The presence of Ikaros transcripts containing the untranslated exons 1a and 1b was also investigated by RT–PCR on RNA from thymus, spleen and liver, and purified T, B and myeloid cells from the spleen (Figure 1E). In agreement with the S1 results (Figure 1C), similar levels of exon 1a-containing RT–PCR products were detected in the thymus and spleen, whereas exon 1b products were far more abundant in the thymus than spleen. Among purified peripheral populations, a relative enrichment of the exon 1b RT–PCR product was detected in T and B cells, whereas exon 1a was detected at similar levels in all three purified populations.
These studies identify two promoter regions in the Ikaros locus that lie upstream of exons 1a and 1b. Although they are both active in cells of the B, T and myeloid lineages, the exon 1b promoter appears to be utilized preferentially by differentiating T cells and mature T and B cells. The activity of genomic regions containing these two promoters was examined further by expression studies in transgenic mice described in later sections (Figure 3).
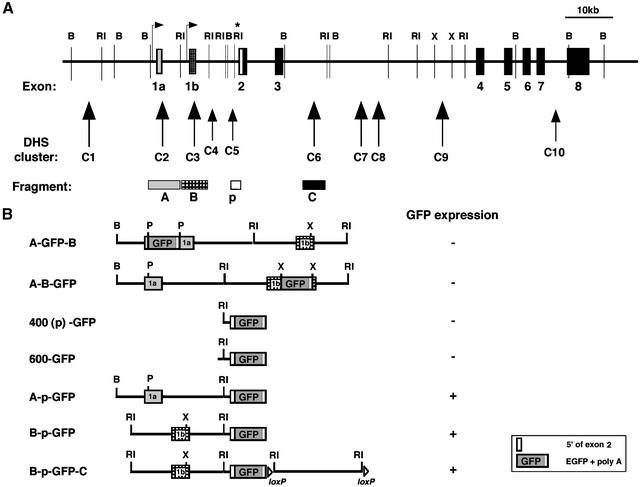
Fig. 3. Design of transgenic constructs. (A) Promoters and intronic regions [with associated DHS clusters (arrowheads)] in the Ikaros locus used in transgenic studies. (B) Cartoon diagram of transgenic constructs. 400(p)-GFP consists of: 442 bp of the conserved region upstream of exon 2 (p) with the splice acceptor site, 5′ end of exon 2 and the EGFP gene. 600-GFP consists of: 632 bp of the entire conserved region upstream of exon 2 with the splice acceptor site, the 5′ end of exon 2 and the EGFP gene. A-GFP-B is a DHS-C2 and -C3 genomic fragment with a EGFP gene inserted into a PstI site within exon 1a. A-B-GFP is a DHS-C2 and -C3 genomic fragment with a EGFP gene inserted into the XbaI site within exon 1b. A-p-GFP consists of a BamHI–EcoRI fragment containing the untranslated exon 1a and the neighboring DHS-C2 cluster, ligated to 400(p)-GFP. B-p-GFP consists of an EcoRI fragment containing exon 1b and the upstream DHS-C3 cluster, ligated to 400(p)-GFP. B-p-GFP-C contains the additional downstream EcoRI fragment, which contains the intronic DHS-C6 cluster flanked by loxP sites.
The Ikaros locus contains 10 clusters of tissue-specific DHS
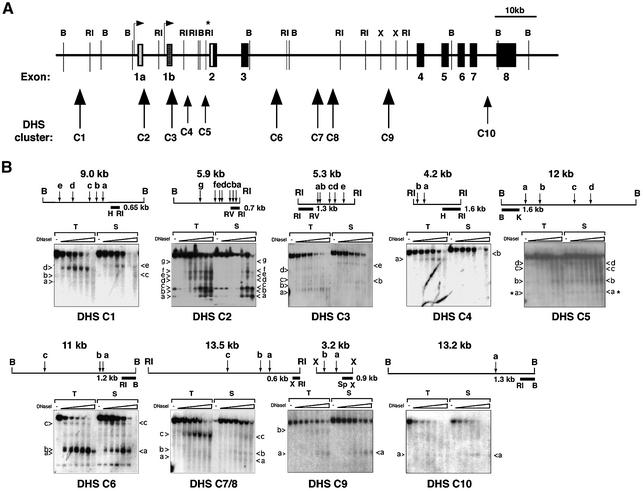
To locate regulatory elements outside the promoter regions which may influence cell type specificity and expression levels, we searched for tissue-specific DHS in the Ikaros genomic locus. DHS demarcate areas of accessible chromatin which are thought to represent the sites of action for cell type-specific nuclear proteins and remodeling complexes which regulate transcription at that locus. DNAs from thymic, splenic and liver nuclei were digested with increasing amounts of DNase I, purified, digested with appropriate restriction enzymes and analyzed by Southern blotting (Figure 2). Ten tissue-specific (detected in thymus and spleen but not liver) DHS clusters were identified (Figure 2); two of these lie in the vicinity of the promoter regions upstream of exons 1a and 1b (DHS-C2 and -C3, respectively), one is located further upstream (DHS-C1), two are upstream of exon 2 (DHS-C4 and -C5), four are in the intron between exons 3 and 4 (DHS-C6, -C7, -C8 and -C9), and a very weak site is found in the intron upstream of exon 8 (DHS-C10). Some of the DHS clusters are detected in both thymocytes and splenocytes (i.e. DHS-C2, -C5, -C6, -C9 and C-10), whereas others are more restricted to the thymus (i.e. DHS-C1, -C4 and -C7/8) (Table I).
Fig. 2. Mapping of lymphoid-specific DNase I-hypersensitive sites. (A) Diagram of the Ikaros locus with 10 DHS clusters each consisting of several individual sites. Large and small arrowheads indicate strong and weak DHS clusters, respectively. Restriction sites relevant to DHS mapping are shown, B, BamHI; RI, EcoRI; X, XbaI. (B) Autoradiographs of the DHS blots with a detailed map for each fragment together with the probe location. Each blot contains genomic DNA from thymus (T) and spleen (S). The alphabetical numbering of individual DHS bands is indicated by arrows next to the blot. All DHS bands indicated are unique for thymus and/or spleen and are not present in the liver (data not shown). H, HindIII; RV, EcoRV; K, KpnI; Sp, SpeI.
Table I. Cell type specificity of the Ikaros DHS clusters.
| DHS-C | C1 | C2 | C3 | C4 | C5 | C6 | C7/8 | C9 | C10 |
|---|---|---|---|---|---|---|---|---|---|
| Tissue specificity | T | T, S | T | T | T, S | T, S | T | T, S | T, S |
T, thymus; S, spleen.
The Ikaros DHS-C2 and DHS-C3 regions have distinct activities within the myeloid and lymphoid lineages
The putative Ikaros promoter regions upstream of exons 1a and 1b and their associated DHS clusters were examined for their ability to drive expression of an EGFP reporter in blood and lymphoid cell types. Initially, the EGFP reporter was placed within either exon 1a or exon 1b in an 11.5 kb genomic fragment that encompasses both of these regions (Figure 3B, A-GFP-B and A-B-GFP); no significant expression was detected in any blood or immune cell types with either of these two constructs (Table II).
Table II. Summary of expression in transgenic founder lines.
| No. of founders (Fo) | No. of GFP+ Fo in Sp or PB | Myeloid cells | B cells | T cells | |
|---|---|---|---|---|---|
| A-GFP-B | 4 | 0 | ND | ND | ND |
| A-B-GFP | 3 | 0 | ND | ND | ND |
| 400 (p)-GFP | 7 | 1 | +/– | +/– | +/– |
| 600-GFP | 12 | 0 | ND | ND | ND |
| A-p-GFP | 8 | 4a | + | – | – |
| B-p-GFP | 27 | 4b | + | + | +/– |
| B-p-GFP-C | 10 | 8c | + | + | + |
The number of founders obtained and the number of GFP-positive founders in either peripheral blood (PB) or spleen (Sp) are shown. The expression patterns in different cell types are indicated as + or –.
aExpression in granulocytes in different founder lines ranged from 2.9 to 31% (GFP+).
bExpression in B cells ranged from 1.4 to 94% and in granulocytes from 0.2 to 49%.
cExpression in B cells ranged from 1.5 to 94%, in granulocytes from 0.4 to 99%, and in T cells from 1.7 to 99%.
Taking into consideration that splicing to the first translated exon may increase the stability of the message generated by an expression cassette, we placed the EGFP reporter within the first Ikaros translated exon (upstream of the ATG), in a genomic fragment containing its splice acceptor and 442 or 632 bp of upstream sequences including the region of conservation between mouse and human [Figure 3B, 400(p)-GFP, 600-GFP; Table I]. These constructs were tested and found to display no significant activity on their own (Figure 3B; Table II). Only one out of 19 founders obtained with these cassettes expressed low levels of GFP in hemopoietic but also in non-hemopoietic cell types, which probably reflects the activity of some ubiquitous regulatory element at the site of integration.
The 400(p)-GFP construct was then combined with each one of the two fragments (A or B) which contain the putative promoter regions upstream of exons 1a or 1b and the associated DHS clusters (Figure 3B, A-p-GFP and B-p-GFP). Two series of transgenic lines were generated using these reporter constructs which displayed expression in myeloid and lymphoid cells in a significant number of founders (Figure 3B; Table II).
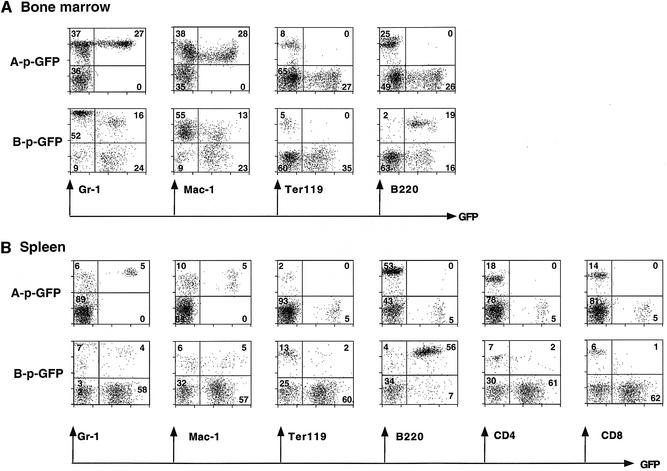
The A-p-GFP cassette was expressed in a subpopulation of cells of large size and complexity (high FSC/SSC) in the spleen and bone marrow in four out of eight transgenic lines generated (Table I, 0.3–4.8% of splenocytes and 0.8–27% of bone marrow cells). Staining with lineage-specific markers revealed that in both tissues these cells were granulocytes (Figure 4, A-p-GFP, Mac-1+/Gr-1+). Thus, the activity of the A-p-GFP regulatory cassette is largely confined to granulocytes and appears to be subject to position effect variegation (PEV). In the analysis of the A-p-GFP high expressing line shown in Figure 4A and B, 33–45% of granulocytes (Mac-1+/Gr-1+) in the bone marrow and spleen expressed the reporter. The remaining four out of the eight transgenic lines did not express the A-p-GFP reporter in any hemopoietic, lymphoid or other cell type.
Fig. 4. Expression of A-p-GFP and B-p-GFP in the myeloid and B-cell compartment. FACS profiles of bone marrow cells (A) and splenocytes (B) from the highest expressing A-p-GFP and B-p-GFP transgenic lines. Cells were stained with lineage-specific markers (Gr-1, Mac-1, Ter119, B220, CD4 and CD8) conjugated to R-PE. FACS profiles are shown with GFP on the x-axis and the lineage marker on the y-axis. The percentage of lineage+ and GFP+ cells is shown.
A different pattern of expression was obtained with the B-p-GFP cassette (Table II; Figure 4). In all four of the expressing B-p-GFP transgenic lines analyzed, the great majority of GFP+ cells were of the B lineage (B220+) in the spleen (89–98% of GFP+ cells) and bone marrow (54% of GFP+ cells). A smaller fraction of GFP+ cells were of myeloid origin (4.6–35.5% between spleen and bone marrow). Detailed analysis of the high expressing B-p-GFP line shown in Figure 4 shows that 90–93% of bone marrow and splenic B cells (B220+) and 19–45% of myeloid cells (most of these were Mac-1+/Gr-1–) were GFP+.
Thus the two genomic fragments which contain the promoter regions upstream of exons 1a and 1b and neighboring DHS-C2 and DHS-C3 appear to differ significantly in their ability to drive expression in the myeloid and lymphoid lineages. The activity of the first (A-p-GFP) is restricted to granulocytes, whereas the second (B-p-GFP) is predominantly active in B cells and in a smaller fraction of myeloid cells. Reporter activity in B cells is possibly associated with regulatory elements that lie within DHS-C3, but not DHS-C2. On the other hand, activity in granulocytes and other myeloid subsets is possibly the result of cell type-specific regulatory elements within both of these DHS clusters. Finally, both of these cassettes exhibit significant PEV within the expressing populations, indicating that critical regulatory elements which counteract the restrictive effects of heterochromatin on gene expression are absent (Festenstein and Kioussis, 2000).
The Ikaros DHS-C3 region is active in the early stages of T-cell differentiation
Although Ikaros is expressed in cells of the B and myeloid lineages, its highest expression levels are found in differentiating and mature T cells (Georgopoulos et al., 1997). In the context of the Ikaros locus, the identified promoters and their associated DHS are active in differentiating and mature T cells but they do not appear to be so in isolation. This indicates that additional regulatory elements are required to expand their activity in T cells.
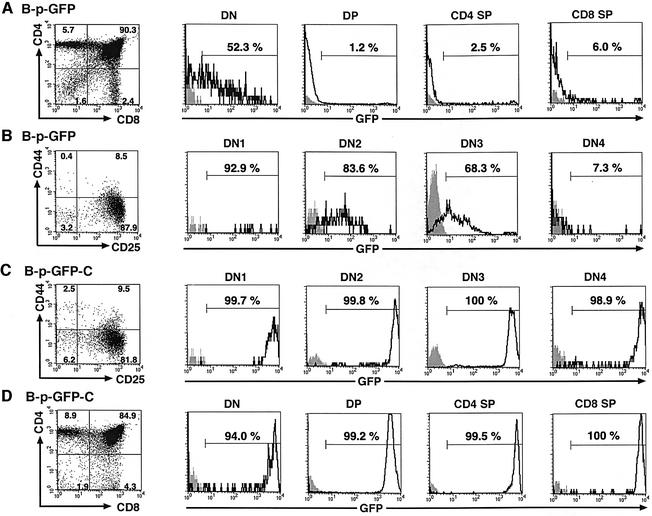
Further analysis of thymocyte populations in the B-p-GFP transgenic lines revealed activity in the majority of the double-negative (DN) population but not at the subsequent DP and SP stage of their differentiation. More precisely, 52% of the DN population was GFP+, whereas 1% of DP cells and 2.5–6% of SP cells were GFP+, respectively (Figure 5A, B-p-GFP). A similar analysis of the thymus of A-p-GFP mice revealed no expression in any of these subpopulations. The activity of the B-p-GFP cassette was examined further within the DN subpopulations. After gating out Lin+(TCβ+/CD4+/CD8+/Mac1+/Gr1+/Ter119+/B220+/TCRγδ+/NK1.1+) thymocytes, the remainder of the most immature population was analyzed for expression of CD44, CD25 and GFP. In the adult thymus, the majority of DN1 (CD44+/CD25–, 93%) and DN2 (CD44+/CD25+, 84%) cells were GFP+. A decline in the GFP-expressing population was observed at DN3 (CD44–/CD25+, 68%) which reached a minimum at the DN4 stage (CD44–/CD25–, 7%) (Figure 5B). Presumably, the DHS-C3 regulatory elements contained within the B-p-GFP expression cassette are sufficient for its activity in the early stages of T-cell development (DN1–DN3); however, additional regulatory elements that lie outside this region are required to maintain expression past the DN3 stage. Analysis of the DN thymocyte compartment in the fetal thymus of B-p-GFP mice gave similar results (data not shown).
Fig. 5. B-p-GFP and B-p-GFP-C display distinct activities during T-cell differentiation. (A and D) The CD4/CD8 profiles in the adult thymus of B-p-GFP and B-p-GFP-C transgenic lines were revealed using antibodies to CD4 and CD8 conjugated to Cy-Chrome and R-PE, respectively. Each subpopulation was analyzed for GFP expression relative to its counterpart in a non-transgenic control. Histograms from control and transgenic populations are shown, and the percentage of the population falling within the positive gate is indicated. (B and C) Expression of B-p-GFP (B) and B-p-GFP-C (C) in the double-negative thymic precursors in the adult thymus. After gating out Lin+(TCRβ+/CD4+/CD8+/Mac1+/Gr1+/Ter119+/B220+/TCRγδ+/NK1.1+) cells, thymocytes were subdivided further into DN1–DN4 using antibodies to CD44 (APC) and CD25 (R-PE) antigens. The DN1–DN4 subpopulations were analyzed further for GFP expression in transgenic and non-transgenic controls. Histograms for GFP expression are shown, and the percentage of the population falling within the positive gate is indicated.
The combination of Ikaros DHS-C3 and DHS-C6 regions sustains high levels of expression throughout T-cell differentiation
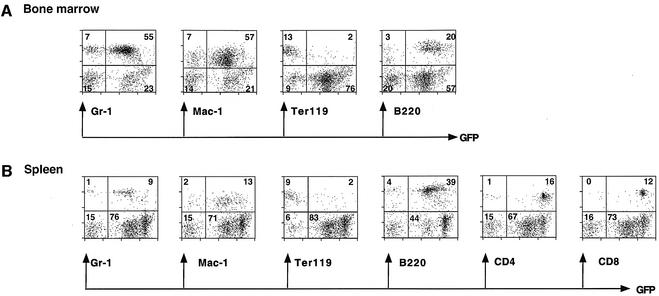
Of the remaining DHS clusters, DHS-C6 was prominently present in the majority of thymocytes and splenocytes (Figure 2), suggesting that it may have regulatory activities responsible for driving expression in these populations. DHS-C6 was tested in combination with DHS-C3 for its ability to extend expression to the T-cell lineage (Figure 3, B-p-GFP-C). Several effects were seen with this combination of regulatory elements: a greater number of expressing founders was obtained (Table I, eight out of 10), expression was extended from the most immature thymocytes to mature T cells, and PEV within the expressing myeloid population was decreased (Figure 6).
Fig. 6. Expression of B-p-GFP-C in all major hemopoietic subpopulations. Expression of the B-p-GFP-C transgenic lines in bone marrow and the spleen hemo-lymphoid populations. Lineage-specific markers are as described in Figure 4. The percentage of lineage+ and GFP+ cells is shown.
Analysis of thymocytes from the B-p-GFP-C transgenic lines indicated that the region containing DHS-C6 in combination with DHS-C3 maintained reporter activity past the DN3 stage of differentiation. The majority of the DN populations (DN1–DN4) were positive for GFP (Figure 5C). This is in sharp contrast to the B-p-GFP cassette, which gave very little expression past the DN3 stage of differentiation (Figure 5B). B-p-GFP-C activity was maintained through the majority of DP and SP thymocytes to peripheral T cells (Figures 5D and 6).
The majority of splenocytes in the B-p-GFP-C transgenic lines were also GFP+: 94% of CD4+ T cells, 99% of CD8+ T cells, 91% of B cells and 87–90% of myeloid cells (including granulocytes) (Figure 6B). Significantly, the level of expression in the T-cell compartment was ∼8-fold higher than in the B-cell and myeloid compartments (Figure 6A, compare GFP+: B220 versus CD4 or CD8), recapitulating the higher levels of endogenous Ikaros expression in the T versus the B and myeloid lineages (Morgan et al., 1997). In the bone marrow, the majority of B and myeloid cells were positive for GFP; however, only a small fraction of erythroid cells expressed the B-p-GFP-C reporter (Figure 6B). Thus, the expression pattern of the B-p-GFP-C cassette recapitulates the activity of the Ikaros locus, which is transcribed in the majority of lymphoid and myeloid cells and in a small fraction of primitive erythrocytes.
In addition to providing expression in differentiating and mature T cells, DHS-C6 also increased the number of expressing founders and decreased PEV, especially within the granulocyte population. A greater percentage of myeloid cells (especially granulocytes) in the B-p-GFP-C (0.4–99%) versus the B-p-GFP (0.2–45%) lines expressed GFP. For example, in the highest expressing B-p-GFP versus B-p-GFP-C transgenic lines, 45 versus 99% of the Mac-1+ populations were GFP+ (see Figures 4 and 6).
In contrast to the T-cell and myeloid populations, GFP expression in the B lineage remained unchanged in the presence of the DHS-C6 cluster. The range of bone marrow and splenic B cells that were GFP+ was similar among the B-p-GFP and B-p-GFP-C lines (Table I, 1.4–94% versus 1.5–94%). In both types of transgenic lines, GFP expression was detected from bone marrow pro-B cells (B220+/CD43+) to mature peripheral B cells (data not shown).
These studies indicate that a limited combination of regulatory elements associated with two of the DHS clusters present in the Ikaros locus is sufficient to provide expression in the lymphoid and myeloid lineages in a pattern that resembles that of the endogenous gene. It also provides some insight into the cell type specificity associated with these regulatory regions. Whereas the DHS-C2 cluster provides expression only in granulocytes, B cell- and myeloid- (but not granulocyte-) specific expression of Ikaros is provided by the DHS-C3 cluster, which lies in the vicinity of one of the promoters. The DHS-C3 region in combination with DHS-C6 provides expression in the majority of the myeloid compartment (including granulocytes). This combination of regulatory elements maintains activity past the DN3 stage (β-selection point) of thymocyte differentiation and provides high levels of activity in peripheral T cells.
Analysis of promoter usage in the Ikaros expression cassettes
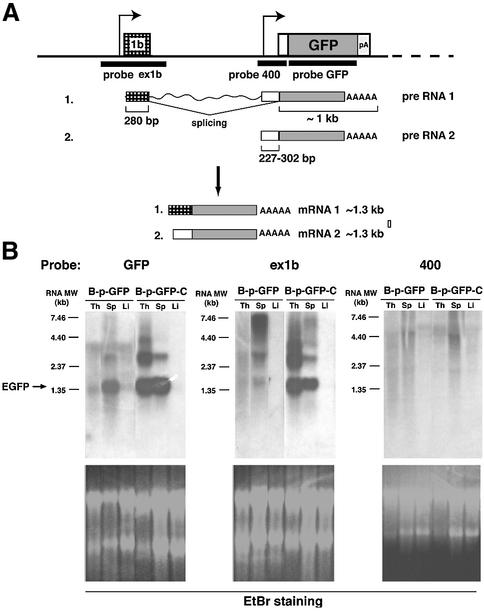
Promoter utilization in the B-p-GFP and B-p-GFP-C expression cassettes was examined by northern analysis of RNA generated from tissues of these transgenic lines. The possible utilization of two alternative promoters is depicted in Figure 7A and was explored with three probes spanning exon 1b, the region upstream of Ikaros exon 2 (400) and the EGFP-coding region, respectively. As shown in Figure 7B, EGFP mRNA was detected in the spleen, but not in the thymus, of a high-expressing B-p-GFP line, reflecting expression in the B-cell (and to a lesser extent the granulocyte) but not the T-cell populations in these tissues. The B-p-GFP-C transgenic line had high mRNA levels in both the thymus and spleen, recapitulating expression of GFP in the majority of cells in these tissues. Probes generated from exon 1b and the vicinity of exon 2 (400) regions were utilized in parallel hybridizations. The exon 1b probe gave a strong signal that co-migrated with that of the GFP probe. No significant hybridization was detected with exon 2 sequences, indicating that its putative upstream promoter was not utilized to any significant level by these expression cassettes. Thus, the promoter region upstream of exon 1b appears to be the dominant promoter in the B-p-GFP and B-p-GFP-C expression cassettes. Significantly, its activity appears to be significantly enhanced and cell type specificity expanded by the DHS-C6 cluster.
Fig. 7. Promoter usage in transgenic lines. (A) Two possibilities (1 and 2) for promoter usage on the B-p-GFP and B-p-GFP-C transgenes. The arrows indicate two possible transcription start sites on the transgene locus. The white box indicates the 5′ end of exon 2 excluding ATG. The probes are indicated below the transgenic construct. Messages transcribed from exon 1b, the conserved region upstream of exon 2 and the EGFP gene, respectively, are indicated as checked, white and shaded boxes, respectively. (B) Northern analysis using total RNA from B-p-GFP and B-p-GFP-C lines. The size of the EGFP message is indicated on the left side of the blots. Ethidium bromide staining of each agarose gel is shown below each blot. Exposure times: (bottom left-hand panel) B-p-GFP, 5 days; B-p-GFP-C, overnight; (bottom centre panel) B-p-GFP, 2 days; B-p-GFP-C, 1 day; (bottom right-hand panel) 3 days for both transgenes.
Using the Ikaros regulatory cassettes to demarcate T-cell versus B-cell areas in vivo
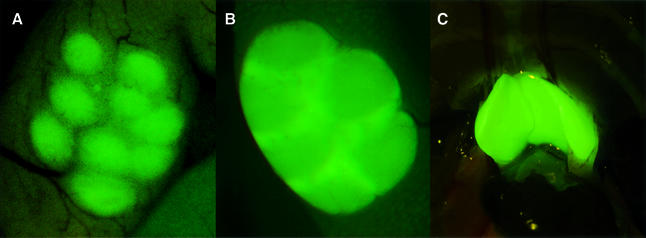
The ability of Ikaros–GFP reporters to demarcate in vivo lymphoid populations and the sites of their emergence and action were examined by fluorescence microscopy. No apparent staining was detected with the granulocyte-specific A-p-GFP lines at a microscopic level, possibly due to the small number of GFP+ cells present in the lymphatic tissues of these mice (data not shown). However, the higher expressing B-p-GFP and B-p-GFP-C lines exhibited prominent and distinct patterns of GFP staining in vivo in lymphatic centers. B-cell follicles in the lymph nodes were demarcated prominently in the B-p-GFP lines, while the T-cell zones remained negative (Figure 8A).
Fig. 8. Analysis of T and B cell-specific areas in B-p-GFP and B-p-GFP-C mice by fluorescence microscopy. (A) Peyer’s patch in the outer intestinal lining in the transgenic line B-p-GFP. Intense green staining marks B-cell follicles. (B) Peyer’s patch in the outer intestinal lining in the transgenic line B-p-GFP-C. The staining in the T-cell zone is more prominent than in the B-cell follicles. (C) Adult thymus of the transgenic line B-p-GFP-C.
In sharp contrast, in the B-p-GFP-C lines, T-cell zones showed the highest GFP activity, with B-cell follicles also staining, albeit at a much lower level (Figure 8B). The thymus was also strongly positive for GFP in the B-p-GFP-C line (Figure 8C). This appropriately reflects the expression level of the GFP in the T- and B-cell populations in these lymphoid tissues.
Discussion
We have shown previously that Ikaros is essential for development and homeostasis in the hemo-lymphoid system (Cortes et al., 1999; Georgopoulos, 2002). Mutations in the Ikaros gene that interfere with its normal expression cause a range of hematological disorders, including immunodeficiencies, leukemias and lymphomas. In this investigation, we seek to identify regulatory regions in the Ikaros genomic locus responsible for its activity during hemo-lymphopoiesis. On the one hand, we reveal a complexity in the number and cell type specificity of Ikaros regulatory elements which parallels the hemopoietic system’s requirements to regulate the expression of Ikaros tightly for normal differentiation and homeostasis. On the other hand, we show that a combination of just two of its regulatory domains, one that contains one of the promoter regions and a second that encompasses an intronic enhancer, is sufficient to recapitulate the expression of Ikaros across all major hemo-lymphoid lineages.
The Ikaros genomic locus spans ∼120 kb and is comprised of seven translated and three untranslated exons. A tissue-specific DHS approach has mapped 10 putative regulatory regions within the Ikaros locus that are distributed throughout the locus and are uniquely accessible in differentiating thymocytes and/or in splenocytes. Accessibility in these chromatin regions probably reflects the activity of developmentally regulated transcription factors which function by recruiting remodeling factors to potentiate transcription of Ikaros in the different cell types of the lymphoid and myeloid lineages. Some of these DHS active in lymphoid and myeloid cells may be also active earlier in their ontogeny, possibly in the pluripotent HSC and its immediate progeny.
Studies on the 5′ ends of Ikaros mRNA revealed differential utilization of two types of sequences; these are encoded by the untranslated exons 1a and 1b that are spliced independently to the first translated exon 2. This differential utilization of exons at the 5′ end of Ikaros mRNAs supports the presence of two upstream promoter regions, which lie in the vicinity of two DHS clusters (DHS-C2 and DHS-C3). Primer extension and S1 nuclease analysis confirmed the utilization of these promoters by the Ikaros locus. These Ikaros promoters are non-canonical with regards to TATA and CAAT box element composition, as is the case of other hemo-lymphoid-specific promoters. Sequence comparison between the mouse and human Ikaros genes revealed homology within these regions, suggesting the presence of conserved regulatory elements.
The activity of these promoter regions was investigated further in expression studies in transgenic mice. A genomic fragment containing DHS-C2 directed expression of an EGFP reporter in granulocytes. A second genomic fragment containing DHS-C3 gave expression throughout the B-cell lineage and in a smaller fraction of cells of myeloid origin. Transgenic lines generated with expression cassettes containing either the DHS-C2 or DHS-C3 promoter regions showed PEV in a fraction of the expressing cell types in the bone marrow and the spleen. Chromosomal translocation, inversion or transgenesis can bring a gene in proximity to heterochromatin and cause its ‘stochastic’ silencing in a proportion of cells that normally express it (Tartof et al., 1989; Henikoff, 1996). This variegating expression phenotype is referred to as PEV. Transgenic constructs frequently exhibit PEV as their regulatory regions are taken out of the context of their natural chromosomal location and separated from other elements, which may aid or mask their function. Locus control regions (LCRs) but also enhancer elements have been shown to counteract PEV by increasing their probability of being in an open chromatin configuration (Festenstein et al., 1996; Kioussis and Festenstein, 1997; Grosveld, 1999; Francastel et al., 2000).
Neither of the regulatory domains containing the two Ikaros promoter regions was active in mature T cells that normally express high levels of Ikaros, which are critical for their regulated proliferation and homeostasis. Regulatory elements associated with the DHS-C3 cluster were active in the majority of the DN thymic precursors; however, this activity was extinguished at the subsequent DP stage of the pathway, indicating a requirement for additional elements. However, when the intronic DHS-C6 was combined with DHS-C3, reporter activity was maintained in differentiating thymocytes and mature T cells. In the presence of the DHS-C6-containing regulatory region, expression in the great majority of DP and SP thymocytes and peripheral T cells was detected. Furthermore, expression in cells of the T lineage by this combination of regulatory elements was consistently an order of magnitude greater than in B and myeloid cell types, recapitulating expression of the endogenous Ikaros locus (Georgopoulos et al., 1997). In addition, the combination of DHS-C3 and -C6 clusters significantly increased the number of expressing founders relative to that detected with DHS-C3 alone. It also increased the proportion of expressing myeloid cells and especially granulocytes. However, in some transgenic lines, PEV among the lymphoid and myeloid populations was still evident with this combination of promoter and enhancer elements, indicating that critical LCR or enhancer elements were still missing. Such elements may be present in one or more of the additional clusters of DHS under investigation. Nonetheless, the DHS-C3 and DHS-C6 promoter and enhancer elements in combination display a cell type specificity in the expressing transgenic lines that closely resembles that of the endogenous Ikaros and provide reliable expression in their myelo-lymphoid compartment. This expression cassette is also active in bone marrow populations, which are enriched for cells with an HSC surface phenotype (T.Yoshida, unpublished results). Whether it is active within the long-term repopulating HSC compartment is under investigation.
Markers which can distinguish between stem cells, various multipotent and oligopotent progenitors, and lineage-restricted precursors are of paramount importance for stem cell biology. Given its early hemopoietic pattern of expression, Ikaros is an excellent candidate for dissecting the early hemopoietic hierarchy to probe its molecular regulation. The Ikaros expression cassettes under investigation here are comprised of subsets of its regulatory elements, which may allow us to mark and therefore distinguish between subsets of hemo-lymphoid cells. GFP reporters driven by these regulatory elements may also provide a way to address the ontogeny, migration properties of progenitors and precursors, and sites of action of their mature progeny in real time in the intact organism. These will also provide us with powerful tools to direct gene expression at stages of the hemopoietic system such as the HSC and the early myeloid and lymphoid progenitors and precursors, rare cell types that have been difficult to target thus far.
In this study, we provide a foundation for the regulation of Ikaros expression that appears to match the complexity of the function of Ikaros in hemo-lymphopoiesis. Delineation of the regulatory elements of Ikaros may provide us with insight into some of the molecular mechanisms that underlie the development of immune and hematological diseases.
Materials and methods
Cloning and mapping of the Ikaros locus
Two phage clones spanning exons 4–8 were obtained by screening a λ DASHII library. A P1 phage clone was obtained (Genome Systems, Inc., St Louis, MO) through hybridization to a 350 bp PCR fragment from the 5′ end of exon 4. The genomic sequences contained within the P1 clone spanned from ∼35 kb upstream of exon 2 to ∼5 kb downstream of exon 4. The two phage clones extended from exon 4 to 10 kb downstream of exon 8. P1 and phage DNA fragments resulting from EcoRI and/or BamHI digests were subcloned into pBluescript. The subcloned fragments were mapped using Southern blots of EcoRI, BamHI, KpnI and EcoRV single and double digests. The sequence assembly of murine and human Ikaros gene loci, and homology searches were performed using the Celera Discovery System database (http://www.celera.com).
Primer extension
Primer extension was performed as previously described (Ausubel et al., 1999) with a few modifications. Briefly, total RNA prepared from thymus, spleen and liver was poly(A)+ selected using the Oligotex procedure (QIAGEN). Then 1 × 10⁵ c.p.m. of a kinased and gel-purified oligo was precipitated with 7.5 µg of poly(A)+. The pellet was resuspended in 30 µl of 1× hybridization buffer (150 mM KCl, 10 mM Tris–HCl pH 8.3, 1 mM EDTA), incubated at 85°C for 10 min and then at 30°C for 12 h. After precipitation, primer extension products were reverse transcribed. Samples were analyzed on a 6% acrylamide–urea gel. As a size reference, a sequencing reaction was run next to the sample. C29 primer sequence: CCTTCATCTGGAGTGTCACTGACTG.
5′ RACE analysis
Primer C29 was hybridized to 7.5 µg of poly(A)+-selected RNA and reverse transcribed following the manufacturer’s instructions (5′ RACE System, Gibco-BRL). The resulting cDNA was 3′ tailed with dCTP using terminal deoxynucleotide transferase and amplified with the nested primer C50 and a poly(G)/adaptor primer. As a negative control, PCR was performed on cDNA template lacking the 3′ poly(C) tail. C50 primer sequence: CTGAAACTTGGGACATGTCTTG.
S1 nuclease protection assay
Genomic fragments containing exons 1a, 1b and 2 were cloned in the pCR2.1 vector (Invitrogen) by PCR amplification. Vectors were linearized with BamHI, and radiolabeled single-stranded antisense DNA probes were generated by PCR. S1 nuclease protection assay was performed using standard methods. Briefly, 50 µg of total RNA or 2 µg of poly(A)+ RNA from liver, thymus and spleen of Balb/c mice were hybridized with 2 × 10⁵ c.p.m. of probes. For digestion, 1000 U/ml of S1 nuclease (Ambion) was used. Protected bands were analyzed on a 4% acrylamide–urea gel with sequencing ladders as a molecular weight marker. Primer sequences used to clone exons 1a, 1b and 2 containing genomic fragments were as follows (5′ to 3′): exon 1a, forward CACC AGGCAGTGTGTATGGAATTA, reverse TCTCGCGCTTCTTCCCTC CCACCTG; exon 1b, forward GGAGGTGTGAAAAAGCCAAGTCT CA, reverse CAACAGACTTGTGCCTCCCCAAGGC; exon 2, cgcggg ggatccGTATTGCCCATCTGCCAGGCT, reverse GAAACTTGGGAC ATGTCTTGACCC.
RT–PCR
A 5 µg aliquot of total RNA from thymus, spleen and liver of C57BL/6 mice was reverse transcribed using random hexamers and Superscript II (Invitrogen) in a 25 µl reaction. A 1 µl aliquot of 4-fold diluted first strand cDNA was utilized for subsequent PCRs. To isolate T-cell, B-cell and myeloid populations, red blood cell-depleted splenocytes were stained with R-phycoerythrin (PE)–anti-Mac-1 (Caltag), fluorescein isothiocyanate (FITC)–anti-B220 (PharMingen) or FITC–anti-TCRβ (PharMingen) and sorted on a MoFlo cell sorter (Cytomation). RNA was isolated from equivalent cell numbers of the sorted populations (94–99% purity) using TRIzol reagent (Invitrogen) and used for RT–PCR analysis.
PCR was performed using a 5′ primer within exon 1a or 1b and a 3′ primer within exon 2. Primer sequences (5′ to 3′): exon 1a forward, GTGTGCACACAGGCCGGGATGGAA; exon 1b forward, GCACAG GCTCCCTTCCTGTGTGTG; exon 2 reverse, GAAACTTGGGACATG TCTTGACCCT. PCR conditions: initial denaturation for 5 min at 94°C, 30–35 cycles of 30 s at 94°C, 30 s at 56°C, 30 s at 72°C followed by 72°C for 8 min.
DNase I-hypersensitivity assays
Nuclei were isolated from splenic, thymic and liver single cell suspensions and treated with 0–20 U of DNase I (Sigma) as previously described (Wu, 1989). Briefly, DNA was isolated and digested with various restriction enzymes (EcoRI; BamHI; EcoRI–BamHI; XbaI), run on a 1% agarose gel and transferred onto Hybond N+ membrane (Amersham Life Science), which was probed with various genomic fragments (labeled using NEBlot kit, New England Biolabs) spanning the Ikaros locus.
Transgenic constructs
To generate the 400(p)-GFP construct, a genomic fragment beginning 427 bp upstream of exon 2 and ending 1 bp upstream of the start of translation (ATG) was PCR amplified and cloned into pEGFP-1 (Clontech). The genomic fragment in the 600-GFP construct encompasses the same region used to generate 400(p)-GFP but originates 190 bp upstream of the start of the 400(p)-GFP fragment. This longer fragment, containing the entire region of mouse–human homology upstream of exon 2, was PCR amplified and cloned into pEGFP-1 (Clontech).
To generate A-GFP-B, the EGFP gene from pEGFP-1 vector was introduced via the indicated PstI sites within exon 1a. For A-B-GFP, the EGFP gene was introduced into the XbaI site within exon 1b. The resulting two transgenic constructs were ∼16 kb in length and the major difference was the location of the EGFP reporter gene. To generate A-p-GFP, DHS-C2 (fragment A) was first subcloned into pBluescript II SK as a 5.9 kb BamHI–EcoRI fragment. Subsequently, 400(p)-GFP was cloned downstream of the DHS-C2 fragment. The B-p-GFP construct was generated in a similar fashion. DHS-C3 (fragment B) was first subcloned into pBluescript II KS as a 5 kb EcoRI fragment, and 400(p)-GFP was then cloned downstream of the DHS-C3 fragment.
DHS-C6 (fragment C) flanked by loxP sites was cloned 3′ of the B-p-GFP construct in order to obtain construct B-p-GFP-C.
All transgenic constructs were released from the vector backbone and purified before microinjection.
Generation of transgenic mice
Transgenic mice were generated by established methods. Briefly, fertilized (C57BL/6 × C3H) F1 oocytes were microinjected with various constructs. Transgenic chimeras were bred to C57BL/6 mice or (C57BL/6 × C3H) mice and maintained under specific pathogen-free condition. Mice were 4–8 weeks of age at the time of analysis.
Flow cytometric analysis
Cells from the thymus, spleen and bone marrow were prepared and analyzed for expression of surface differentiation antigens as described (Georgopoulos et al., 1994; Winandy et al., 1995). Flow cytometric analysis was performed using a FACScan flow cytometer (BD) or the high speed MoFlo sorter (Cytomation, Inc.). Various fluorochrome-conjugated antibodies were purchased from PharMingen or Caltag. GFP expression was detected directly under FITC laser settings.
Northern analysis
A 10 µg aliquot of total RNA isolated from thymus, spleen and liver of B-p-GFP and B-p-GFP-C transgenic mice was analyzed by northern blotting. The fragment used to generate probe ex1b was a 1.6 kb fragment encompassing exon 1b amplified by PCR using primers 5′RVtR10 (cgcggggatatcTCCCAAGACCATGTCCTG) and 3′BamHItR10 (cgcgg gggatccCCGGGACCTGAGATAC). The fragment used for the GFP probe was a 1.0 kb EGFP with poly(A)+ excised from the pEGFP-1 vector (Clontech). Fragment 400 was a 413 bp fragment generated by PCR amplification using primers UpEx2-F1 (gaattcTGTGCCTACAATGA GCCAGGG) and 3′Ex2Age-E1 (tttaccggtGTCTTCAGGTTATCTGAG).
Acknowledgments
Acknowledgements
We thank Shuwei Jiang and Joanne Yetz-Aldape for cell sorting, Taj Pathan for genotyping transgenic mice, and Bruce A.Morgan, Taku Naito and Joseph Koipally for valuable discussions. Research was supported by NIH 5R37 R01 AI33062 to K.G.
References
- Ausubel F.M., Brent,R., Kingston,R.E., Moore,D.D., Seidman,J.G., Smith,J.A. and Struhl,K. (1999) Current Protocols in Molecular Biology. Wiley Interscience, New York, NY.
- Avitahl N., Winandy,S., Friedrich,C., Jones,B., Ge,Y. and Georgopoulos,K. (1999) Ikaros sets thresholds for T cell activation and regulates chromosome propagation. Immunity, 10, 333–343. [DOI] [PubMed] [Google Scholar]
- Busslinger M., Nutt,S.L. and Rolink,A.G. (2000) Lineage commitment in lymphopoiesis. Curr. Opin. Immunol., 12, 151–158. [DOI] [PubMed] [Google Scholar]
- Cantor A.B. and Orkin,S.H. (2001) Hematopoietic development: a balancing act. Curr. Opin. Genet. Dev., 11, 513–519. [DOI] [PubMed] [Google Scholar]
- Cortes M., Wong,E., Koipally,J. and Georgopoulos,K. (1999) Control of lymphocyte development by the Ikaros gene family. Curr. Opin. Immunol., 11, 167–171. [DOI] [PubMed] [Google Scholar]
- Dumortier A., Kirstetter,P., Kastner,P. and Chan,S. (2002) Ikaros regulates neutrophil differentiation. Blood, 101, 2219–2226. [DOI] [PubMed] [Google Scholar]
- Festenstein R. and Kioussis,D. (2000) Locus control regions and epigenetic chromatin modifiers. Curr. Opin. Genet. Dev., 10, 199–203. [DOI] [PubMed] [Google Scholar]
- Festenstein R., Tolaini,M., Corbella,P., Mamalaki,C., Parrington,J., Fox,M., Miliou,A., Jones,M. and Kioussis,D. (1996) Locus control region function and heterochromatin-induced position effect variegation. Science, 271, 1123–1125. [DOI] [PubMed] [Google Scholar]
- Francastel C., Schubeler,D., Martin,D.I. and Groudine,M. (2000) Nuclear compartmentalization and gene activity. Nat. Rev. Mol. Cell Biol., 1, 137–143. [DOI] [PubMed] [Google Scholar]
- Georgopoulos K. (1997) Transcription factors required for lymphoid lineage commitment. Curr. Opin. Immunol., 9, 228–232. [DOI] [PubMed] [Google Scholar]
- Georgopoulos K. (2002) Haematopoietic cell-fate decisions, chromatin regulation and Ikaros. Nat. Rev. Immunol., 2, 162–174. [DOI] [PubMed] [Google Scholar]
- Georgopoulos K., Moore,D. and Derfler,B. (1992) Ikaros, an early lymphoid restricted transcription factor and a putative mediator for T cell commitment. Science, 258, 808–812. [DOI] [PubMed] [Google Scholar]
- Georgopoulos K., Bigby,M., Wang,J.-H., Molnár,Á., Wu,P., Winandy,S. and Sharpe,A. (1994) The Ikaros gene is required for the development of all lymphoid lineages. Cell, 79, 143–156. [DOI] [PubMed] [Google Scholar]
- Georgopoulos K., Winandy,S. and Avitahl,N. (1997) The role of the Ikaros gene in lymphocyte development and hemopoiesis. Annu. Rev. Immunol., 15, 155–176. [DOI] [PubMed] [Google Scholar]
- Grosveld F. (1999) Activation by locus control regions? Curr. Opin. Genet. Dev., 9, 152–157. [DOI] [PubMed] [Google Scholar]
- Harker N., Naito,T., Cortes,M., Hostert,A., Hirschberg,S., Tolaini,M., Roderick,K., Georgopoulos,K. and Kioussis,D. (2002) The CD8α gene locus is regulated by the Ikaros family of proteins. Mol. Cell, 10, 1403–1415. [DOI] [PubMed] [Google Scholar]
- Henikoff S. (1996) Dosage-dependent modification of position-effect variegation in Drosophila. BioEssays, 18, 401–409. [DOI] [PubMed] [Google Scholar]
- Kelley C.M., Ikeda,T., Koipally,J., Avitahl,N., Georgopoulos,K. and Morgan,B.A. (1998) Helios, a novel dimerization partner of Ikaros expressed in the earliest hematopoietic progenitors. Curr. Biol., 8, 508–515. [DOI] [PubMed] [Google Scholar]
- Kioussis D. and Festenstein,R. (1997) Locus control regions: overcoming heterochromatin-induced gene inactivation in mammals. Curr. Opin. Genet. Dev., 7, 614–619. [DOI] [PubMed] [Google Scholar]
- Klug C.A., Morrison,S.J., Masek,M., Hahm,K., Smale,S.T. and Weissman,I.L. (1998) Hematopoietic stem cells and lymphoid progenitors express different Ikaros isoforms and Ikaros is localized to heterochromatin in immature lymphocytes. Proc. Natl Acad. Sci. USA, 95, 657–662. [DOI] [PMC free article] [PubMed] [Google Scholar]
- Morgan B., Sun,L., Avitahl,N., Andrikopoulos,K., Gonzales,E., Nichogiannopoulou,A., Wu,P., Neben,S. and Georgopoulos,K. (1997) Aiolos, a lymphoid restricted transcription factor that interacts with Ikaros to regulate lymphocyte differentiation. EMBO J., 16, 2004–2013. [DOI] [PMC free article] [PubMed] [Google Scholar]
- Nichogiannopoulou N., Trevisan,M., Naben,S., Friedrich,C. and Georgopoulos,K. (1999) Defects in hemopoietic stem cell activity in Ikaros mutant mice. J. Exp. Med., 190, 1201–1214. [DOI] [PMC free article] [PubMed] [Google Scholar]
- Tartof K.D., Bishop,C., Jones,M., Hobbs,C.A. and Locke,J. (1989) Towards an understanding of position effect variegation. Dev. Genet., 10, 162–176. [DOI] [PubMed] [Google Scholar]
- Wang J., Nichogiannopoulou,A., Wu,L., Sun,L., Sharpe,A., Bigby,M. and Georgopoulos,K. (1996) Selective defects in the development of the fetal and adult lymphoid system in mice with an Ikaros null mutation. Immunity, 5, 537–549. [DOI] [PubMed] [Google Scholar]
- Winandy S., Wu,P. and Georgopoulos,K. (1995) A dominant mutation in the Ikaros gene leads to rapid development of leukemia and lymphoma. Cell, 83, 289–299. [DOI] [PubMed] [Google Scholar]
- Winandy S., Wu,L., Wang,J.H. and Georgopoulos,K. (1999) Pre-TCR and TCR controlled checkpoints in T cell differentiation are set by Ikaros. J. Exp. Med., 190, 1039–1048. [DOI] [PMC free article] [PubMed] [Google Scholar]
- Wu C. (1989) Analysis of hypersensitive sites in chromatin. Methods Enzymol., 170, 269–289. [DOI] [PubMed] [Google Scholar]


