Abstract
The National Retail Data Monitor (NRDM) has monitored over-the-counter (OTC) medication sales in the United States since December 2002. The NRDM collects data from over 18,600 retail stores and processes over 0.6 million sales records per day. This paper describes key architectural features that we have found necessary for a data utility component in a national biosurveillance system. These elements include event-driven architecture to provide analyses of data in near real time, multiple levels of caching to improve query response time, high availability through the use of clustered servers, scalable data storage through the use of storage area networks and a web-service function for interoperation with affiliated systems.
The methods and architectural principles are relevant to the design of any production data utility for public health surveillance—systems that collect data from multiple sources in near real time for use by analytic programs and user interfaces that have substantial requirements for time-series data aggregated in multiple dimensions.
INTRODUCTION
The National Retail Data Monitor (NRDM) is a public health surveillance tool that collects and analyzes over-the-counter healthcare product sales from eight large retail chains that sell over-the-counter (OTC) medications These chains own 18,600 retail stores across the country. The NRDM has over 540 users in 47 states.1, 2 Studies of sales of OTC medications during outbreaks demonstrate that monitoring OTC sales can provide timely detection of disease outbreaks.3–5
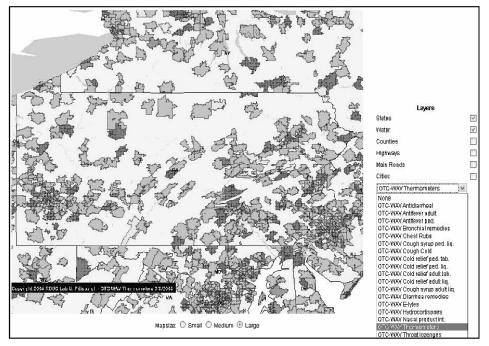
The NRDM includes a data collection system that receives data from the data warehouses of retail chains. The data are daily counts of sales by individual product and are sent in batches at a frequency that is typically daily but as frequent as every two hours. The NRDM also comprises routines for data aggregation and storage, detection algorithms that monitor for abnormal sales patterns, and web-based user interfaces that display aggregated counts by product categories on maps and timelines, as shown in Figure 1. Detailed descriptions of the data elements, data collection components, analysis, and user interfaces are available in previous publications 1, 2.
Figure 1.
User interface for the National Retail Data Monitor showing the sales of cough and cold products in Pennsylvania on March, 7 2005.
We have made several major improvements to the NRDM since our last publication. These improvements include the use of an event-driven processing model, a new hardware architecture to improve availability and scalability, an efficient cache system, and an API for other surveillance systems that need to retrieve data from the NRDM.
Event-driven processing refers to an architecture in which the arrival of a data file from a retailer triggers maximal analysis of the data. We use the term ‘maximal’ rather than complete because of the nature of analysis in biosurveillance using daily count data. The NRDM, like other biosurveillance systems, analyzes data geospatially. To do this, data from most or all (depending on the analysis) stores in a region, which could be as small as a zip code or as large as the entire U.S—must be available. Since data from different retailers arrive at different times of day, the previous clock-driven architecture waited until 3 pm before aggregating and analyzing data. For sales data that arrived early in the day, this architecture introduced a significant delay from the ultimate goal of real-time surveillance.
In the event-driven NRDM, when a data file is received, the counts for each aggregate geographic area (zip code, county, and state) are incremented. The degree of completeness of reporting for each aggregate area is tracked and made available in the user interfaces and to detection algorithms, which can then analyze those regions whose data are complete or make decisions about the tradeoff between analyzing partial counts and waiting.
The new hardware architecture includes scalable data storage and clustered servers. The storage requirements of a national data utility for OTC sales are large because of the number of stores, products, views of the data, and a requirement to produce time series of daily counts going back multiple years. The requirement was not only for an expandable data storage capability, but also one that did not require any downtime for expansion. The requirement for zero downtime for maintenance also applied to the server hardware.
As mentioned above, data analysis in biosurveillance is heavily oriented around the analysis of time series. The typical query from an end user might request six 2-year time series. As an end user explores surveillance data, this type of query could be repeated dozens of times. As the size of the database grew, the response times for such queries became unacceptable. We addressed this performance issue using multiple caches.
To enhance NRDM interoperability, we developed a new API, which is designed to allow biosurveillance systems located in cities and states to access time-series data stored in the NRDM through web services (e.g., ebXML (www.ebxml.org) or SOAP over HTTPS). This functionality complements existing NRDM functions that generate and transmit comma-delimited files to public health users authorized to access the data. The new API is a web-service interface to the data for the communication between two machines. Web services are a standard technology that the CDC’s Public Health Information Network (PHIN) has advocated. To our knowledge, this is the first web service to provide public health surveillance data nationally.
METHODS
This section provides technical detail about the software and hardware described in the Introduction.
Event Driven Processing
Event Manager
The NRDM collects data files from eight retail chains on a daily basis or every two hours, depending on the capabilities of the vendors’ data systems. Vendors may push data to NRDM file server (six vendors) or the NRDM may pull data from the vendor’s file system (two vendors). The daily batch data contain previous day’s sales records, whereas the batch data received every two hours contain the same day sales records.
Every hour, the NRDM event manager checks for availability of a new data file located in NRDM file server or a vendor’s file server. If new data are available and all previous processing tasks are complete, the event manager loads and transforms the data (see Figure 2). After the data are loaded into a transactional database and transformed to our standard format (e.g., transform a vendor’s native store IDs to a unique store identifier across all the vendors), the system performs data warehousing tasks. Finally, the data are loaded into our cache system and made available to detection algorithms, web-based user interfaces, and web services. Figure 3 summarizes the data flow of the NRDM—from data acquisition to application.
Figure 2.
Process flow of the NRDM event manager.
Figure 3.
NRDM data flow.
Data Loading and Transformation
We use the Oracle data loading tool, SQL*Loader, to load comma separated data files into the NRDM. Each record in the data file comprises a Universal Product Code (UPC), promotion flag, product unit counts, and store ID. Previously, we used Java Database Connectivity (JDBC) for the data loading process. The current approach increased the data loading speed five fold. After loading a file into a database, procedures translate each vendor’s store ID to a unique store ID and classify each UPC into a unique product category.
During data transformation, NRDM recognizes any new stores reporting to the system. When a new store is encountered, the system automatically adds it to the database and records the date when it first became active.
Stores can also close and become inactive. When a retailer reports a closure, we manually change the store’s status to inactive and record the date of closure. Not all retailers report store closures. For this reason, we run a program each quarter that determines which stores have not reported any sales. We then send the list of the suspected closed stores to the retailers for confirmation.
Each time a data file is processed the system updates its tables of reporting completeness for the day. There is a binary record for every unique store that indicates the appearance of sales data from that store for the day. Each store is mapped to a zip code, county, and state so that we can calculate reporting completeness for any region as
To illustrate the variability in reporting time we evaluated store reporting completeness in the Commonwealth of Pennsylvania based on the time of data availability from the retailers. The period of this study was January 11, 2005 to March 10, 2005 (described in Results).
Data Warehousing
NRDM uses Oracle9i as a transactional database and data warehouse. To provide aggregate counts reports, i.e., OLAP (drilldown or rollup) queries, we use two multi-dimensional data cubes (also known as materialized views.)
Previously, we used a single data cube for ‘zip-code and higher’ aggregated counts. We now have an additional cube for store-level aggregate counts. The ‘zip-code level and higher’ data cube provides regional sales counts with the following dimensions: date of purchase, product category (18 categories), promotion flag (Yes, No, or Unknown), and geographic region (zip code, county, or state level). This cube supports, for example, a query for one year of non-promotional daily sales on adult cough tablets in zip code 15217.
The new store-level data cube provides store level aggregate counts. It has the following dimensions: date of purchase, product category, promotion flag, and store unique identifier. With this data cube, a user may run for example a query for one year of daily sales on adult cough tablets for Store #11021972.
Addressing Performance Using a Cache System
To provide faster query responses, we developed a cache system that provides two levels of caching—data caching and image caching.
Data Caching
The data cache retrieves counts from the data warehouse and stores them as time series in a MySQL database (www.mysql.com), an open-source database. We chose MySQL as the solution for data caching primarily because it allows us to keep an entire database in memory. To boost query performance, we store an entire year of data for a single geographic region and product category in a single database field. We accomplish this using Huffman compression6. To provide both non-promotional and total sales data in one query (often used in NRDM web interface), we compress two time series into one record—one with the total sales (regardless of promotion flags) and the other with non-promotional sales. For example, one compressed record in the MySQL database contains 730 counts for two time series. Each geographic region (zip code, county, or state) has one record per year in the MySQL database.
Whenever a data file is received from a retailer and stored in the data warehouse, the data cache becomes out of date. To manage this issue, we developed a cache updater. After a data warehouse update, the NRDM event manager runs the cache updater to update the cache.
We evaluated the query performance of the data cache by comparing query time against our existing Oracle data warehouse. For five states (PA, NJ, OH, UT and CA) we executed two different queries—one query for one week of data (November 1 to November 7, 2004) and another query for one month of data (January 1 to January 31, 2004). We executed a total of 10 queries multiple times and recorded the average time to obtain performance measurements. In addition, we measured how much space each system used to store the data.
Image Caching
The most common service request to the NRDM from the web user interface is a request for a graph of time-series data. To provide faster access to graphs of time series plots (in the form of PNG images), we developed a second cache using OSCache (www.opensymphony.com/oscache), an open source J2EE (java.sun.com/j2ee) implementation of the JCache standard that can cache images in memory and disk (if memory size is limited). If the same query has been made more than once by the same or different users, the system will return the images of time series plots already stored in this cache to the user without querying the data cache again.
Hardware Upgrades
To address data storage scalability and server availability we acquired a storage area network (SAN) and clustered database system. We purchased an EMC CLARiion CX300 SAN device with 1 terabyte of data storage. A single CX300 can accommodate up to 8 terabytes of disk space and can be upgraded while the servers are running.
We upgraded our database which now runs on a two-node cluster (two physical servers). This design allows us to drastically decrease service downtime. If one node is not available, the other one takes over. Each node is a Dell PowerEdge 2650 server running Red Hat Linux Advanced Server 3. Each node is configured with two 2.4GHz Pentium 4 processors and 4 gigabytes of RAM.
We also upgraded our algorithm server to a Sun Fire V20z, configured with 4 gigabytes of RAM and, two 64-bit AMD Opteron processors. This server runs outbreak detection algorithms for the NRDM.
Web Services
To address interoperability between the NRDM and other public health surveillance systems, we built a SOAP web service that adheres to CDC PHIN standards (www.cdc.gov/phin) for data exchange. SOAP is a lightweight protocol for data exchange in XML format.7 The web service is secured through the HTTPS protocol and we wrote the necessary authentication modules for access control. This web service provides a lightweight API for machine-to-machine communications and allows other surveillance systems to retrieve OTC data directly from the NRDM.
RESULTS
Time to Data Completeness
An important goal of the NRDM is to obtain and analyze OTC data in real time.
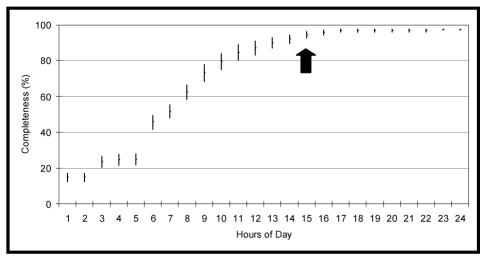
Figure 5 shows the rate at which data become complete over the course of a reporting day in Pennsylvania for the period Jan. 11, 2005 to March 10, 2005 (total 59 days). Note that reporting day is the day after individual stores close out their sales for a day and report sales figures to the parent company’s data center. The middle point within each vertical bar is the average completeness and the bars are the 95% confidence intervals. More than 60% of stores reported their data by 8 a.m. By 10 a.m., about 80% of stores’ data are available. By 1 p.m., over 90% of stores reported data.
Figure 5.
Hourly store reporting completeness in Pennsylvania. The arrow shows the time (3pm) when the previous clock-driven NRDM processed OTC data.
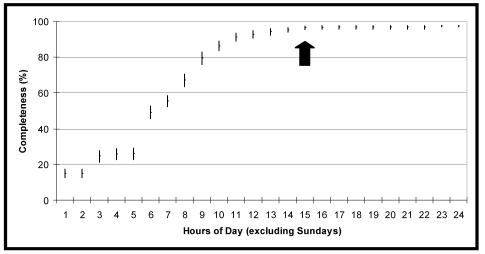
Since retailers usually report data late on Sundays, we also computed the completeness excluding Sundays as shown in Figure 6. After we exclude Sundays, the completeness reaches more than 90% by 11 a.m.
Figure 6.
Hourly store reporting completeness in Pennsylvania (excluding Sundays). The arrow shows the time (3pm) when the previous clock-driven NRDM processed OTC data.
Comparison of Cache and Data Warehouse
Database query time using the cache system is at least 10 times faster than querying the data warehouse (Table 1). In addition, the storage requirement of the cache approach is an order of magnitude smaller.
Table 1.
Comparison of Query Performance and database size between the Cache System and the Oracle Data Warehouse
| Ave. run time for retrieving last 7 days of data (seconds) | Ave. run time for retrieving last 30 days of data (seconds) | Size of database | |
|---|---|---|---|
| Cache System | 0.2 | 0.2 | 650MB |
| Oracle Data Warehouse | 2.4 | 3.8 | 7.6G |
DISCUSSION
The most important requirements of any data utility functioning in the domain of public health surveillance is minimizing the time lag between the recording of surveillance data and its availability for epidemiological analysis. This requirement motivates the new event-driven processing architecture of the NRDM. The new model allows the NRDM to process data as early as midnight—15 hours earlier than the previous clock-driven model. Our evaluation shows that for one state (Pennsylvania) data completeness ranges between 80 and 90% by noon. One concrete benefit of the new design is that epidemiologists have available surveillance data from the previous day when they arrive at work in the morning rather than when they are getting ready to go home in the evening.
One result of the evaluation of time-to-completeness was that it is rare that every store reports on a given day. We asked retailers why some stores do not report data. A typical response was that some stores are small convenience stores in gas stations that only carry a very limited amount of healthcare products that we are interested in. We also suspect that some stores like all computer systems are liable to data transmission problems.
Although data warehousing is an industry-standard solution to high volume data retrieval applications, we discovered that data warehouses alone could not support even a modest load of queries that are heavily time-series oriented. Although we will continue to rely on database managements systems for persistent storage, we are moving away from hard-disk-based warehousing and towards memory-based caching.
Although the NRDM provides user interfaces and basic analytics, the NRDM has never been conceived of as a stand alone, siloed system, but rather a data utility whose core function is a data layer function; that is, bringing together and regularizing data from retailers and serving those data to users in either raw or analyzed form. With the development of the NRDM web service, this serving of data is now extended to other applications For example, the current version of the RODS biosurveillance system (RODS version 3.2) has the capability of connecting directly to the NRDM web service. The RODS installation in Tarrant County, TX (serving Dallas-Fort Worth), for example, currently retrieves OTC data directly from NRDM in this manner. When a user in Tarrant County requests both OTC and emergency department (ED) registration graphs at once on the local RODS web interface8, the graphs of OTC data are generated at the NRDM server in Pittsburgh and the graphs of ED registration data are generated at the Tarrant County RODS server.
The NRDM is an example of a public health data utility—an entity that collects surveillance data from multiple providers, analyzes the data, and is highly available. The requirements and technical solutions of the NRDM are those of any national data utility in public health surveillance. They also apply to the future and ongoing design of systems intended to collect laboratory, veterinary or other biosurveillance data from large regions. It is through this data utility model that public health data will become more widely available so that outbreaks can be detected earlier and with greater accuracy.
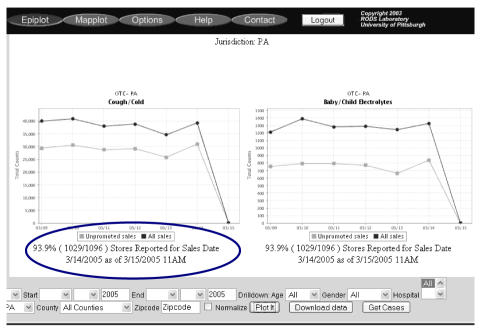
Figure 4.
Store reporting completeness on the NRDM web interface.
ACKNOWLEDGEMENTS
This work was supported by Pennsylvania Department of Health Award number ME-01-737, Grant F 30602-01-2-0550 from the Defense Advanced Research Projects Agency, Contract 290-00-0009 from the Agency for Healthcare Research and Quality, and Grant T15 LM/DE07059 from the National Library of Medicine, and a grant from the Alfred P Sloan Foundation. The authors also thank Steve DeFranscesco and Feng Dong for building the cluster system and the SAN devices.
REFERENCES
- 1.Wagner MM, Tsui FC, Espino J, Hogan W, Hutman J, Hersh J, et al. National Retail Data Monitor for public health surveillance. MMWR Morb Mortal Wkly Rep. 2004;53 (Suppl):40–2. [PubMed] [Google Scholar]
- 2.Wagner MM, Robinson JM, Tsui FC, Espino JU, Hogan WR. Design of a national retail data monitor for public health surveillance. J Am Med Inform Assoc. 2003;10(5):409–18. doi: 10.1197/jamia.M1357. [DOI] [PMC free article] [PubMed] [Google Scholar]
- 3.Hogan WR, Tsui FC, Ivanov O, Gesteland PH, Grannis S, Overhage JM, et al. Detection of pediatric respiratory and diarrheal outbreaks from sales of over-the-counter electrolyte products. J Am Med Inform Assoc. 2003;10(6):555–62. doi: 10.1197/jamia.M1377. [DOI] [PMC free article] [PubMed] [Google Scholar]
- 4.Mac Kenzie WR, Hoxie NJ, Proctor ME, Gradus MS, Blair KA, Peterson DE, et al. A massive outbreak in Milwaukee of cryptosporidium infection transmitted through the public water supply. N Engl J Med. 1994;331(3):161–7. doi: 10.1056/NEJM199407213310304. [DOI] [PubMed] [Google Scholar]
- 5.Stirling R, Aramini J, Ellis A, Lim G, Meyers R, Fleury M, et al. Waterborne cryptosporidiosis outbreak, North Battleford, Saskatchewan, Spring 2001. Can Commun Dis Rep. 2001;27(22):185–92. [PubMed] [Google Scholar]
- 6.Sedgewick R. Algorithms in C: Addison-Wesley Publishing Co.; 1990.
- 7.Box D, Ehnebuske D, Kakivaya G, Layman A, Mendelsohn N, Nielsen HF, et al. Simple Object Access Protocol (SOAP) 1.1 [online] 2000 [cited 2005 3/14/2005]. Available from: http://www.w3.org/TR/2000/NOTE-SOAP-20000508/#_Toc478383486
- 8.Tsui FC, Espino JU, Dato VM, Gesteland PH, Hutman J, Wagner MM. Technical description of RODS: a real-time public health surveillance system. J Am Med Inform Assoc. 2003;10(5):399–408. doi: 10.1197/jamia.M1345. [DOI] [PMC free article] [PubMed] [Google Scholar]


