Abstract
SaTScan™ is a popular, free software tool used to identify disease clusters early in the course of an outbreak.1 Using geographic and time-based surveillance data, SaTScan can generate large datasets that are difficult for humans to interpret. Tracing disease clusters through space and time using text tables is a challenging cognitive task. To simplify this process, we developed a Java-based open-source tool to transform SaTScan analytic datasets into easily navigable data visualizations.
INTRODUCTION
Syndromic (statistical) surveillance uses early indicators of disease to identify outbreaks before definitive diagnoses are made. Operationally, researchers, epidemiologists and other public health personnel must perform an often cumbersome and time-consuming daily process of processing and reviewing thousands of individual cases for events of public health significance. SaTScan is a free software program that analyzes geospatial surveillance data using Kulldorff’s scan statistic for spatial, temporal and space-time cluster detection.2 This statistic is arguably the most widely used method in the public health arena to detect disease clusters.3
SaTScan produces ASCII flat file data containing cluster locations, cluster size, test statistics, cluster rankings based on test statistics, and individual cases mapped to each cluster. Because clusters can span both space and time, raw table-based data can be difficult to interpret and visualize. Data visualization tools can aid analysts who must interpret complex data sets, because humans must ultimately determine which events require further investigation.
Although general geographical information systems (GIS) visualization tools and proposed methods for visualizing surveillance data exist,4 we aren’t aware of tools specifically tailored to perform SaTScan data visualization. Consequently, creating SaTScan visualizations requires parsing, cleaning and formatting the data for use in one of many GIS applications. Further, graphically representing distinct features such as cluster radius size, individual cases, statistical significance, and ordered rankings requires building proprietary functionality into the GIS application.
METHODS
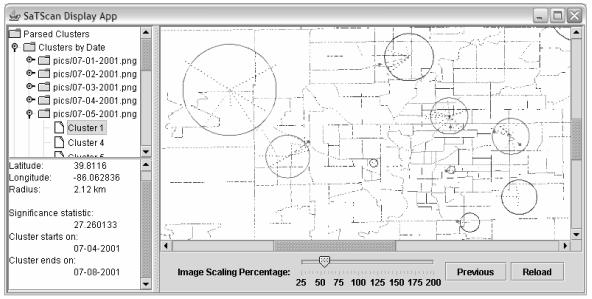
We developed a tool using the Java Development Kit 1.4.2 to visually review disease trends and outbreaks reflected in SaTScan surveillance data. Raw cluster statistics are linked to each graphical cluster. Census tract boundaries provide geographical reference. Cluster regions are placed in proper relationship to the census tracts and are color-coded based on the statistical test metric: clusters of greater statistical significance (small p-values) are given configurable “hot” colors ranging from red to yellow. Clusters of lesser significance are assigned “cooler” colors ranging from dark green to violet. Rays emanating from the cluster centroid clearly show associations between cluster regions and individual cases. Additionally, by combining multiple views we generate animations to review temporal evolution of the data.
RESULTS
Reviewing and managing surveillance data poses a complex challenge to public health. Using thoughtful visualization aids will help public health officials, epidemiologists and researchers more efficiently identify and trace outbreaks of potential public health significance.
Figure 1.
Screen of SaTScan data visualization tool. Cluster regions are represented by circles, individual cases are rays from the cluster centroid. Raw data for each cluster is contained in the left pane.
References
- 1.Kulldorf, M. (2005). SaTScan 5.1 [Computer program]. Boston, MA: Harvard Medical School and Harvard Pilgrim Health Care. (http://www.satscan.org)
- 2.Kulldorff M, Nagarwalla N. Spatial disease clusters: Detection and Inference. Statistics in Medicine. 1995;14:799–810. doi: 10.1002/sim.4780140809. [DOI] [PubMed] [Google Scholar]
- 3.Anselin, L. Review of Cluster Analysis Software. North American Association of Central Cancer Registries, 2004. (#2003-04-01)
- 4.Boscoe FP, McLaughlin C, Schymura MJ, Kielb CL. Visualization of the spatial scan statistic using nested circles. Health and Place. 2003 Sep;9(3):273–277. doi: 10.1016/s1353-8292(02)00060-6. [DOI] [PubMed] [Google Scholar]


