Abstract
An iterative computational scientific discovery approach is proposed and applied to gene expression data for resectable lung adenocarcinoma patients1. We use genes learned from the C5.0 rule induction algorithm2,3, clinical features and prior knowledge derived from a network of interacting genes as represented in a database obtained with PathwayAssist™4 to discover markers for prognosis in the gene expression data1. This is done in an iterative fashion with machine learning techniques seeding the prior knowledge. This research illustrates the utility of combining signaling networks and machine learning techniques to produce simple prognostic classifiers.
Introduction
An iterative computational scientific discovery approach is proposed and applied to the problem of discovering simple prognostic classifiers for lung adenocarcinoma using gene expression data, clinical features and prior knowledge. Computational scientific discovery involves the development of computational models that describe, explain and predict system behavior. This approach is multidisciplinary, incorporating knowledge of computational methods and scientific disciplines5.
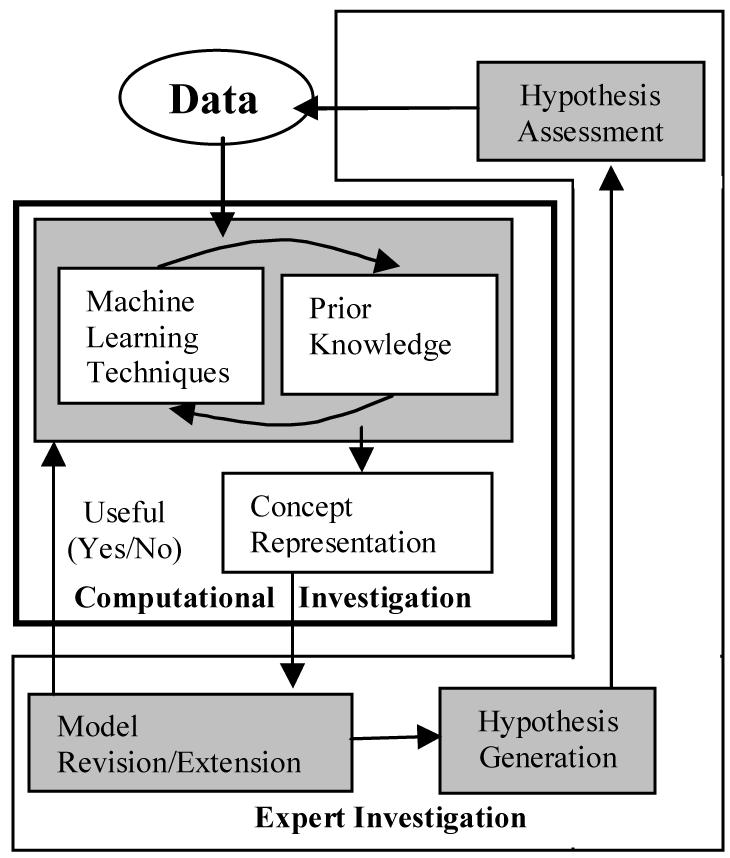
In this paper, computations scientific discovery is viewed as an iterative model generation process (see Figure 1). Machine learning techniques are combined with prior knowledge to overcome limits of small sample size, large feature sets and noisy data. Machine learning techniques are applied to the data set to develop a concept representation. The concept representation can be used by an expert for model revision/extension.
Figure 1.

Iterative Computational Scientific Discovery.
Iterative computational scientific discovery is intended to narrow the gap between model development and experimental validation. If the hypothesis assessment is positive the techniques and model development can move to more computationally complex and data demanding methods. This paper focuses on the computational investigation component. This process is described in relation to developing a concept representation for lung cancer prognosis through a series of iterative steps using the C5.0 decision tree classifier, clinical features, gene expression microarray data and PathwayAssist™4 generated networks of genes.
Prior Knowledge: PathwayAssist™4
For the purposes of this investigation, prior knowledge is any information about lung cancer that can be used in machine learning techniques to enhance the concept representation. Here we use signaling networks as our prior knowledge. The prior knowledge is obtained from PathwayAssist™4, which automatically extracts this knowledge from Medline by using natural language processing procedures6. This generates the protein function information which is used to generate graphs of links between genes. The links between genes are based on scientific articles supporting the relationships. The resulting network is viewed as prior knowledge because edges are machine curated links between genes with articles supporting the links.
Prior knowledge is viewed here as a means of directing the classifier using known relationships between genes. Using prior knowledge in conjunction with classifiers has been shown to improve classification in generated data sets7. Combined prior knowledge and machine learning techniques have been applied to knowledge discovery in ontologies and integrated into transcriptome analysis8. These approaches suggest ways in which prior knowledge can be used to explore the area in the feature space covered by pre-existing knowledge. It also provides a way to overcome the limitations of microarray data where the size of the sample tends to be small relative to the number of features. This is done with filtering, a machine learning technique by which a subset of the features in the data set is selected by a predetermined criterion. Filtering has been used effectively as a means of learning concepts from data sets with many irrelevant features9. The goal of filtering is to eliminate irrelevant and weakly relevant features leaving only strongly relevant features for generating models10. This is particularly important when the number of features is large. Different types of tests and algorithms are used for filtering such as exhaustive subset searches11, feature weighting12 and decision trees13, 14.
Concept Representation
The concept representation is a data structure that conveys knowledge about the system and often has typical forms in machine learning (i.e., rules, clusters, hyperplanes, etc.). The concept representations that are derived by the machine learning techniques need to be well motivated and useful. The assessment of usefulness is if the representation can be used to revise current models used in the field. The revised model is in turn judged on the hypotheses it generates. The discovery process iterates until a useful concept representation is generated or the computational investigation is stopped.
Hypothesis Generation
The validity of the modeling approach depends upon its ability to generate hypotheses that an expert judges as useful. Quantifying model usefulness and validity are areas of future research. If the concept representation can be used to revise/extend an existing model, then the concept representation is useful. If it cannot, then the computational investigation iterates using more data or different techniques until a representation is found that can revise/extend an existing model.
The revised model is then used for hypothesis generation. An expert through a hypothesis assessment step evaluates these hypotheses. The revised model is used to motivate new experiments, which generate new data. This in turn is fed to machine learning algorithms and the computational investigation starts anew with more data.
Induction Method: C5.02,3
C5.02,3 is a top down induction algorithm that is used to generate a decision tree model to classify data. C5.0 builds a decision tree choosing an attribute that best separates the classes in the data. This is recursively performed on the partitions until partitions only have a single class in them or the partition becomes too small. This results in a decision tree with the features with higher partitioning ability being toward the root and classification occurring at the leaves.
The iterative submission of the data to C5.0 and the prior knowledge network is used as a filtering method. For each iteration, the data are fed into a filtering method, which reduces the number of features.
Methods
Data
Beer et al. 1 published a set of gene expression profiles for 86 patients with resectable lung adenocarcinoma. We used the data as filtered and normalized by the authors. It consisted of 4996 Affymetrix HuGeneFL Chip gene expression attributes and eleven clinical attributes. The clinical attributes were age, gender, tumor size (T) and lymph node involvement (N) status, stage of disease as per the current American Joint Commission on Cancer specified algorithm based on T, N, and metastasis (M) status, and histopathological subtype of adenocarcinoma, histopathological grade of the tumor, smoking history, survival, p53 mutation status and K-ras mutation status15. The last two are tests that confirm if there are mutations in the p53 or K-ras genes respectively. The vast majority of attributes are continuous with very few nominal attributes.
Sixty-one of the 86 lung adenocarcinoma patients that were profiled by Beer et al. 1 were divided into high and low risk groups based on survival. We selected 30.1 months as breakpoint for the analysis based upon a minimum in prediction error for that survival time. The median survival time is 29.5 months. High-risk patients were dead of disease at or before 30.1 months; low risk patients survived beyond this time interval. This resulted in 19 high risk and 42 low risk patients with 25 patients removed due to insufficient follow-up. Forty-eight (78%) patients had Stage I disease and thirteen (22%) patients had Stage III disease at diagnosis. There are no Stage II patients in the data set.
Iterations
C5.0 is run in an iterative fashion to improve the concept representation generated by combining induction and prior knowledge.
▪ First C5.0 is run using only genes to predict risk. This is to establish a comparative baseline (Genes Only run).
▪ Second, clinical information features, as discussed earlier, are included in a second run. (Clinical & Genes run).
▪ Next, genes that are implicated in the second run are used to seed a prior knowledge network obtained with PathwayAssist™4. Genes that are directly linked in the network to the genes from the second run are selected for the third run of C5.0. This is to assess if prior knowledge contributes useful information (Clinical & Prior Knowledge Genes run).
▪ The final run uses features that are implicated in the third run. (Clinical & Pathway Prior Knowledge Genes run).
Results
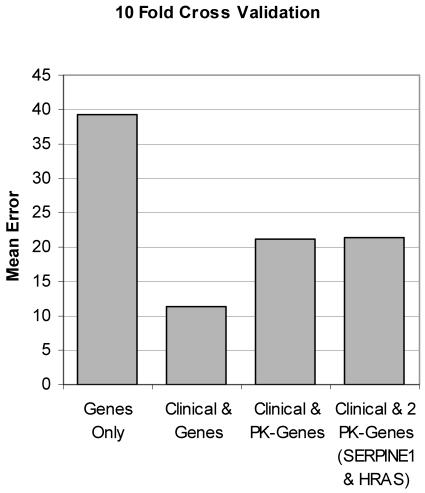
As expected, submitting the Beer et al.1 data to C5.0 using only genes causes the classifier to over fit the data resulting in 10-fold cross-validation mean error of 39.3% with standard error of 7.9%. The second run using clinical features and genes improves upon the genes only run with a 10-fold mean error of 11.4% and a standard error of 4.3%.
The following Clinical & Genes classifier occurs 5 out 10 times for the 10-fold cross-validation. The decision tree representation has STAGE at the root with the genes TMSB4X and WINT5A as leaf nodes. The tree shows for STAGE equal to 1 and TMSB4X less than 10145.5 there are six (the number in parenthesis) HIGH risk patients. When TMSB4X is below 10145.5 the classifier predicts that 37 patients are LOW risk, one of the patients was incorrectly classified (the number after the slash in the parenthesis gives the number of incorrectly classified patients).
Clinical & Genes Classifier
STAGE = 1:
:...TMSB4X <= 10145.5: High (6)
: TMSB4X > 10145.5: Low (37/1)
STAGE = 3:
:...WNT5A <= 262.4: High (10)
WNT5A > 262.4: Low (2)
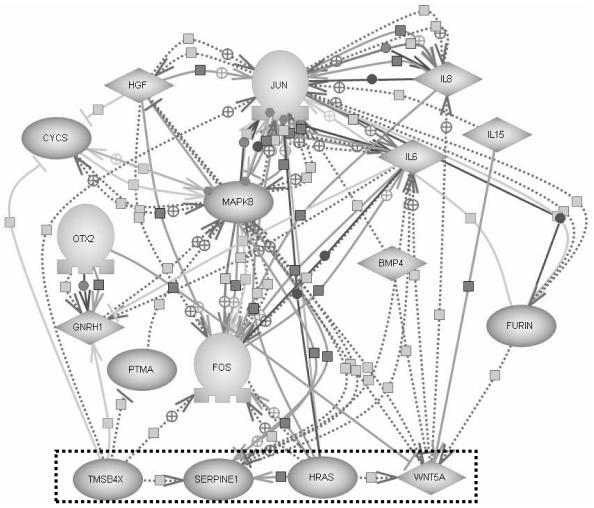
Next, prior knowledge in PathwayAssist™4 is used to generate a graph of connections through proteins between TMSB4X and WNT5A (Figure 2).
Figure 2.
PathwayAssist™4 graph for paths between TMSB4X and WNT5A filtered for proteins only.
As illustrated in Figure 2, PathwayAssist™4 representation can be quite complex. Each edge represents a relationship between genes, which is supported by published papers. This can be viewed as a concept representation in the iterative computational scientific discovery process.
One of the goals of concept representation is to motivate experiments. The complexity of the concept representation expressed in Figure 2 can be reduced by running another iteration.
The problem is that good predictor genes, such as TMSB4X and WNT5A, if left in the feature set will tend to be selected as predictor genes. To explore the predictability of other related genes, these good predictor genes need to be removed from the feature set. In this next iteration, feature selection using prior knowledge is performed by using only genes that are one-link away (i.e., one-off genes) from TMSB4X and WNT5A.
Table 1 lists the genes that are prior knowledge one-off genes. These will be used to replace the TMSB4X and WNT5A.
Table 1.
presents the genes that are prior knowledge one-off genes for TMSB4X and WNT5A.
| TMSB4X | WNT5A |
|---|---|
| One off genes whose gene names are in HuGeneFL: PTMA, JUN, SERPINE1, FOS | One off genes whose gene names are in HuGeneFL: MAPK8, HRAS, BMP4, IL6, IL8, IL15 |
SERPINE1 and HRAS are leaves in the most common classifier occurring 5 out of 10 times in the 10-fold cross-validation with a mean error of 21.2% and a standard error of 2.3%. The below classifier is one example.
Clinical & Prior Knowledge one-off Genes Classifier
STAGE = 1:
:...SERPINE1 > 1442.7: High (5/1)
SERPINE1 <= 1442.7:
:...HRAS <= 124.5: High (2)
HRAS > 124.5: Low (36/1)
STAGE = 3: High (12/2)
This classifier is of interest in that it is on a shortest path between TMSB4X and WNT5A on the PathwayAssist™4 graph (see Figure 3). This shortest path is linked by published papers16, 17, 18.
Figure 3.
Sub-section, from Figure 2, of relevant relationships from PathwayAssist™4 graph.
With SERPINE1 and HRAS in the most common classifier, these two genes along with clinical values are submitted to C5.0. Not surprisingly the same classifier is the most common (i.e. 5 out of 10) in 10-fold cross-validation with an error of 21.4% and standard error of 3.6%
Clinical SERPINE1 & HRAS Classifier
STAGE = 1:
:...SERPINE1 > 1928: High (3)
SERPINE1 <= 1928:
:...HRAS <= 140.2: High (4/1)
HRAS > 140.2:
:...p53nuclAccum = −: Low (31)
p53nuclAccum = +:
:...Krasmutation = +: High (2)
Krasmutation = −: Low (3)
STAGE = 3: High (11/2)
Remarkably, a rare variant (occurring once) includes two new clinical factors in the classifier: p53 nuclear accumulation and k-ras mutation. This relates the genes to clinically relevant features. Together they do a good job at predicting high and low risk cases for STAGE I cancers in this data set.
For a comparison, the Mean Error percentages are plotted against each other in Figure 4. The prior knowledge classifiers did not perform as well as the clinical & genes classifier, but their features were selected on prior knowledge alone.
Figure 4.
Mean Error comparison plotted against four iterative runs. PK-Genes corresponds to the genes selected using prior knowledge. The right most column uses only two prior knowledge genes, SERPINE1 and HRAS.
Discussion
The implication is that TMSB4X is good at predicting STAGE 1 risk because it correctly predicts many of the same patients that SERPINE1 and HRAS predict (data not shown). These in turn are related to the clinically relevant markers p53 nuclear accumulation and k-ras mutations for this data set. The conceptual representation in Figure 3 along with the decision tree classifiers start moving the original results closer to explanatory models.
The Iterative Computational Scientific Discovery approach supplies a framework in which concept representations progress toward explanatory models. The Expert Investigation components of Hypothesis Generation and Assessment are not addressed in this paper which was primarily focused on the Computation Investigation component. Future work includes generalizing the prior knowledge approach and classifiers on other lung cancer data sets.
Conclusion
Prior knowledge combined with models derived from data can be used to hypothesize new markers for known lung cancer related genes.
In conclusion, this research demonstrates the utility of combining prior knowledge and machine learning techniques to produce a simple classifier for modeling prognosis of lung cancer. A process of iterative model building using computational scientific discovery is proposed in this paper. Further work is needed to validate the relevance of these genes and clinical markers to modeling lung cancer prognosis in the general case.
Acknowledgement
L.J.F. is supported by a fellowship from the National Library of Medicine (5T15LM007450).
This work was supported in part by a National Institute of Health (NLM) grant (1R01LM008000) to M.E.E and by funds from the Office of Research at Vanderbilt University Medical Center.
References
- 1.Beer DG, Kardia SL, Huang CC, Giordano TJ, Levin A, Misek DE, et al. Gene-expression profiles predict survival of patients with lung adenocarcinoma. Nature Medicine. 2002;8:816–824. doi: 10.1038/nm733. [DOI] [PubMed] [Google Scholar]
- 2.Quinlan JR. Induction of decision trees. Machine Learning. 1987;1:81–106. [Google Scholar]
- 3.Quinlan JR 1993. C4.5: Programs for Machine Learning. San Francisco. Morgan Kaufmann. URL: http://quinlan.com
- 4.PathwayAssistTM URL: http://www.ariadnegenomics.com/products/pathway.html
- 5.Langley, P. (2002). Lessons for the Computational Discovery of Scientific Knowledge. In Proceedings of the First International Workshop on Data Mining Lessons Learned (DMLL ‘2002).
- 6.Brisson, L., Collard, M., Le Brigand, K., & Barbry, P. (2004).KTA: A Framework for Integrating Expert Knowledge and Experiment Memory in Transcriptome Analysis. http://olp.dfki.de/pkdd04/barbry-final.pdf
- 7.Ortega, J. & Fisher, D. (1995). Flexibly exploiting prior knowledge in empirical learning. In the Proceedings of the International Joint Conference on Artificial Intelligence (pp. 1041–1047). Morgan Kaufmann, San Francisco.
- 8.Daraselia N, Yuryev A, Egorov S, Novichkova S, Nikitin A, Mazo I. Extracting human protein interactions from MEDLINE using a full-sentence parser. Bioinformatics. 2004;20(5):604–611. doi: 10.1093/bioinformatics/btg452. [DOI] [PubMed] [Google Scholar]
- 9.Aluallim H, Dietterich TG. Learning Boolean concepts in the presence of many irrelevant features. Artificial Intelligence. 1994;69(1–2):279–306. [Google Scholar]
- 10.Kohavi R, John GH. Wrappers for Feature Subset Selection. Artificial Intelligence. 1997;97(1–2):273–324. [Google Scholar]
- 11.Aluallim, H., & Dietterich, T.G. (1991). Learning with many irrelevant features, Proceedings, Ninth National Conference on Artificial Intelligence, Anaheim, CA. AAAI Press/The MIT Press (pp. 547–552).
- 12.Kira, K. & Rendell, L.A. (1992). The feature selection problem: Traditional methods and a new algorithm, in Tenth National Conference on Artificial Intelligence, MIT Press (pp. 129–134).
- 13.Cardie, C. (1993). Using decision trees to improve case-based learning, in Proceedings of the Tenth International Conference on Machine Learning (pp. 25–32).
- 14.Frey, L., Fisher, D., Tsamardinos, I. Aliferis, C. F. & Statnikov, A. (2003). Identifying Markov Blankets with Decision Tree Induction. In the Proceedings of the Third IEEE International Conference on Data Mining (pp. 59–66).
- 15.Rusch, V. (2002). Chapter 19: Lung. In F. Greene, D. Page, I. Fleming, A. Fritz, C. Balch, D. Haller, and M. Morrow (Eds.). AJCC Cancer Staging Manual 6th ed (pp. 167–177). New York. Springer-Verlag.
- 16.Bui TD, Tortora G, Ciardiello F, Harris A. Expression of Wnt5a is downregulated by extracellular matrix and mutated c-Ha-ras in the human mammary epithelial cell line MCF-10A. Biochemical and Biophysical Research Communications. 1997;239:911–917. doi: 10.1006/bbrc.1997.7530. [DOI] [PubMed] [Google Scholar]
- 17.Al-Nedawi KNI, Czyz M, Bednarek R, Szemraj J, Swiatkowska M, Cierniewska-Cieslak A, et al. Thymosin 4 induces the synthesis of plasminogen activator inhibitor 1 in cultured endothelial cells and increases its extracellular expression. Blood. 2004;103(4):1319–1324. doi: 10.1182/blood-2003-04-1015. [DOI] [PubMed] [Google Scholar]
- 18.Yamamoto H, Atsuchi N, Tanaka H, Ogawa W, Abe M, Takeshita A, Ueno H. Separate roles for H-Ras and Rac in signaling by transforming growth factor (TGF)- Eur. J. Biochem. 1999;264:110–119. doi: 10.1046/j.1432-1327.1999.00584.x. [DOI] [PubMed] [Google Scholar]


