Abstract
A general model for the contractility of cells is presented that accounts for the dynamic reorganization of the cytoskeleton. The model is motivated by three key biochemical processes: (i) an activation signal that triggers actin polymerization and myosin phosphorylation, (ii) the tension-dependent assembly of the actin and myosin into stress fibers, and (iii) the cross-bridge cycling between the actin and myosin filaments that generates the tension. Simple relations are proposed to model these coupled phenomena and a continuum model developed for simulating cell contractility. The model is capable of predicting key experimentally established characteristics including: (i) the decrease in the forces generated by the cell with increasing substrate compliance, (ii) the influence of cell shape and boundary conditions on the development of structural anisotropy, and (iii) the high concentration of the stress fibers at the focal adhesions. We present numerical examples of a square cell on four supports to demonstrate these capabilities.
Keywords: cell adhesion, cytoskeleton, stress fibers, mechano-sensitivity, self-assembly
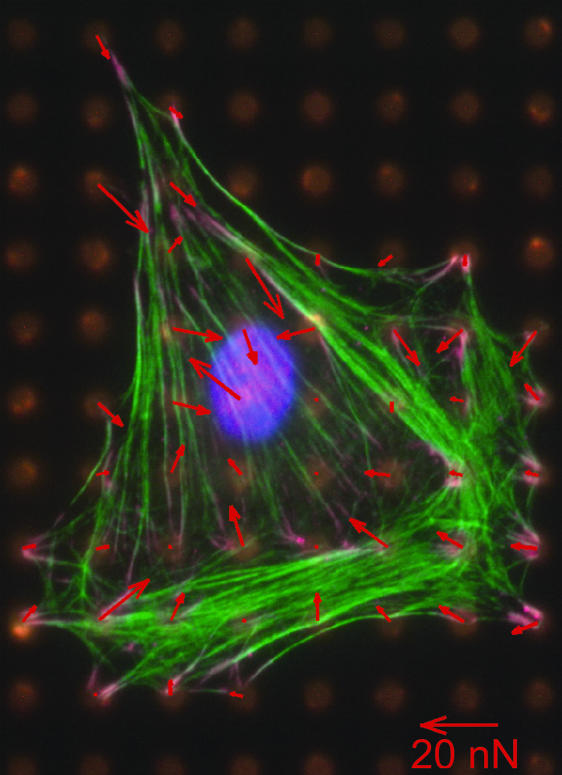
This article presents a general model for cell contractility motivated by recent observations of the forces exerted by mammalian cells on a compliant substrate (Fig. 1), in which spatial correlations are sought between the force vectors acting on the substrate and the organization of visible stress fibers. The forces are obtained by placing the cell on an array of microneedles (1) and the stress fibers revealed by subsequent application of an actin-staining procedure. It is apparent from this (and numerous other) images that many of the force vectors are inclined to the axis of the visible fiber bundles. Indeed, some are almost normal to the bundles and, often, the largest vectors are present at locations where no visible stress fibers exist. The implication is that the forces are induced by fibers on a much finer scale, not revealed by the staining procedures. A corollary is that a contractility model capable of characterizing the forces should emerge from continuum level considerations, rather than from ensembles of discrete fibers. The intent of this article is to present a continuum model for the evolution of the cytoskeletal structure and demonstrate its consistency with key features found in experiments.
Fig. 1.
Measurement of contractile forces in a fibroblast cell on a bed of microneedles. The actin fibers are stained in green. The arrows show the deflection of the posts, with the lengths of the arrows proportional to the force exerted by the cell on the posts. There seems little correlation between the orientations of the visible stress fibers and the directions of the force vectors (figure courtesy of C. Chen, University of Pennsylvania, Philadelphia, PA).
Previous attempts at developing models for the cytoskeletal network in stationary cells (that is, neglecting cell spreading and motility) have taken the perspective that the cytoskeleton is an interlinked structure of passive filaments (2, 3). When included, cell contractility has been modeled by simply prescribing a thermal strain to either a cell otherwise regarded as an isotropic elastic continuum (4) or a discrete set of elastic filaments representing the stress fibers (5). Such models neglect the biochemistry of the active apparatus of the cell that generates, supports, and responds to mechanical forces. A biochemically motivated model for contractility is developed in this article.
A generalized model must be capable of characterizing the basic interactions among the forces, the assembly and dissolution of stress fibers, and the compliance of the substrate. Moreover, once calibrated, it must explain such effects as the strong influence of substrate compliance on the forces, and the dependence on cell size of the forces exerted at its periphery, as well as the influence of cell shape and boundary conditions on the orientations of the fibers. It will be demonstrated that the present model is capable of addressing all of these effects. At this initial stage, incorporation of focal adhesions is deliberately avoided. Instead, the boundaries of the cells are connected to rigid supports through elastic springs. This exclusion allows a straightforward formulation capable of replicating several important features found in cells. Focal adhesions will be incorporated at a later stage.
Summary of Key Biochemical Processes
To devise a mechanical model, the biochemical processes occurring in the cell must link with the formation and dissociation of the stress fibers, as well as the associated generation of tension and contractility. However, the precise details of the biochemical processes are as yet not well understood. The model presented here does not depend on the details of the biochemical processes, rather we use the current limited understanding of the biochemical processes and develop a modeling framework that can be appropriately modified as and when these biochemical processes are better understood. Here, we thus merely summarize the basic processes that motivate the model; readers may refer to ref. 6 for further details.
In the suspended or resting state, the binding proteins or integrins are dispersed over the cell surface (and may be attached to some actin filaments). The short actin filaments in the cytoplasm are surrounded by a pool of actin monomers bound to profilin. Myosin II exists in the bent state in which the tail domain interacts with the motor head. The formation of stress fibers in the cell is triggered by an activation signal in the form of either a nervous impulse or an external signal. Several parallel intracellular pathways are involved. For example, adhesion to the extracellular matrix triggers a signaling pathway that induces the activity of profilin, cofilin, and gelsolin. In turn, this process activates phospholipase C, which hydrolyses phosphatidylinositol bisphosphate and stimulates the release of Ca2+ from the endoplasmic reticulum. The influx of Ca2+ activates gelsolin, which cleaves the capped actin filaments into tiny fragments. The large numbers of free ends generated in this manner are rapidly elongated by the monomeric actin pool, forming many long filaments, some cross-linked with filamin and some bundled by α-actinin. Phosphorylation triggered by Ca2+ causes myosin II to preferentially assume its extended state. This activation promotes the assembly of myosin II into bipolar filaments that enter into the α-actinin-bound actin-filament bundles, resulting in the formation of stress fibers. These fibers generate tension by cross-bridge cycling between the actin and myosin filaments. When the tension is allowed to relax, the actin filaments are no longer held in place by the bipolar-myosin filaments and the stress fibers disassemble. These phenomena are deemed responsible for two key experimental observations.
Tension is essential to the formation of stress fibers. For example, fibroblasts contract collagen gels in which they are suspended. Free-floating gels may contract to only 10% of their original size, and the fibroblasts in these gels lack stress fibers (6). If the gels are anchored, isometric tension is generated and the fibroblasts develop prominent stress fibers (7). In anchored gels, upon release of the tension, rapid contraction is followed by disassembly of the fibers (7, 8). Application of tension to cells in culture also stimulates the formation of stress fibers (9). When tension is applied to a localized site on the cell surface, an actin filament bundle is induced immediately adjacent to this site (10). Associated with the tension-dependent assembly of the stress fibers is the development of structural anisotropy. For example, uniaxially constrained fibroblast populated collagen gels develop high degrees of fiber alignment and mechanical anisotropy, whereas gels constrained biaxially remained isotropic (11).
Cells precisely sense restraining forces and respond by exerting a greater tension on the integrins. The associated strengthening of the linkages occurs within the first few seconds of the application of the restraining force and is localized around its point of application (12).
Model for Cytoskeletal Dynamics Leading to Contractility
Basic Phenomena.
The preceding biochemistry suggests that the mechanical response of the stress fibers comprises three coupled phenomena:
An activation signal that triggers the formation of stress fibers.
A fiber formation rate dependent on the activation signal, coupled with a dissociation rate dependent on the tension.
A contraction rate (contractility) for the stress fiber that depends on the tension through the cross-bridge dynamics.
Phenomenological relations are proposed to model these coupled phenomena for the formation, dissociation, and contraction of a single stress fiber. Thereafter, the relations are generalized to two- and three-dimensional cytoskeletal networks by conducting a homogenization analysis. The key assumptions in the homogenization are as follows:
There is sufficient actin and myosin in the cell that the activation of the stress fibers in each direction is not limited by their availability.
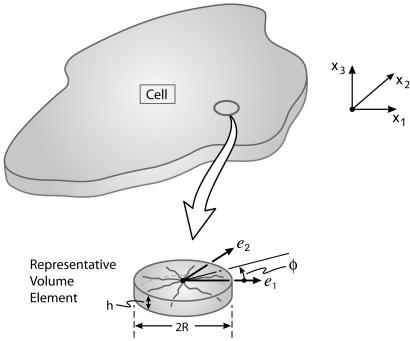
A representative volume element can be defined. Namely, a fine scale network of fibers exists on a length scale much smaller than the dimensions of the cell (Fig. 2).
Stress fibers can form in any direction φ with equal probability (Fig. 2).
Fig. 2.
The macro- and microscales in a cell with a two-dimensional network of stress fibers.
The Model.
We summarize the key equations in the two-dimensional, small-strain version of the model.
The precise details of the signaling processes are ignored. Rather, the level of the signal (which may be thought of as the concentration of Ca2+) is assumed to be given by
where θ is the decay constant of the signal, ti is the time measured from the instant of the most recent signal, whereupon the level of the signal resides in the range, 0 ≤ C ≤ 1.
The signal initiates the formation of the stress fibers as parameterized by the activation level η: η (0 ≤ η ≤ 1) is a nondimensional biochemical state parameter for characterizing the recruitment of actin and myosin in a stress fiber bundle with η = 1, corresponding to the maximum possible recruitment allowed by the biochemistry. The evolution of the activation level η of the stress fibers at angle φ (Fig. 2) is assumed to be governed by a first-order kinetic equation
where the overdot denotes differentiation with respect to time t measured from the instant of the application of the first signal, σ(φ) is the tension in the fiber bundle at orientation φ, and σo ≡ ησmax is the corresponding isometric stress at activation level η. Thus, σmax is the tensile stress that the stress fibers exert at full activation (η = 1). The dimensionless constants k̄f and k̄b govern the rates of formation and dissociation, respectively, of the fibers.
The bundle contraction/extension rate ε̇ is related to the stress σ by the cross-bridge dynamics. Here, we employ a simplified version of the Hill (13) equation while still accounting for fiber lengthening
 |
The nondimensional constant k̄v is the fractional reduction in fiber stress upon increasing the shortening rate by ε̇o. The axial fiber strain rate ε̇ at angle φ is related to the material strain rate ε̇ij by
and the average stress generated by the fibers follows from a two-dimensional homogenization analysis as
 |
The contractile response of a cell includes a contribution from the passive elasticity, provided mainly by the intermediate filaments of the cytoskeleton that are attached to the nuclear and plasma membranes. These passive elements act in parallel with the active elements and, thus, additive decomposition of the active and passive stresses is assumed. The elasticity is described by the isotropic linear elastic Hooke’s law. Then, the total stress Σij (due to both the active and passive contributions) is written by using Cartesian tensor notation (summation over repeated indices) as
 |
where E and ν are the passive Young’s modulus and Poisson’s ratio, respectively, and δij is the Kronecker delta.
The previous expressions are the simplest possible, consistent with the assumed biochemical processes. In future developments, when warranted, different mathematical dependencies can be considered for Eqs. 1–3. Moreover, in the numerical examples presented here, the strains in the cell are relatively small, and a linear elastic relation for the passive elasticity suffices. When warranted, a nonlinear (hyperelastic) law for the passive elastic contribution could be included in Eq. 6. Such changes to Eqs. 1–3 or to the elastic constitutive law will not alter the general features predicted by the model. Only the absolute magnitudes of the stress, strain, and time scales will change.
The model has been implemented as a user defined material model in the commercial finite element package ABAQUS (ABAQUS Inc., Providence, RI). All ensuing simulations are performed in a finite deformation setting. That is, the effect of geometry changes on the momentum balance and rigid body rotations are taken into account.
Square Cell on an Array of Four Supports
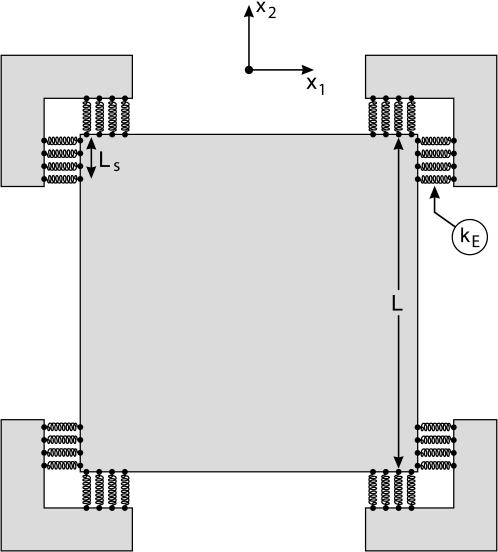
Experiments to probe the forces generated by a cell on a bed of microneedles (1) have motivated the two-dimensional plane-stress problem illustrated in Fig. 3. A square cell, side L = 50 μm (thickness b = 1 μm), is supported over a length Ls = 5 μm at the four edges by an elastic foundation. The foundation has stiffness kE per unit area and rotates with the cell edges. Thus, the foundation can only exert tractions normal to the supported cell edges, i.e., in this finite deformation setting, the traction rate  on a cell surface with unit outward normal ḛn (in the current configuration) is given by
where u̇n is the displacement rate along ḛn and T̃ is the magnitude of the traction vector T̃. By using this representation, the focal adhesions need not be considered explicitly.
Fig. 3.
Schematic of the boundary value problem analyzed to simulate the contraction of a square cell on an array of four posts. Note that the foundation springs rotate with the cell edges as described by Eq. 7.
Reference Properties.
No attempt is made to justify the choice of the parameters used by using either theoretical arguments or precise experimental measurements. Rather, these constants have been chosen to give results similar to those in Tan et al. (1). The decay constant of signals was taken to be θ = 720 s, whereas the passive Young’s modulus and Poisson’s ratio were chosen to be E = 0.077 nN·μm−2 and ν = 0.3, respectively. The nondimensional reaction rate constants are k̄f = 10 and k̄b = 1.0, whereas the nondimensional fiber rate sensitivity k̄v = 10. The maximum tension exerted by the stress fibers, σmax = 3.9 nN·μm−2, and the reference strain rate in the cross-bridge dynamics law, ε̇o = 2.8 × 10⁻⁴ s−1. The effect of the foundation stiffness is investigated by varying kE over the range, 0.015 nN·μm−3 ≤ kE ≤ 6.0 nN·μm−3, for a cell with initial conditions η(φ) = 0 at time t = 0 over the entire cell, i.e., the cell is initially stress and stress fiber-free. Unless otherwise specified, the four supports are identical. A single activation signal is applied to the cell at time t = 0.
The cell was modeled by using four-noded plane stress elements (CPS4 in ABAQUS notation) and a uniform mesh with an element size 0.25 μm was used in all of the calculations.
Nondimensional Groups.
The nondimensional geometric variable is L̄ ≡ L/Ls, whereas the cell and support properties are Ē ≡ E/σmax, ν, k̄f, k̄b, k̄v,  ≡ ε̇oθ and k̄E ≡ kEL/σmax. Results are presented for the average support displacement over the support area, defined as
 |
where ui are the displacement components of the cell along the supported edges and the corresponding work-conjugate support force F is nondimensionalized as F̄ ≡ F/bLsσmax.
The evolution of these quantities is presented in terms of the nondimensional time t̄ ≡ t/θ. Unless otherwise specified, in the results presented subsequently, the cell properties are Ē = 0.02,ν = 0.3, k̄f = 10, k̄b =1.0, k̄v = 10, and  o = 0.2 with the support stiffness varied between 0.2 ≤ k̄E ≤ 78. It is worth emphasizing here that for the relatively small strains in the simulations presented below, the passive response of the cells is very compliant and, thus, the normalized Young’s modulus Ē is set at an appropriately low value of 0.02.
Effect of Support Stiffness.
To visualize the evolution of the stress fibers, we define two additional quantities:
The average stress fiber activation over all orientations
The value σp of the maximum principal stress of the active stresses σij and the associated principal direction, measured as the orientation φp with respect to the x1 axis (Fig. 3). The orientation φp may be regarded as the “resultant” stress fiber direction.
 |
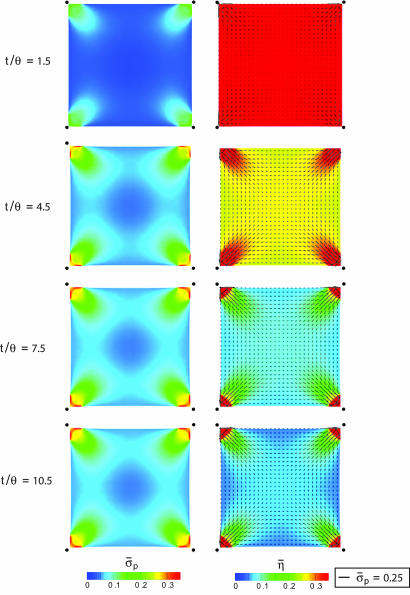
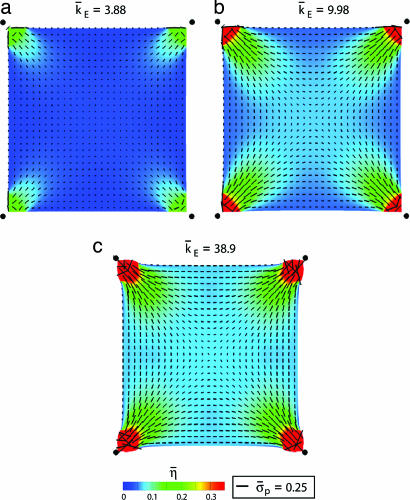
The distributions of the normalized stress σ̄p ≡ σp/σmax and of η̄ plotted for selected t/θ and k̄E =10 (Fig. 4) reveal the following. The stress fiber activation is high at short times, but the high contraction rates result in low stresses. Subsequently, the stress fibers dissociate in the interior. At steady state (t/θ = 10.5), the stresses are proportional to η̄, with the concentration of fibers a maximum near the supports, where the constraints imply near-isometric conditions throughout the deformation history. Moreover, the fibers emanate from the supports and spread out toward the interior, causing η̄ to decrease with increasing distance from the supports. Recall that, because the initial condition is η(φ) = 0 over the entire cell, the distributions are entirely a consequence of the support constraints. The steady-state distributions of η̄ for several support stiffness (Fig. 5) affirm that the highest levels of activation always occur near the supports. For the lowest stiffness, the constraint is insufficient to sustain stress fibers such that, except adjacent to the supports, η̄ ≈ 0. Conversely, for the highest k̄E, there are only small support displacements with the cell shape distorting (Fig. 5c). The orientations of the “resultant” stress fibers (Fig. 5) indicate that, although the activation level strongly depends on the foundation stiffness, the orientations are insensitive to the value of k̄E. In all cases, some fibers form along the cell perimeter, whereas others form along the diagonals.
Fig. 4.
The distribution of the normalized maximum principal stress σ̄p and average stress fiber activation level η̄ at four selected times (support stiffness k̄E = 10). The distributions of the orientations φp also are included as line segments (with length scaled by the magnitude of the normalized stress σ̄p). The filled circles show the original positions of the cell corners.
Fig. 5.
The distribution of η̄ at steady state for normalized support stiffness values k̄E = 3.9 (a), k̄E = 10 (b), and k̄E = 39 (c). The distributions of the orientations φp are also included as line segments (with length scaled by the magnitude of the normalized stress σ̄p). The filled circles show the original positions of the cell corners.
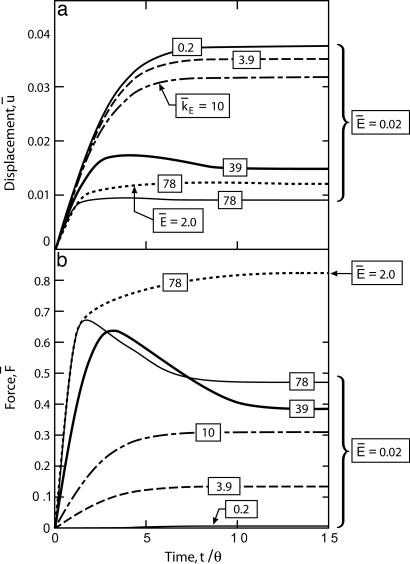
The time evolution of the average displacement, u̇ and support force F̄ (Fig. 6) indicate that for small support stiffness (k̄E ≤ 0.2), the steady-state force is almost zero, corresponding to the unconstrained contraction of the cell. Upon increasing k̄E, the support deflection decreases and force increases, consistent with a wide range of experimental observations (see for example ref. 11 and the discussion in ref. 14). This trend can be rationalized in the context of the model as follows. The evolution Eq. 2 dictates rapid fiber assembly when the activation signal C is strong and, conversely, a high dissociation rate when the stresses are below their isometric value. For compliant supports, the initial formation of the stress fibers results in large support deflections, but the support forces are low, causing rapid dissociation. By the time that the supports generate significant force, the activation signal has decayed away, resulting in small steady-state η̄ (Fig. 5) and, correspondingly, low support forces.
Fig. 6.
The time evolution of the normalized displacement u̇ ≡ u/L (a) and normalized force per support F̄ ≡ F/(bLsσmax) (b) exerted by the cell. Results are shown for five selected values of the normalized support stiffness and reference cell properties. Results also are included for a cell with a passive Young’s modulus Ē = 2.0 on supports with stiffness k̄E = 78.
For extremely stiff supports, the force initially overshoots (Fig. 6) and then asymptotes to steady state. This overshoot is eliminated if the passive Young’s modulus of the cell is increased to Ē = 2.0 (Fig. 6). The role of the Young’s modulus in governing this overshoot is rationalized as follows. Consider a cell under uniaxial isometric tension, namely restrained by infinitely stiff supports. Fibers along the tensile axis do not contract and generate isometric tension. The contraction of the fibers orthogonal to the tensile axis generates a compressive stress contribution along that axis, because of the Poisson effect, thereby reducing the axial tension with continued contraction of the cell orthogonal to the tensile axis of the cell. Increasing the Young’s modulus decreases this contraction and the associated reduction in the generated tension.
Development of Structural Anisotropy.
In the preceding examples, the cell developed an anisotropic microstructure (stress fibers along the cell perimeter and diagonals) dictated by the locations of the supports. We now break the symmetry by presenting two sets of results for a cell in which one of the supports has a lower stiffness than the other three, which all have k̄E = 10. The distributions of η̄ at steady-state are presented on Fig. 7(using k̄E = 3.9 and k̄E = 0.2 for the bottom right support). The orientations φp of the maximum principal stress σ̄p also are included as line segments (with length scaled by the normalized stress σ̄p). The results reveal that the stress fiber concentration is high near the stiff supports, but the cell is nearly devoid of fibers in the bottom right corner for k̄E = 0.2. Note that the stress fibers form preferentially along the +45° diagonal.
Fig. 7.
The distribution of η̄ at steady state for the cell on supports with unequal stiffness. The top two and bottom left supports have stiffness k̄E = 10, whereas the bottom right support has stiffness k̄E = 3.9 (a) and k̄E = 0.2 (b). The distributions of the orientations φp are also included as line segments (with length scaled by the magnitude of the normalized stress σ̄p). The filled circles show the original positions of the cell corners.
Conclusion
A biochemically inspired model for the dynamic rearrangement of the cytoskeleton that incorporates cell contractility has been presented. It entails a highly nonlinear interaction among signaling, the kinetics of tension-dependent stress-fiber formation/dissolution, and stress-dependent contractility. It is shown that the model captures the general contractile features observed in experimental studies including: (i) the decrease of the forces generated by the cell with increasing substrate compliance, (ii) the influence of cell shape and boundary conditions on the development of structural anisotropy, and (iii) the high concentration of the stress fibers at the focal adhesions.
The model can be readily extended to account for additional phenomena, such as cell spreading and motility. The dynamics of the focal adhesions that link the extracellular matrix to the cytoskeletal network also can be included by adding models that couple focal adhesion formation with the stresses in the connecting fibers (15). Such assessments (unpublished data) make direct contact with the adhesion and contractility measurements in Tan et al. (1) and Parker et al. (16).
The model has the additional feature that it can be used to address one of the key challenges in cell biomechanics. Namely, how to measure the mechanical characteristics of living cells that react to the measurement tools. Because the model captures the reorganization of the cytoskeletal elements in response to mechanical perturbations, it can be used as a framework to design and interpret appropriate experiments.
Acknowledgments
We thank Profs. C. Chen, A. Dinner, and M. Mrksich for helpful discussions and comments. V.S.D. acknowledges support from the Leverhulme Trust, U.K. R.M.M. and A.G.E. thank the Army Research Office for their support through a subcontact with the University of Chicago provided by Multidisciplinary University Research Initiative program on “Bio-Mechanical Interfaces for Cell-Based Microsystems” Prime Award W911NF-04-1-071.
Footnotes
The authors declare no conflict of interest.
References
- 1.Tan JL, Tien J, Pirone DM, Gray DS, Bhadriraju K, Chen CS. Proc Natl Acad Sci USA. 2003;100:1484–1489. doi: 10.1073/pnas.0235407100. [DOI] [PMC free article] [PubMed] [Google Scholar]
- 2.Satcher RLJ, Dewey CFJ. Biophys J. 1996;71:109–118. doi: 10.1016/S0006-3495(96)79206-8. [DOI] [PMC free article] [PubMed] [Google Scholar]
- 3.Storm C, Pastore JJ, MacKintosh FC, Lubensky TC, Janmey PA. Nature. 2005;435:191–194. doi: 10.1038/nature03521. [DOI] [PubMed] [Google Scholar]
- 4.Nelson CM, Jean RP, Tan JL, Liu WF, Sniadecki NJ, Spector AA, Chen CS. Proc Natl Acad Sci USA. 2005;102:11594–11599. doi: 10.1073/pnas.0502575102. [DOI] [PMC free article] [PubMed] [Google Scholar]
- 5.Mohrdieck C, Wanner A, Roos W, Roth A, Sackmann E, Spatz JP, Arzt E. ChemPhysChem. 2005;6:1492–1498. doi: 10.1002/cphc.200500109. [DOI] [PubMed] [Google Scholar]
- 6.Burridge K, Chrzanowska-Wodnicka M. Annu Rev Cell Dev Biol. 1996;12:463–518. doi: 10.1146/annurev.cellbio.12.1.463. [DOI] [PubMed] [Google Scholar]
- 7.Mochitate K, Pawelek P, Grinnell F. Exp Cell Res. 1991;193:198–207. doi: 10.1016/0014-4827(91)90556-a. [DOI] [PubMed] [Google Scholar]
- 8.Grinnell F. J Cell Biol. 1994;124:401–404. doi: 10.1083/jcb.124.4.401. [DOI] [PMC free article] [PubMed] [Google Scholar]
- 9.Kolega J. J Cell Biol. 1984;102:1400–1411. doi: 10.1083/jcb.102.4.1400. [DOI] [PMC free article] [PubMed] [Google Scholar]
- 10.Franke RP, Grafe M, Schnittler H, Seiffge D, Mittermayer C, Drenckhahn D. Nature. 1984;307:648–649. doi: 10.1038/307648a0. [DOI] [PubMed] [Google Scholar]
- 11.Thomopoulos S, Fomovsky GM, Holmes JW. J Biomech Eng. 2005;127:742–750. doi: 10.1115/1.1992525. [DOI] [PubMed] [Google Scholar]
- 12.Choquet D, Felsenfeld DP, Sheetz MP. Cell. 1997;88:39–48. doi: 10.1016/s0092-8674(00)81856-5. [DOI] [PubMed] [Google Scholar]
- 13.Hill AV. Proc R Soc London Ser B; 1938. pp. 136–195. [Google Scholar]
- 14.Ingber DE. Proc Natl Acad Sci USA. 2003;100:1472–1474. doi: 10.1073/pnas.0530201100. [DOI] [PMC free article] [PubMed] [Google Scholar]
- 15.Novak IL, Slepchenko BM, Mogilner A, Loew LM. Phys Rev Let. 2004;93:268109-1–268109-4. doi: 10.1103/PhysRevLett.93.268109. [DOI] [PubMed] [Google Scholar]
- 16.Parker KK, Brock AL, Brangwynne C, Mannix RJ, Wang N, Ostuni E, Geisse NA, Adams JC, Whitesides GM, Ingber DE. FASEB J. 2002;16:1195–1204. doi: 10.1096/fj.02-0038com. [DOI] [PubMed] [Google Scholar]


