Abstract
Muscle contraction results from interactions between actin and myosin cross-bridges. Dynamics of this interaction may be quite different in contracting muscle than in vitro because of the molecular crowding. In addition, each cross-bridge of contracting muscle is in a different stage of its mechanochemical cycle, and so temporal measurements are time averages. To avoid complications related to crowding and averaging, it is necessary to follow time behavior of a single cross-bridge in muscle. To be able to do so, it is necessary to collect data from an extremely small volume (an attoliter, 10−18 liter). We report here on a novel microscopic application of surface plasmon-coupled emission (SPCE), which provides such a volume in a live sample. Muscle is fluorescently labeled and placed on a coverslip coated with a thin layer of noble metal. The laser beam is incident at a surface plasmon resonance (SPR) angle, at which it penetrates the metal layer and illuminates muscle by evanescent wave. The volume from which fluorescence emanates is a product of two near-field factors: the depth of evanescent wave excitation and a distance-dependent coupling of excited fluorophores to the surface plasmons. The fluorescence is quenched at the metal interface (up to ∼10 nm), which further limits the thickness of the fluorescent volume to ∼50 nm. The fluorescence is detected through a confocal aperture, which limits the lateral dimensions of the detection volume to ∼200 nm. The resulting volume is ∼2 x 10⁻¹⁸ liter. The method is particularly sensitive to rotational motions because of the strong dependence of the plasmon coupling on the orientation of excited transition dipole. We show that by using a high-numerical-aperture objective (1.65) and high-refractive-index coverslips coated with gold, it is possible to follow rotational motion of 12 actin molecules in muscle with millisecond time resolution.
INTRODUCTION
Muscles contract as a result of interactions of myosin cross-bridges with actin. It is important to study dynamics of this interaction in muscle, because behavior of proteins in vivo may be quite different than in vitro. In solution, proteins are loosely packed, whereas in vivo, they are crowded. Molecular crowding influences protein solubility and conformation (1). The effect of crowding is particularly severe in muscle, where the concentrations of actin and myosin are 0.6 mM and 0.24 mM, respectively (2). Actin and myosin are meant to operate in such crowded environments, as evidenced by the fact that their Km is in the micromolar range, but crowding may impose constraints affecting both their structure and function so that their properties in dilute solutions may be different from those in muscle (3).
In addition, myosin cross-bridges act asynchronously; i.e., at any time during muscle contraction, each is in a different part of a mechanochemical cycle. Therefore, measurement taken at any time during contraction is an average value. There are two ways to overcome this problem. The first way is to synchronize many cross-bridges by a rapid step of tension or length. The time course of relaxation back to equilibrium is then followed (4–6). However, application of a transient itself disturbs steady state. An alternative is to follow rotation of a single cross-bridge during steady-state contraction. In this article we describe a novel method of doing this in skeletal muscle.
To be able to obtain information from individual molecules in muscle, it is necessary to collect data from an extremely small volume, small enough to contain few molecules. The observational volume of conventional wide-field microscopes is much too large (∼10−9 liter). The introduction of small observational volumes defined by diffraction-limited laser beams and confocal detection made it possible to limit the observational volume to a femtoliter (10−15 liter) and eliminate much background noise (7). However, such volumes are still too large. If molecules are to be observed at micromolar concentrations, the volume must be of the order of attoliters (10−18 liter). This has been accomplished by utilizing zero-mode waveguides, which consist of small apertures in a metal film deposited on a coverslip (8). Such apertures act as sources of polariton evanescent waves, so the volume defined by each aperture is limited in the z direction by the depth of the evanescent wave (∼50–100 nm) and in x and y directions by the size of the aperture. The technique was recently applied to observing single molecule dynamics in living cell membranes (9). However, the manufacture of the film with small apertures is complex and expensive. Another way to decrease volume is to use near-field scanning optical microscopy (NSOM), in which an evanescent wave is produced by passing light through a narrow (50–100 nm) aperture (10, 11). Single molecules on a surface can be observed in this fashion (12).
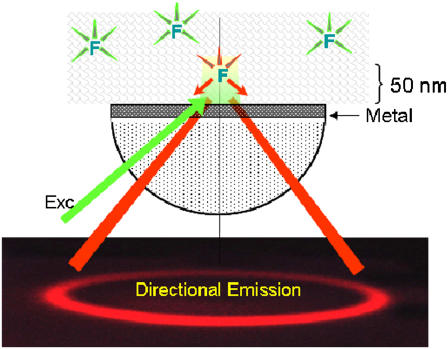
Earlier, we have used confocal microscopy to limit the volume to femtoliters. By labeling ∼1% of myosin cross-bridges, we were able to detect ∼400–600 cross-bridges in muscle (5, 13). We used two-photon (2P) microscopy to reduce the number by a factor of two (6). Finally, by limiting the thickness of the detection volume by total internal reflection (TIR) and lateral dimensions by confocal detection, we were able to decrease detection volume to ∼7 al and detect five–seven cross-bridges (14). In this article we describe an alternative technique combining the principles of confocal TIR (15) and surface plasmon coupled emission (SPCE) (16, 17) methods. SPCE has been described in free-standing configurations (16,17) and has been used to detect single molecules (18). Recently, it has been applied to a microscope (19–21). In the current application of this technique, the observational volume is made shallow by placing a sample on a thin metal film and illuminating it with the laser beam at the surface plasmon resonance (SPR) angle. The laser beam is able to penetrate the metal and illuminate a myofibril. Excitation light produces an evanescent wave on the aqueous side of the interface. The concept is shown in Fig. 1. The thickness of the detection volume is a product of evanescent wave penetration depth and distance-dependent coupling with surface plasmons. It is further reduced by a metal quenching of excited fluorophores at a close proximity (<10 nm). As a result, the detection volume is ∼50 nm thick. The fluorescent light is emitted only at an SPCE angle (on a surface of a cone in 3D). A confocal aperture inserted in the conjugate image plane of the objective reduces lateral dimensions of the detection volume to∼200 nm. We show here that the confocal SPCE microscope has the ability to resolve volumes of a few attoliters. Although a recent theoretical work suggests that the method offers no advantages over TIRF as far as fluorescence collection efficiency and brightness are concerned (22), SPCE has five practical advantages when measuring rotational motion of single molecules in cells:
The detection volume is small, at least twofold smaller than in TIRF. The thickness of effective fluorescence volume is reduced not only by evanescent excitation as in TIRF but also by distance-dependent emission coupling and by quenching of fluorescence emitted from fluorophores near the metal surface. It is important to note that such coupling preserves spectral properties of fluorophores very well (23–25).
The fluorescence coupling to surface plasmons depends dramatically on the orientation of the molecule transition moment; i.e., the method is particularly suited to measurements of orientation changes. The coupling is very efficient for the orthogonal dipole orientation (p-polarization). Conversely, for dipole orientation in the plane of metal surface (s-polarization), the coupling is manyfold weaker. A theory for coupling under conditions used in our experiments is presented below.
The major part of the fluorescence signal is contributed by fluorophores at least 10 nm away from the surface. Consequently, molecules whose rotation is slowed down or inhibited by the surface do not contribute to the signal.
The photobleaching is reduced. Coupling to surface plasmons enhances the excitation field and allows less excitation power to be used. In addition, fluorescence lifetime is partially reduced.
The directional and highly polarized character of SPCE enables better suppression of background noise, at least in bulk measurements.
FIGURE 1.
Concept behind confocal SPCE microscope. The fluorophores are placed on a metal-coated coverslip and excited with green light at an SPR angle. The excitation energy couples to the surface plasmons and radiates to the glass prism (red) as a surface of a cone with half-angle equal to the SPCE angle. Metal can be a thin layer of Al (20 nm thick) or Ag or Au (50 nm thick). The picture of the directional emission is taken from a real experiment.
In this article we show that that by using a high-numerical-aperture objective (1.65) and high-refractive-index coverslips coated with gold, microscopic SPCE makes possible superior imaging of muscle myofibrils, which allows following rotational motion of 12 actin molecules in muscle with millisecond time resolution.
MATERIALS AND METHODS
Chemicals and solutions
Rhodamine-phalloidin was from Molecular Probes (Eugene, OR). Fluorescein-phalloidin, unlabeled phalloidin, phosphocreatine, creatine kinase, glucose oxidase, and catalase were from Sigma (St. Louis, MO).
Preparation of myofibrils
Muscle was washed with cold EDTA-rigor solution for ½ h followed by Ca-rigor solution (50 mM KCl, 2 mM MgCl2, 0.1 mM CaCl2, 10 mM DTT, 10 mM TRIS-HCl, pH 7.6). Myofibrils were made from muscle in Ca-rigor as described before (26).
Labeling of myofibrils
A quantity of 1 mg/mL of myofibrils were labeled by 5′ incubation with 0.1 μM fluorescein- or rhodamine-phalloidin + 9.9 μM unlabeled phalloidin. After labeling myofibrils were washed by centrifugation on a desktop centrifuge at 3000 rpm for 2 min followed by resuspension in rigor solution.
Myofibrillar sample preparation
A 15-μl aliquot of myofibrillar suspension was placed on a coated coverslip, covered with glass coverslip (to avoid drying), and washed with 3–4 volumes of rigor solution containing phosphocreatine, creatine kinase, glucose oxidase, and catalase to remove oxygen and maintain, where needed, ATP concentration (27).
Bulk sample preparation
Rhodamine 6G (laser grade) was deposited on the surface by spin-coating at 3000 rpm a 0.5% solution of low-molecular-weight PVA (polyvinyl alcohol, molecular weight 13,000–23,000, Aldrich, St. Louis, MO) in water. The PVA solution contained rhodamine 6G (Rh6G). The thickness of the sample (Rh6G-doped PVA layer) was estimated from the comparison of reflectance measured for a metallized quartz slide before and after the sample deposition. For silver-coated substrates, a 532-nm p-polarized laser beam shows SPR angles of 49° and 52° for the slides without and with the sample. Such a change in the SPR angle corresponds to an ∼20-nm-thick layer of dielectric with refractive index n = 1.5. As a background fluorescence, we used ethanol solution of DCM (4-(dicyanomethylene)-2-methyl-6-(p-dimethylaminostyryl)4H-pyran, Kodak), which was attached to the slide with sample using a demountable cuvette (100-μm pathway). We checked that ethanol does not dissolve PVA.
Preparation of coverslips
High-refractive-index coverglasses from Olympus, or quartz slides (spectrosil 1, Starna Cells, Atascadero, CA) were coated by vapor deposition by EMF (Ithaca, NY). A 52-nm-thick layer of silver and a 48-nm layer of gold were deposited on the coverslips. A 2-nm chromium undercoat was used as an adhesive background.
Data analysis
Images were analyzed by the ImageJ program (NIH).
Fluorescence measurements
The quartz slide with sample (or sample with background) was attached to a semicylindrical glass prism (BK7, n = 1.52) using glycerol (n = 1.475) as an index matching fluid. This combined sample was positioned on a precise rotary stage, similar to one previously described (28, 29) but equipped with a longer (20 cm) arm for a detection fiber mount. The arm has the possibility of movement in a vertical axis. This modification increased the angular resolution (below 0.1°) and allowed a better adjustment for the signal optimization.
Microscopic measurements
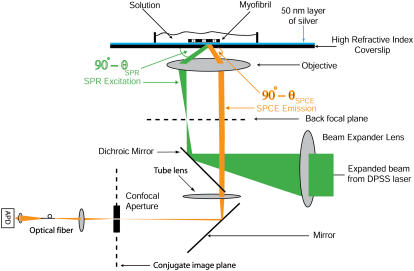
The schematic of the microscope is shown in Fig. 2. Excitation light from an expanded diode-pumped solid-state laser beam (Compass 215M, Coherent, Santa Clara, CA) enters the epi-illumination port of the inverted microscope (Olympus IX51). The expanded laser beam, focused at the back focal plane of the objective, is directed by the movable optical fiber adaptor to the periphery of the objective (Olympus Apo 100×, 1.65 NA), where it refracts and propagates toward the high-refractive-index glass-metal/buffer interface. When the incidence angle is equal to the SPR angle, the light is able to penetrate the metal and illuminate a cell. Excitation light produces an evanescent wave on the aqueous side of the interface (30) at the surface of a sample. Normally, the evanescent field decays exponentially in the z-dimension with a penetration depth,  , where λ0 is the wavelength of the incident light, ng is glass refractive index, and nw (= 1.33) is the refractive index of water. In our case, however, the detection volume is a composition (product) of evanescent wave penetration depth and distance-dependent coupling with surface plasmons. The detection volume is further reduced by a metal quenching of excited fluorophores at a close proximity (below 10 nm). We show below that the height of the detected volume is 40–70 nm, depending on the orientation of the excited dipoles. The fluorescent light, emitted at SPCE angle, is collected by the objective. The sample rests on a movable piezo stage (Nano-H100, Mad City Labs, Madison, WI) controlled by a Nano-Drive. This provides sufficient resolution to place the region of interest (ROI) in a position conjugate to the aperture. (The resolution is limited by the number of bits of the A/D converter controlling the piezo crystal. With the 16-bit device, the resolution is 1.6 nm (Mad City offers 20-bit converter with 0.2 nm resolution).) The fluorescent light is collected through the same objective and projected onto a tube lens, which focuses it at the conjugate image plane. A confocal aperture or an optical fiber (whose core acts as a confocal aperture) is inserted at this plane. An avalanche photodiode (APD, Perkin-Elmer SPCM-AQR-15-FC) collects light emerging from the aperture.
FIGURE 2.
Prismless confocal SPCE microscope. Not to scale.
Photon counting
The quantum efficiency of the APD is ∼65% at 500 nm; the dark count is ∼10 cps, and it can count up to 107 counts/s. The APD's TTL pulses are counted by a counter/timer on a plug-in card (National Instruments (NI), Austin, TX, PCI-6601) controlled by a custom LabVIEW program using DAQmx software drivers. The PCI-6601 is a timing and digital I/O device with four 32-bit counter/timers and up to 32 lines of TTL/CMOS-compatible digital I/O. The 6601 card is a completely switchless/jumperless device and requires only software configuration. It derives most of its functionality from the NI-TIO, a counter and digital I/O application-specific integrated circuit (ASIC) developed by NI. To attain complete hardware timing and synchronization, multiple successive measurements are made in a buffered even counting mode. In this mode counters are read “on the fly” with sampling rates approaching 1 MHz. The result of each measurement is saved in the Hardware Save Register on each active edge of the GATE signal. The GATE signal indicates when to save the current counter value. A buffered measurement generates a data stream, which is transferred to a PC via direct memory access (DMA) or interrupts. Counting continues uninterrupted regardless of the GATE activity. Photon counting eliminates the need for a frame grabber and allows direct 32-bit counting by a PC. The counters are read simultaneously at the rising edge of the GATE signal provided by the Nano-Drive controller.
Calculations
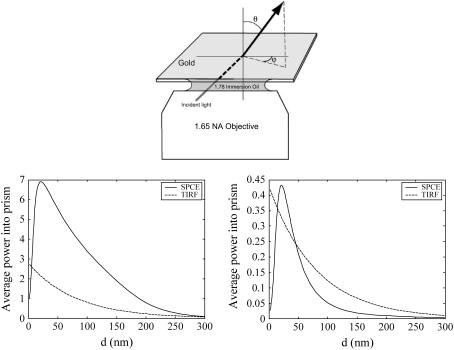
The calculation of the electric field at the surface was done by ordinary Fresnel refraction theory. The calculation of the average power into the objective was done by first calculating the square of the electric field component at the fluorophore along its transition moment to find out its excitation rate. This rate was then multiplied by the emission from the fluorophore into the objective, calculated in the same way as before, i.e., by expressing the fields from the fluorophore in terms of sums of plane waves, and then applied to Fresnel theory as described by Calander (31). (For the definition of the orientation of the fluorophore, see Fig. 6.) It is assumed that the exciting field is continuous in time and weak enough (which may not be the case in practice) that the time between excitations is much longer than the time between excitation and emission of the fluorophore. This means that the average number of photons emitted per unit time, and therefore the average total emitted power, does not depend on the lifetime; they only depend on the average time between excitations. The refractive indices of the metals used in the calculations are interpolated from TFC-Calc. (32).
FIGURE 6.
(Top) Definition of angles. (Bottom) Calculated power flow to the objective in the SPCE experiments for (left) θ = 0°, i.e., p-orientation and (right) θ = 90°, i.e., s-orientation of the transition moment. The time between excitation of the fluorophores is assumed much longer than the emission time. Note that the power of the p-polarization is ∼10 times greater than that of s-polarization. Gold layer of 48 nm, excitation wavelength = 633 nm, at maximum field (57.86°), emission at 670 nm (solid line, SPCE; broken line, TIRF). The strong dissipation of energy into the metal layer for short distances lowers the power in SPCE but not in TIRF.
RESULTS
Demonstration of SPCE in the microscope
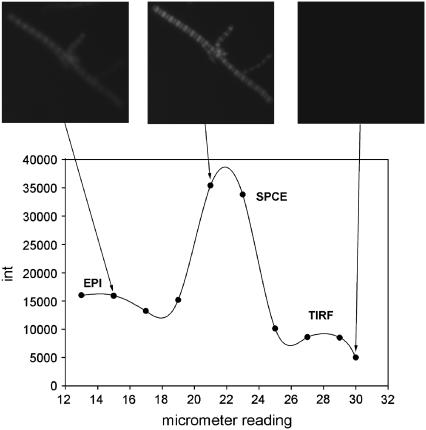
We demonstrated the ability to image muscle in aqueous solution by SPCE microscopy. We placed 20 μl of a suspension of myofibrils in rigor solution on an Olympus high-refractive-index coverslip coated with a 48-nm layer of gold and observed fluorescence at different angles of incidence. The sample was illuminated by collimated beam of 532-nm light at an angle defined by the turn of a TIRF attachment micrometer screw. Fig. 3 demonstrates the enhancement of fluorescent signal caused by the SPCE phenomenon. The angle varied between 30° (corresponding to −12 reading of the micrometer screw) to 70° (corresponding to 30 reading of the micrometer screw). The angle was initially set at 70°, too large to enter the back aperture of the TIRF objective. The resulting intensity was equal to the background. The angle was then progressively decreased, which caused an increase of intensity. At ∼50°, a faint image of myofibrils appeared, indicating that the TIRF angle had been reached. When the SPR angle was reached at ∼60°, the intensity increased sharply to a peak, indicating SPCE excitation. Further decrease in angle caused the intensity to decline, indicating epifluorescence excitation. This phenomenon manifests itself under the microscope in a spectacular way. When the angle of a laser beam incidence is high, above the SPR angle, the viewing area under the microscope is dark. With the angle change, the strong glaze appears. With further angle decrease, the glaze vanishes, as is shown in sequential photographs in the top of Fig. 3.
FIGURE 3.
SPCE signal from skeletal myofibrils as a function of the illumination angle. The top panel shows photographs taken from the microscope for various illumination angles. Myofibrils labeled with 0.1 μM fluorescein-phalloidin. λex = 488 nm. Images analyzed by ImageJ.
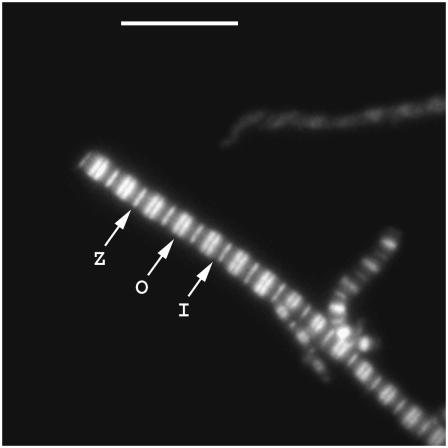
Fig. 4 shows an SPCE image of a myofibril labeled with 0.1 μM fluorescein phalloidin. Despite the fact that phalloidin attaches to actin, the I-bands are not well labeled. This is consistent with earlier observation that in skeletal muscle (in contrast to cardiac muscle) phalloidin first labels the ends of actin filaments (33). Several hours are needed for the I-bands to label uniformly. Because the current experiment was done ∼15 min after labeling, the fluorescence originates mostly from the overlap zone. The SPCE image is well resolved, as would be expected from the near-field technique. Most likely background suppression by gold contributed to this effect. Particularly impressive was that fact that the H-zone was clearly resolved. Microscopic SPCE of wet samples cannot be achieved with a “low” (NA = 1.45) TIRF objective. With a high-NA (= 1.65) objective, the image can be obtained with both 488 and 532 nm excitation, on coverslips covered with gold and silver, on high-refractive-index coverslips made by Olympus, and on coverslips made from sapphire.
FIGURE 4.
SPCE image of myofibril in rigor. Myofibril labeled with 0.1 μM fluorescein-phalloidin on gold coverslips. The image was contrast enhanced to emphasize superior resolution of the method: Z is the Z-line, O is the overlap zone, I is the I-band. Bar is 10 μm.
Comparison of TIRF and SPCE images of muscle
We compared images of myofibrils on glass and high refractive index coverslips. One set was coated with a 48-nm layer of silver and a 2-nm layer of silicon, the second set was coated with a 48-nm layer of gold, and the third set was left uncoated. We used a 100× (NA = 1.65) objective from Olympus and n = 1.78 (Cargill) oil; 1 mg/ml myofibrils were labeled with 0.1 μM fluorescein-phalloidin and observed in rigor solution (not dry). The same myofibril could not be observed (because we used three different coverslips), but each myofibril came from the same batch. Subjective impression (Table 1) was that the SPCE image was better on gold than on silver. The quality of image of myofibrils was comparable in TIRF and EPI, no doubt because myofibrils are very thin. In the case of SPCE, the intensity of images was greater with p-polarization, in accordance with theoretical prediction (see below). It is our impression that wet muscle samples on sapphire coverslips covered with gold and observed under 532-nm illumination gave the prettiest image.
TABLE 1.
Qualitative comparison of myofibrillar images with different coverslips
| Excitation | Glass uncoated | Quartz uncoated | Sapphire uncoated | Olympus uncoated | Sapphire coated with gold | Olympus coated with gold | Olympus coated with silver |
|---|---|---|---|---|---|---|---|
| TIRF | +++* | +++ | +++ | ++ | ++(dim) | ++ (dim) | ++ (dim) |
| EPI | ++† | ++† | ++† | ++† | ++ | + | − |
| SPCE | NP‡ | NP | NP | NP | +++ | +++ | ++ |
Excitation was with Argon laser at 488 nm.
+++, very good; ++, good; +, fair; −, inferior.
Images are good because myofibril is thin (∼0.5 μm).
Not possible.
The thickness of the detection volume
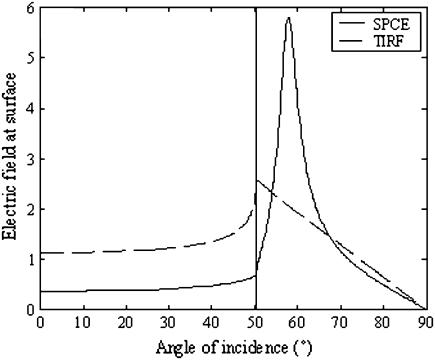
Consider a slab-shaped material interposed between the glass and water interfaces. The metal (∼20 nm for Al, 50 nm for Au or Ag) film is characterized by a complex dielectric constant. Incident light (TIR) transmits through the glass/metal interface, undergoes multiple reflections between the metal/water and glass/metal interfaces, and then emerges as a refracted ray in the water medium (34). At the SPR angle, the light impinging from the prism induces surface plasmons. The plasmon resonance strengthens the electric field in the excitation evanescent wave, as shown in Fig. 5. Insertion of the metal film dramatically perturbs the z = 0 field intensities in the water medium (34–36). The film reflects or absorbs s-polarized incident light, permitting negligible light transmission for all incidence angles. Similarly, the film reflects or absorbs p-polarized incident light, permitting negligible transmission for almost all angles. However, a dramatic enhancement of transmission occurs in a narrow peak for incidence angle ΘSPR ≈ 57°, an angle larger than the critical ΘCritical = 50.32°. Angle ΘSPR is the surface plasmon angle where transmission enhancement results from the resonant excitation of electron oscillations (surface plasmons) propagating along the water/metal interface. This phenomenon occurs at interfaces where constituent materials have real parts of the dielectric constants of opposite signs. Like the evanescent field for p-polarized incident light in TIRF, polarization is elliptical but approximates linear polarization along the z-axis, and intensity decays exponentially in the distance z from the interface (34,37). Both polarization and field depth depend on incidence angle. Hellen and Axelrod pointed out that for a fluorophore under steady illumination, the dissipated power must equal the absorbed power, implying that a fixed-power, rather than a fixed-amplitude, dipole radiator is the appropriate model for probe emission near an interface (38). An important consequence of this model, observed for cells adsorbed to metal-coated glass (34), is that the metal film totally quenches fluorescence from probes within ∼10 nm of the interface.
FIGURE 5.
Electric field of the evanescent wave at the surface. It is normalized to the electric field of the incident wave. Gold layer of 48 nm; excitation wavelength = 633 nm; maximum field at 57.86°; critical angle is 50.32°; integral from critical angle to 90° is 63.27 (solid line, SPCE; broken line, TIRF).
To calculate the power flow into the objective, we define the polar angle of the fluorophore transition moment (Θ) and the azimuthal angle (φ) as usual (Fig. 6, top). The bottom part shows the average power of SPCE emission versus the distance of the fluorophore from the metal for two orientations of the fluorophore transition moment. The metallic layer considered here is a 48-nm-thick layer of gold deposited on high-refractive-index glass (n = 1.78). The refractive index of medium was taken as 1.37 to mimic that of muscle. The excitation was at 633, and emission at 670 nm. The distance dependence is no longer exponential. The half-widths of the SPCE fluorescence volumes are 70 nm and 40 nm for orthogonal and parallel dipoles, respectively. Because fluorescence is totally quenched from the volume within 10 nm from the interface, we estimate that fluorescence is originating from the 50-nm- and 20-nm-thick layers. This translates to a detection volume of ∼2 al.
Sensitivity to the rotational motion
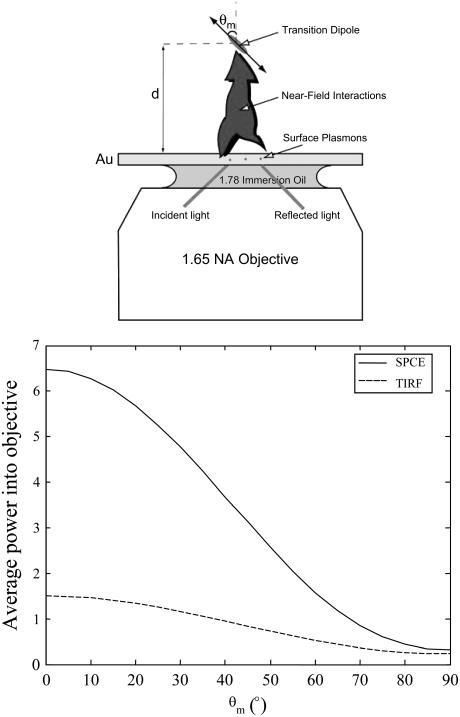
SPCE is particularly useful in measuring rotational motion. This is because coupling of fluorescence to surface plasmons dramatically depends on the orientation of the molecule transition moment. The coupling is very efficient for the orthogonal dipole orientation (p-polarization) and not efficient for dipole orientation in the plane of metal surface (s-polarization). Consider the simple three-layer system shown in Fig. 7 (top panel). For such a system, transition moments orthogonal to the metal surface will preferentially couple to surface plasmons, and only p-polarized SPCE can be observed. The decay times, the probability that an emitted photon goes into the objective, and the percentage of the photons in the glass prism that are p-polarized depend on the fluorophore position and transition moment orientation. The dependence is quantified in Fig. 7 (bottom). It is seen that TIRF illumination yields 5.3 times more power into the objective for vertical than horizontal orientation of the transition dipole. In contrast, SPCE illumination yields 18.6 times more power into the objective for vertical than horizontal orientation of the transition dipole. The average sensitivity is therefore 3.5 times greater for the SPCE than for TIRF.
FIGURE 7.
Coupling of fluorescent dipole moments to surface plasmons (top) and comparison of the dependence of the transition moment angle for TIRF and SPCE (bottom). Gold layer 48 nm; λex= 633 nm; maximum field (57.86°); emission at 670 nm; d = 50 nm.
Background suppression (spectroscopy approach, not applicable to microscopic detection)
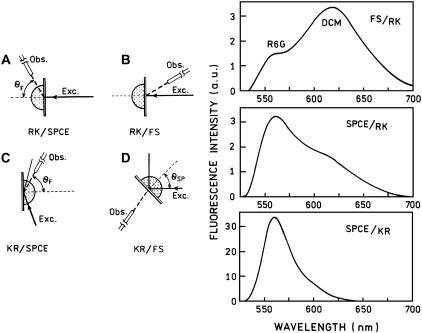
The superior suppression of background fluorescence that does not couple to plasmons arises from the directional nature of the emitted light and the presence of the opaque metal film. To demonstrate this effect, we used two modes of excitation shown in the left of Fig. 8. In the RK (reverse Kretschmann) configuration, the sample is excited directly. The excited fluorophores either emit fluorescence or couple to the surface plasmons (at a very close distance, <10 nm, the fluorescence is being quenched by the metal). The energy coupled to the surface plasmons can be radiated into quartz/glass at an SPCE angle. In the KR (Kretschmann) configuration, the excitation comes through the glass prism. At the angle close to SPR, the p-polarized light is being absorbed by surface plasmons. The strong evanescent field from propagating plasmons excites fluorophores near the metal surface. It is intuitively obvious that the far-field fluorescence will be partially blocked by the semitransparent mirror and will minimally interfere with observed SPCE. SPCE originates from near-field interaction of excited fluorophores with surface plasmons localized in metal/dielectric interface. To see the depth of the distance-dependent coupling, we combined the sample with a Rh6G-doped 20-nm-thick layer of PVA as a background. The role of background plays the 100-μm layer of ethanol solution of DCM (4-(dicyanomethylene)-2-methyl-6-(p-dimethylaminostyryl)4H-pyran, Kodak), which was added to the 100-μm-thick demountable cuvette. The fluorescence of DCM is shifted by ∼70 nm to the longer wavelengths and is easily distinguishable from the Rh6G emission. With RK configuration, the free space (FS) signal is dominated by the DCM fluorescence (Fig. 8, right, top panel). This was adjusted by the DCM concentration. In this configuration, both the background and the sample are being excited homogeneously, and no surface plasmons are induced by the excitation light. In the direction of SPCE, the observed spectrum is dominated by Rh6G fluorescence (Fig. 8, right, middle panel). Only a small fraction of excited DCM fluorophores are able to couple to the surface plasmons, namely those that were within the proper distance from the silver surface. Next, we rotated the prism and sample to the KR configuration. In this case, the observed SPCE is almost not perturbed by the DCM background. This happens because two factors have been combined, the distance-dependent coupling and distance-dependent excitation by the evanescent field. In the rough approximation, the effect of detection volume minimization is a product of the above two factors. This is a unique feature of SPCE, not achievable in the total internal reflection fluorescence (TIRF), where there is no coupling.
FIGURE 8.
(Left) Geometric arrangements. (A) Reverse Kretschmann (RK) configuration with SPCE observation; (B) reverse Kretschmann configuration with free-space (FS) observation; (C) Kretschmann (KR) configuration with SPCE observation; and (D) Kretschmann configuration with SPCE observation. (Right) Fluorescence spectra of the Rh6G in the presence of a background (DCM in ethanol) measured at various observation/excitation configurations. (Top) Emission spectrum observed at a small angle from the excitation in RK configuration. This free-space (FS) spectrum is dominated by a background DCM emission. The Rh6G emission at 560 nm is minimal. (Middle) In the same (as in a top panel) RK configuration, the observation was made from the prism side at the SPCE angle. In this case the dominant emission is from the Rh6G, and DCM background is greatly suppressed. (Bottom) The sample was rotated to the KR configuration, and the excitation was at a SPR angle. The observation was adjusted to the SPCE angle. Now, essentially only Rh6G emission is present in the spectrum. Note also that the intensity of the SPCE signal in KR configuration is an order of magnitude greater than the intensity in RK configuration.
Number of observed molecules
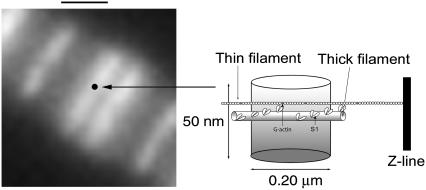
Data were always collected from the overlap zone of a myofibril. Fig. 9 (left) shows the projection of the confocal aperture on the overlap zone. Because ∼20% of muscle weight is actin, the concentration of actin in a solution of 1 mg/ml myofibrils is ∼4.6 μM. We used 0.1 μM of fluorescent phalloidin (together with 9.9 μM nonfluorescent phalloidin), i.e., there were ∼9 phalloidin molecules per actin filament. If the phalloidin was uniformly distributed, the 0.2-μm-wide detection volume would have contained ∼2 phalloidins/filament. However, because of nonhomogeneous distribution of phalloidin (Fig. 4), most of the fluorophores are located in the distal ∼⅓ of a filament. We therefore detect signal from ∼6 phalloidins/filament. Spacing between actin filaments is ∼30 nm (2). Because the thickness of the detection volume is ∼50 nm, we observe ∼2 layers of thin filaments. We conclude that we observe ∼12 actin monomers labeled with phalloidin.
FIGURE 9.
Fluorescent image of the overlap zone. The black dot is a projection of the confocal pinhole on the image plane. (Right) Schematic diagram of the voxel. The fluorescently labeled actin monomers are gray. The observational volume is ∼50 nm thick and has a diameter of ∼200 nm, corresponding to the diffraction limit of the 1.65 NA objective. The resulting detection volume is ∼2 al. Bar = 1 μm.
Confocal SPCE signal from a myofibril
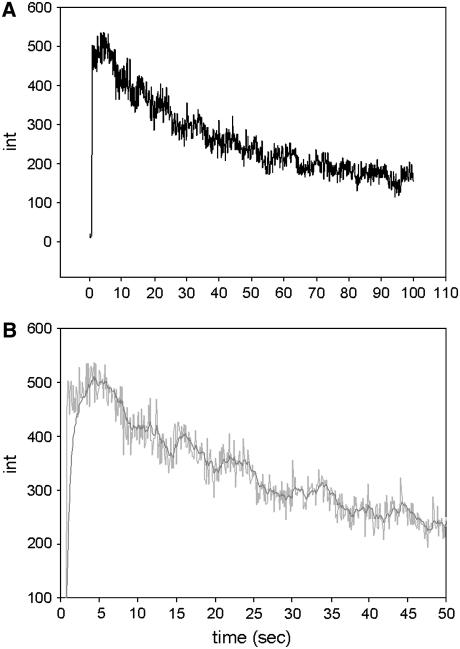
The projection of the confocal aperture was placed over the overlap zone. Typical signal obtained from a voxel located in the overlap zone is shown in Fig. 10 A. The signal/noise (S/N) ratio is determined by the rate of detection of fluorescent photons per molecule of the dye in one bin width δτ (39). Bin width is defined as the time interval into which the data collection time is subdivided. The necessary data collection time is determined by the characteristic time for relatively slow hydrolysis, i.e., ∼0.5 s (40). During this time we wish to measure at least five data points, i.e., δτ ≈ 100 ms. Each step corresponds to bleaching of one molcule (see Discussion). We detect ∼40–80 photons/molecule/bin (Fig. 10 B). Assuming Poisson-distributed shot noise as the sole noise source, the S/N ratio is ∼7.
FIGURE 10.
Confocal SPCE signal from rigor myofibril. The data were collected from the overlap zone. Myofibril labeled with 0.1 μM rhodamine-phalloidin on gold coverslips. The exciting light was perpendicular to the plane of the coverslip (p-polarization). (A) Fluorescence intensity. (B) Intensity on expanded scale: gray, original signal; dark gray, low-pass filtered.
DISCUSSION
This article reports application of SPCE to the study of muscle tissue. We have reported earlier that fluorescent microspheres were seen in a microscope under SPCE illumination (19), but this is the first account of an application to a live sample. The results make it clear that the long-term objective, to observe a single molecule of a contractile protein during contraction of muscle, is feasible. The fact that the method gives exceedingly small detection volume allows detection of a single molecule of myosin or actin in muscle. In the example used here, we observed 12 actin protomers. The instrument has enough sensitivity to detect labeling with 0.01 μM phalloidin; i.e., a single molecule can be detected.
Because the SPR angle is narrowly defined, only a fraction of the light incident on a sample in TIRF illumination is able to penetrate the gold coating in SPCE. This resulted in a decrease in photobleaching. At the same time, the S/N ratio was not affected much because of resonance plasmon coupling. The dramatic dependence of fluorescence coupling of surface plasmons on the orientation of the molecule transition moment makes the method useful in measurements of orientation changes (Fig. 7). Because muscle contraction involves rotation of myosin cross-bridges (4) and actin monomers (41), SPCE is particularly suited to studies of muscle contraction. The directional character of SPCE enables excellent suppression of unwanted noise. The microscope uses KR configuration, where the observed SPCE signal is almost not perturbed by the DCM background (Fig. 8, right, bottom panel).
The quality of SPCE image was superior to conventional epiillumination (Table 1). One would expect the thickness of the myofibrillar sample to be irrelevant to the quality of the image because myofibrils are only ∼0.5 μm thick. Apparently, this is not so; myofilament disarray is already evident at the nanometer scale. Particularly impressive was the fact that the break in the overlap zone corresponding to the M-band was clearly seen (Fig. 4). The TIRF image was equally good (Table 1), but advantages of SPCE over TIRF mentioned earlier make SPCE the method of choice for measuring rotation of single molecules. The confocal SPCE signal (Fig. 10) was measured from a rigor myofibril, but signal can easily be obtained in contracting muscle using cross-linking to inhibit shortening (14). Labeling muscle actin with phalloidin is particularly advantageous. First, labeling does not affect enzymatic properties of muscle (42,43). Second, phalloidin labels the overlap zone, an area where mechanical interaction between actin and myosin occurs (33). Third, the concentration of label is easily controlled by saturating all actins with a mixture of labeled and unlabeled phalloidins. For example, in the current experiments, we always used 0.1 μM fluorescent phalloidin and 9.9 μM unlabeled phalloidin. Because rotation of actin monomer to which phalloidin is rigidly attached parallels rotation of a cross-bridge (41), the rotational signal from phalloidin (Fig. 10) is a preferred way to follow cross-bridge rotation in muscle.
The steps visible in Fig. 10 could 1), arise from photobleaching of rhodamine, 2), represent rotational motion of the transition moment, or 3), be simply a result of noise. We think that the first is the case. Rotational motion is an unlikely reason because cross-bridges in rigor muscle do not rotate. Noise is an unlikely reason because we observe steps in nearly all experiments. Also, the number of steps roughly corresponded to the number of fluorophores in the detection volume.
Each step lasted ∼10 s and led to the loss of ∼70 cpb (Fig. 10 B), i.e., we observed ∼7000 photons from a fluorophore before it bleached out. The geometric collection efficiency of the instrument is ∼2%, i.e., a fluorophore emitted a total of ∼0.4 × 10⁶ photons before irreversible bleaching. This is consistent with known photostability of rhodamine (44).
In general, the SPCE method will find application in experiments where data from large assemblies of molecules complicate interpretation (7). Examples are single-molecule detection on cell and model membranes (45), ligand-receptor interactions in live cells (46) (e.g., insulin (47) and galanin (48) binding to receptors), involvement of protein molecules in internalization of bacteria by cells (49), monitoring the conformational fluctuations of DNA (50,51), diagnosis of prion diseases (52), behavior of myosin in muscle (6), and detection of a virus at an early phase of infection (7). The fact that SPCE quenches fluorescence from a layer ∼10 nm immediately adjacent to the surface suggests an application to the study of membranes.
Acknowledgments
This work was supported by National Institutes of Health RO1 AR048622 and NCI-CA114460.
This article is dedicated to Prof. M. F. Morales on the occasion of his birthday.
References
- 1.Minton, A. P. 1998. Molecular crowding: analysis of effects of high concentrations of inert cosolutes on biochemical equilibria and rates in terms of volume exclusion. Methods Enzymol. 295:127–149. [DOI] [PubMed] [Google Scholar]
- 2.Bagshaw, C. R. 1982. Muscle Contraction. Chapman & Hall, London.
- 3.Arakawa, T., and S. N. Timasheff. 1985. Theory of protein solubility. Methods Enzymol. 114:49–77. [DOI] [PubMed] [Google Scholar]
- 4.Hopkins, S. C., C. Sabido-David, J. E. Corrie, M. Irving, and Y. E. Goldman. 1998. Fluorescence polarization transients from rhodamine isomers on the myosin regulatory light chain in skeletal muscle fibers. Biophys. J. 74:3093–3110. [DOI] [PMC free article] [PubMed] [Google Scholar]
- 5.Borejdo, J., and I. Akopova. 2003. Orientational changes of cross-bridges during single turnover of ATP. Biophys. J. 84:2450–2459. [DOI] [PMC free article] [PubMed] [Google Scholar]
- 6.Borejdo, J., A. A. Shepard, I. Akopova, W. Grudzinski, and J. Malicka. 2004. Rotation of the lever-arm of myosin in contracting skeletal muscle fiber measured by two-photon anisotropy. Biophys. J. 87:3912–3921. [DOI] [PMC free article] [PubMed] [Google Scholar]
- 7.Eigen, M., and R. Rigler. 1994. Sorting single molecules: application to diagnostics and evolutionary biotechnology. Proc. Natl. Acad. Sci. USA. 91:5740–5747. [DOI] [PMC free article] [PubMed] [Google Scholar]
- 8.Levene, M. J., J. Korlach, S. W. Turner, M. Foquet, H. G. Craighead, and W. W. Webb. 2003. Zero-mode waveguides for single-molecule analysis at high concentrations. Science. 299:682–686. [DOI] [PubMed] [Google Scholar]
- 9.Edel, J. B., M. Wu, B. Baird, and H. G. Craighead. 2005. High spatial resolution observation of single-molecule dynamics in living cell membranes. Biophys J. 88:L43–L45. [DOI] [PMC free article] [PubMed] [Google Scholar]
- 10.Hecht, B., B. Sick, U. P. Wild, V. Deckert, R. Zenobi, O. J. F. Martin, and D. W. Pohl. 2000. Scanning near-field optical microscopy with aperture probes: Fundamentals and applications. J. Chem. Phys. 112:7761–7774. [Google Scholar]
- 11.Dunn, R. C. 1999. Near-field scanning optical microscopy. Chem. Rev. 99:2891–2927. [DOI] [PubMed] [Google Scholar]
- 12.Betzig, E., and R. J. Chichester. 1993. Single molecules observed by near field scanning optical microscopy. Science. 262:1422–1425. [DOI] [PubMed] [Google Scholar]
- 13.Borejdo, J., D. S. Ushakov, and I. Akopova. 2002. The essential light chains 1 and 3 rotate differently during muscle contraction. Biophys. J. 82:362a. (Abstr.) [DOI] [PMC free article] [PubMed] [Google Scholar]
- 14.Borejdo, J., J. Talent, I. Akopova, and T. P. Burghardt. 2006. Rotations of a few cross-bridges in muscle by confocal total internal reflection microscopy. Biochim. Biophys. Acta. 1763:137–140. [DOI] [PubMed] [Google Scholar]
- 15.Ruckstuhl, T., and S. Seeger. 2004. Attoliter detection volumes by confocal total-internal-reflection fluorescence microscopy. Optic Lett. 29:569–571. [DOI] [PubMed] [Google Scholar]
- 16.Gryczynski, I., J. Malicka, Z. Gryczynski, and J. R. Lakowicz. 2004. Surface plasmon-coupled emission with gold films. J. Phys. Chem. 108:12568–12574. [DOI] [PMC free article] [PubMed] [Google Scholar]
- 17.Gryczynski, I., J. Malicka, E. M. Goldys, J. R. Lakowicz, N. Calander, and Z. Gryczynski. 2005. Two-photon induced surface plasmon-coupled emission. Thin Solid Films. 491:173–176. [DOI] [PMC free article] [PubMed] [Google Scholar]
- 18.Yu, F., B. Persson, S. Lofas, and W. Knoll. 2004. Attomolar sensitivity in bioessays based on Surface Plasmon Fluorescence Spectroscopy. J. Am. Chem. Soc. 126:8902–8903. [DOI] [PubMed] [Google Scholar]
- 19.Gryczynski, Z., J. Borejdo, E. Matveeva, N. Calander, R. Grygorczyk, J. Harper, and I. Gryczynski. 2006. Minimization of detection volume by surface plasmon-coupled emission. SPIE Proc. S1–S10. [DOI] [PubMed]
- 20.Gryczynski, Z., J. Borejdo, N. Calander, E. G. Matveeva, and I. Gryczynski. 2006. Minimization of detection volume by surface plasmon-coupled emission. Anal. Biochem. [Epub ahead of print]. [DOI] [PubMed]
- 21.Burghardt, T. P., J. E. Charlesworth, M. F. Halsetad, J. E. Tarara, and K. Ajtai. 2006. In situ fluorescent protein imaging with metal film enhanced total internal reflection microscopy. Biophys. J. 90:4662–4671. [DOI] [PMC free article] [PubMed] [Google Scholar]
- 22.Enderlein, J., and T. Ruckstuhl. 2005. The efficiency of surface-plasmon coupled emission for sensitive fluorescence detection. Opt. Express. 13:8855–8865. [DOI] [PubMed] [Google Scholar]
- 23.Matveeva, E., Z. Gryczynski, I. Gryczynski, J. Malicka, and J. R. Lakowicz. 2004. Myoglobin immunoassay utilizing directional surface plasmon-coupled emission. Anal. Chem. 76:6287–6292. [DOI] [PMC free article] [PubMed] [Google Scholar]
- 24.Malicka, J., I. Gryczynski, Z. Gryczynski, and J. R. Lakowicz. 2004. Surface plasmon-coupled ultraviolet emission of 2,5-diphenyl-1,3,4-oxadiazole. J. Phys. Chem. B. 108:19114–19118. [DOI] [PMC free article] [PubMed] [Google Scholar]
- 25.Gryczynski, I., J. Malicka, W. Jiang, H. Fischer, W. C. W. Chan, Z. Gryczynski, W. Grudzinski, and J. R. Lakowicz. 2005. Surface plasmon-coupled emission of quantum dots. J. Phys. Chem. B. 109:1088–1093. [DOI] [PubMed] [Google Scholar]
- 26.Borejdo, J., O. Assulin, T. Ando, and S. Putnam. 1982. Cross-bridge orientation in skeletal muscle measured by linear dichroism of an extrinsic chromophore. J. Mol. Biol. 158:391–414. [DOI] [PubMed] [Google Scholar]
- 27.Harada, Y., K. Sakurada, T. Aoki, D. D. Thomas, and T. Yanagida. 1990. Mechanochemical coupling in actomyosin energy transduction studied by in vitro movement assay. J. Mol. Biol. 216:49–68. [DOI] [PubMed] [Google Scholar]
- 28.Gryczynski, Z., I. Gryczynski, E. Matveeva, J. Malicka, K. Nowaczyk, and J. R. Lakowicz. 2004. Surface-plasmon coupled emission: new technology for studying molecular processes. Methods Cell Biol. 75:73–110. [DOI] [PubMed] [Google Scholar]
- 29.Gryczynski, I., J. Malicka, Z. Gryczynski, and J. R. Lakowicz. 2004. Radiative decay engineering 4. Experimental studies of surface plasmon-coupled directional emission. Anal. Biochem. 324:170–182. [DOI] [PMC free article] [PubMed] [Google Scholar]
- 30.Axelrod, D. 1989. Total internal reflection fluorescence microscopy. Methods Cell Biol. 30:245–270. [DOI] [PubMed] [Google Scholar]
- 31.Calander, N. 2005. Surface plasmon-coupled emission and Fabry-Perot resonance in the sample layer: A theoretical approach. J. Phys. Chem. B. 109:13957–13963. [DOI] [PubMed] [Google Scholar]
- 32.TFC-Calc. Optical Coating Design Software. Software Spectra, Portland, OR.
- 33.Ao, X., and S. S. Lehrer. 1995. Phalloidin unzips nebulin from thin filaments in skeletal myofibrils. J. Cell Sci. 108:3397–3403. [DOI] [PubMed] [Google Scholar]
- 34.Axelrod, D., E. H. Hellen, and R. M. Fulbright. 1992. Total internal reflection fluorescence. In Topics in Fluorescence Spectroscopy: Biochemical Applications, Vol. 3. J. R. Lakowicz, editor. Plenum Press, New York. 289–343.
- 35.Weber, W. H., and C. F. Eagen. 1979. Energy transfer from an excited dye molecule to the surface plasmons of an adjacent metal. Opt. Lett. 4:236–238. [DOI] [PubMed] [Google Scholar]
- 36.Ford, G. W., and W. H. Weber. 1984. Electromagnetic interactions of molecules with metal surfaces. Phys. Rep. 113:195–287. [Google Scholar]
- 37.Burghardt, T. P., and N. L. Thompson. 1984. Effect of planar dielectric interfaces on fluorescence emission and detection. Evanescent excitation with high-aperture collection. Biophys. J. 46:729–737. [DOI] [PMC free article] [PubMed] [Google Scholar]
- 38.E. H. Hellen and D. Axelrod. 1987. Fluorescence emission at dielectric and metal-film interfaces. J. Opt. Soc. Am. B. 4:337–350. [Google Scholar]
- 39.Magde, D., E. L. Elson, and W. W. Webb. 1974. Fluorescence correlation spectroscopy. II. An experimental realization. Biopolymers. 13:29–61. [DOI] [PubMed] [Google Scholar]
- 40.Potma, E. J., I. A. van Graas, and G. J. Stienen. 1994. Effects of pH on myofibrillar ATPase activity in fast and slow skeletal muscle fibers of the rabbit. Biophys. J. 67:2404–2410. [DOI] [PMC free article] [PubMed] [Google Scholar]
- 41.Borejdo, J., A. Shepard, D. Dumka, I. Akopova, J. Talent, A. Malka, and T. P. Burghardt. 2004. Changes in orientation of actin during contraction of muscle. Biophys. J. 86:2308–2317. [DOI] [PMC free article] [PubMed] [Google Scholar]
- 42.Bukatina, A. E., F. Fuchs, and S. C. Watkins. 1996. A study on the mechanism of phalloidin-induced tension changes in skinned rabbit psoas muscle fibres. J. Muscle Res. Cell Motil. 17:365–371. [DOI] [PubMed] [Google Scholar]
- 43.Prochniewicz-Nakayama, E., T. Yanagida, and F. Oosawa. 1983. Studies on conformation of F-actin in muscle fibers in the relaxed state, rigor, and during contraction using fluorescent phalloidin. J. Cell Biol. 97:1663–1667. [DOI] [PMC free article] [PubMed] [Google Scholar]
- 44.Eggeling, C., J. Widengren, R. Rigler, and C. A. M. Seidel. 1998. Photobleaching of fluorescent dyes under conditions used for single-molecule detection: evidence of two-step photolysis. Anal. Chem. 70:2651–2659. [DOI] [PubMed] [Google Scholar]
- 45.Schwille, P., J. Korlach, and W. W. Webb. 1999. Fluorescence correlation spectroscopy with single-molecule sensitivity on cell and model membranes. Cytometry. 36:176–182. [DOI] [PubMed] [Google Scholar]
- 46.Pramanik, A. 2004. Ligand-receptor interactions in live cells by fluorescence correlation spectroscopy. Curr. Pharm. Biotechnol. 5:205–212. [DOI] [PubMed] [Google Scholar]
- 47.Zhong, Z. H., A. Pramanik, K. Ekberg, O. T. Jansson, H. Jornvall, J. Wahren, and R. Rigler. 2001. Insulin binding monitored by fluorescence correlation spectroscopy. Diabetologia. 44:1184–1188. [DOI] [PubMed] [Google Scholar]
- 48.Pramanik, A., M. Olsson, U. Langel, T. Bartfai, and R. Rigler. 2001. Fluorescence correlation spectroscopy detects galanin receptor diversity on insulinoma cells. Biochemistry. 40:10839–10845. [DOI] [PubMed] [Google Scholar]
- 49.Duensing, T. D., and J. P. van Putten. 1997. Vitronectin mediates internalization of Neisseria gonorrhoeae by Chinese hamster ovary cells. Infect. Immun. 65:964–970. [DOI] [PMC free article] [PubMed] [Google Scholar]
- 50.Grunwell, J. R., J. L. Glass, T. D. Lacoste, A. A. Deniz, D. S. Chemla, and P. G. Schultz. 2001. Monitoring the conformational fluctuations of DNA hairpins using single-pair fluorescence resonance energy transfer. J. Am. Chem. Soc. 123:4295–4303. [DOI] [PubMed] [Google Scholar]
- 51.Kinjo, M., G. Nishimura, T. Koyama, U. Mets, and R. Rigler. 1998. Single-molecule analysis of restriction DNA fragments using fluorescence correlation spectroscopy. Anal. Biochem. 260:166–172. [DOI] [PubMed] [Google Scholar]
- 52.Giese, A., J. Bieschke, M. Eigen, and H. A. Kretzschmar. 2000. Putting prions into focus: application of single molecule detection to the diagnosis of prion diseases. Arch. Virol. Suppl. 16:161–71. [DOI] [PubMed] [Google Scholar]


