Abstract
An equation for membrane voltage is derived that takes into account the electrogenicity of the Na/K pump and is valid dynamically, as well as in the steady state. This equation is incorporated into a model for the osmotic stabilization of cells. The results emphasize the role of the pump and membrane voltage in lowering internal Cl− concentration, thus making osmotic room for vital substances that must be sequestered in the cell.
Keywords: internal Cl‖modified Goldman–Hodgkin–Katz equation
A fundamental problem for cells with fragile membranes is the control of their volume (1). A cell must concentrate inside itself substances that are essential for its existence, e.g., DNA, proteins, amino acids, and sugars. The osmotic activity of these internally sequestered substances, which are not free to leave the cell, creates a swelling tendency. The pressures created by the osmolarity differences between inside and out can easily reach an atmosphere or more, whereas the plasma membrane is only about as strong as a soap bubble. In bacteria and plant cells, swelling is prevented by a strong cell wall that surrounds the plasma membrane. Animal cells have no cell wall and have adopted a different strategy to control the swelling tendency. They reduce their internal ionic content to make “osmotic room” for the internally sequestered substances, thus reducing the osmolarity differences between inside and outside to zero. Over many years, it became clear that the osmotic stabilization of a living animal cell was related to the active transport of Na+ from and K+ into the cell (2–5). The first mathematical model based on this general idea was the lucid pump-leak model of Tosteson and Hoffman (1), so named because the Na/K pump counteracts the tendency of Na+ to leak into and K+ out of a cell. Their model assumed that the cell was in a steady state, and it successfully accounted for volume control in high- and low-K red blood cells. Tosteson (6) extended this model to the dynamic case, as did a later model by Jakobsson (7). Lev et al. (8) have formulated a model that includes many ion transport mechanisms, including ion exchanges, but does not deal directly with the relation of the Na/K pump to osmotic stabilization.
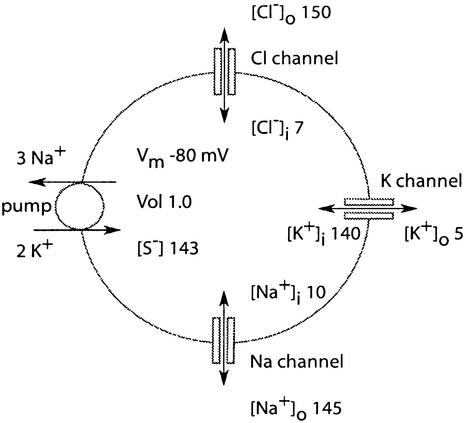
Aside from its intrinsic fascination, there are two reasons for revisiting the question of osmotic stabilization. First, there is a lingering cloudiness about the mechanism by which stabilization is achieved. This paper emphasizes the use of membrane voltage as a means to lower internal Cl− concentration, thus making osmotic room for the vital substances that are sequestered internally. Second, previous models have either been confined to the steady state (1) or have been complicated by the lack of a simple equation for membrane voltage (Vm) that includes the contribution of the electrogenic Na/K pump. The pump (Fig. 1) generates a small electric current by extruding three Na+ ions while taking in only two K+ ions in each cycle (9). Mullins and Noda (10) modified the Goldman–Hodgkin–Katz (GHK) equation (11, 12) for membrane voltage to include a term for the pump, but their equation is valid only when ion concentrations are not changing. An equation is derived here that takes the pump current into account and is valid dynamically as well as in the steady state. So far as I am aware, this is the first equation of its kind that is explicitly soluble for Vm. With the incorporation of this equation, the model presented here is valid at all times, providing analytical solutions for volume, Vm, and ion concentrations. It is easily handled by a small computer.
Figure 1.
The model cell in normal conditions. Its membrane contains three types of channels, Cl, K, and Na, which mediate passive movement of these ions. Ion concentrations are in mM. Permeability of the resting cell is PK 1.0, PNa 0.02, and PCl 2.0 (in arbitrary units). An ATP-driven pump extrudes three Na+ ions and imports two K+ ions per cycle. The resting potential is −80 mV, and the resting volume is 1.0 (arbitrary units). Internal [Cl−] is only 7 mM, making osmotic room for internally sequestered substances, S−, at a concentration of 143 mM.
The Model
The model cell has properties similar to those of frog skeletal muscle fibers, which were intensively studied by Hodgkin and Horowicz (13).
Water Permeability.
The cell has high water permeability and is always at osmotic equilibrium (equilibration is instantaneous on the time scale of the calculations).
Osmotic Equilibrium.
The requirement for osmotic equilibrium (and stable volume) is that osmolarityout = osmolarityin. This equality must be so at all times, because the fragile plasma membrane of the cell cannot support a pressure difference.
Electroneutrality (Approximate).
For a cell of normal size, if the membrane voltage has a reasonable (millivolt scale) value, the cationic charge must be almost equal to anionic charge, on both sides of the membrane. The exact equations for a cell with a membrane voltage Vm (voltage inside − voltage outside) are
 |
1 |
and
 |
2 |
where Cm (C × V−1) is membrane capacitance. Vm × Cm is the small excess of charge that makes the membrane voltage, an excess of negative charge on one side and positive on the other. It is negligibly small compared with the ∑ cationic charge or ∑ anionic charge, so, at the beginning of a calculation it is justified to assume perfect electroneutrality; i.e., ∑ cationic charge is set equal to ∑ anionic charge both inside and outside. The excess of charge, Vm × Cm, is not used in the computations.
Ion Flux Through Channels.
Following the reasoning given in Appendix, the currents (C⋅cm−2⋅s−1) of the permeant ion species through channels in the membrane are given by the equations
 |
3a |
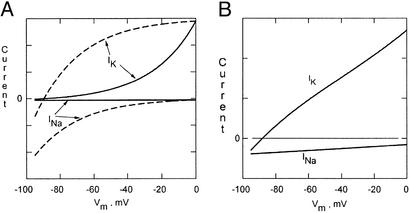
where PX (cm⋅s−1) is the number of pores/cm2 times the permeability of a single pore ρK (cm3⋅pore−1⋅s−1). F (C⋅mol−1) is Faraday's constant, zX (dimensionless) is the magnitude of the valence (1 for all ions considered here), R is the gas constant, and T is the absolute temperature. ψ (dimensionless) is the ratio of potential (zx × Vm × F) to random thermal energy (R × T). The current voltage (I–Vm) relations for Na+ and K+ are shown in Fig. 2. Eqs. 3 are interpretable, for Na+ and K+, as a voltage-independent influx, and an efflux that varies exponentially with voltage, whereas for Cl−, the opposite is true. Alterations of the model that use other single-channel I–V relations are described below.
Figure 2.
Theoretical current–voltage relations for open Na and K channels. (A) The solid curves are from Eqs. 3a (the Na curve is the almost horizontal line, just negative to zero), and the dashed curves from Eqs. 3b. For both sets of curves, INa = −IK at −80 mV; i.e., the resting potential is −80 mV. (B) Approximately linear current–voltage relations, generated from Eqs. 8. These relations are most similar to the experimentally observed curves, but the model works well when any of the three pairs of current–voltage relations are used, as described in the text.
Ion Flux Through the Na/K Pump.
The equations for Na+ and K+ flux (mol⋅cm−2⋅s−1) through the pump are
 |
4 |
where [Na+]c is the concentration for half-maximal occupation of a Na+-binding site on the pump. For very low concentration the pump rate thus depends on the third power of the [Na+]i. The factor 2.17, the pump rate coefficient, was determined empirically. For simplicity, pump rate is a linear function of ATP concentration and is independent of [K+]o. Neither of these simplifications matters for present purposes. The minus sign in the second equation shows that Na and K flux are in opposite directions. The Na/K pump ratio is normally 3/2 (9). Pump current (C⋅cm−2⋅s−1) is
 |
5 |
Membrane Voltage.
To obtain an easily calculable model, it is necessary to have an equation for membrane voltage that takes into account the contribution of the Na/K pump. Further, the equation must be compatible with the equations for the current of each ion species. The following derivation uses the current–voltage relations shown above (Eqs. 3a) to get an equation for Vm that includes a term for pump activity. As is the case with the GHK equation and the Mullins–Noda equation, the equation derived here is valid only when Vm changes slowly enough that capacitive current is negligible. The derivation assumes the usual relation between net membrane current and the rate of change of Vm:
 |
Expanding the currents with Eqs. 3a and assuming that Vm is not changing gives
 |
 |
This equation attributes all of the voltage dependence of the fluxes to the efflux (Na+ and K+), or to the influx (Cl−), as described in Appendix. It rearranges to
 |
 |
Rearranging and taking the log of both sides gives
 |
6a |
Internally Sequestered Impermeant Anions.
The dominant internal anion is assumed to be an S− molecule that bears a charge of −1e. This assumption is made for simplicity, but many other choices are possible. For example, S could be composed of two species present at equal concentrations, one bearing a charge of 0 and the other a charge of −2e. Jakobsson (7) has studied the effect of altering the valence of internally sequestered substances.
Volume.
Volume is normalized relative to the steady-state volume in standard ionic conditions, with 3 mM internal ATP.
Sequence of Computations.
When the model is set running, (i) Vm is calculated from the permeabilities and the initially assigned values for ion concentrations and pump flux. (ii) The passive flux of each ion species is calculated by using Eqs. 3a with the present values of internal and external concentration and the just calculated value of Vm. (iii) The pump fluxes of Na+ and K+ are calculated from Eqs. 4 and 5. (iv) Net fluxes are calculated by summing passive flux and pump flux (which is zero for Cl−). (v) By conceptually delaying water flux for the moment (handled in steps vi and vii), the would-be osmolarity is calculated from the initial concentrations, adjusted by the net fluxes just calculated. Water movement is handled implicitly, by (vi) adjusting the volume as required to make internal osmolarity equal to external, and (vii) by calculating the new values of ion concentrations using this volume. (i) Using the new concentrations, Vm is calculated, and the cycle repeats.
Alternative I–V Relations for the Channels.
Eqs. 3a above predict the current (I) as a function of voltage (Vm) through conducting channels as given by the solid curves in Fig. 2A for K+ and Na+ (INa is the almost horizontal line). The curves have been scaled according to the resting permeabilities, so that at the resting potential inward INa is equal in magnitude to the resting potential outward IK. These curves are not much like the I–V curves of known channels, and two different paths were taken to assess the importance of the disparity. The first path taken was to derive an alternative form of the I–V relations that, for cations, attributes all voltage dependence to the influx (rather than to the efflux as in Eqs. 3a), and the opposite for Cl−.
 |
3b |
Using Eqs. 3b, the equation derived for Vm is
 |
6b |
The I–V relations for Na+ and K+ using Eqs. 3b are shown as dashed curves in Fig. 2A. At the resting potential, where INa is equal but opposite to IK, both currents are much larger than with Eqs 3a. To achieve stability, it is necessary to increase the pump rate coefficient by a factor of 13. Once this is done, calculations with Eqs. 3b and 6b give results that are very similar to the ones with Eqs. 3a and 6a.
The second path for exploring the importance of I–V shape is to make the PNa and PK terms in Eqs. 3a voltage dependent in such a way as to approximately linearize the I–V relations.
 |
7 |
where P0K is normally 1 and P0Na is normally 0.02. The term e−0.71ψ approximately linearizes PK and (70 − Vm) approximately linearizes PNa. The factors 0.2 in the PK equation and 106.4 in the PNa equation were chosen to keep the resting potential unchanged at −80 mV. Combining Eqs. 3a and Eq. 7 gives
 |
8 |
These I–V curves are shown in Fig. 2B. Thanks to the voltage-dependent permeabilities, both IK and INa are approximately linear over the voltage range in which the model is used. When Eqs. 8 for currents are used collectively with Eq. 6a for Vm, the results are qualitatively similar to those with Eqs. 3a and 6a. Thus, all three sets of I–Vm relations give similar results, leading to the conclusion that the shape of the I–V relation does not affect the behavior of the model in essential ways.
Validation of the Model.
A number of tests were performed to ensure that the model gives reasonable and internally consistent results, including the following. The first was a test of the stability of the model cell in normal conditions. In a steady state, concentrations, volume, and Vm should not change. When the model is run for the equivalent of 100,000 min, none of these variables changed detectably. This result shows that the equations are compatible with each other and that the model cell is completely stable. A second test was performed to observe the effects of turning off the pump. Because the pump is electrogenic, turning it off should cause a small positive change in Vm. A quick +2-mV change was observed, as expected, and slower changes followed as described below. The pump rate is faster if the internal [Na+] is high, making the quick jump in Vm larger. Changes of ion concentrations, addition of external nonelectrolytes, and permeability changes all gave results that closely resembled the behavior of living cells as described in the literature (6, 7, 13).
Results
The Mutual Interaction of Cl− and Membrane Potential.
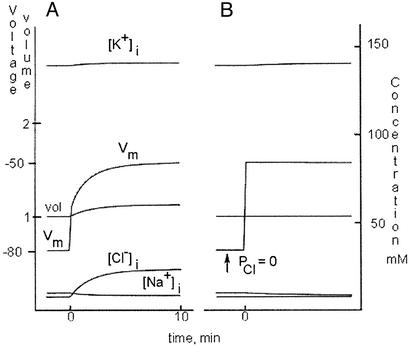
The experiments of this section help to understand the influence of Cl− on Vm, and, on the other side of the coin, the influence of Vm on Cl− distribution. In Fig. 3A, Vm is changed by increasing [K+]o from 5 to 20 mM at time 0, with a compensatory decrease of [Na+]o from 145 to 130 mM. Vm quickly changes from −80 to −64 mV, followed by a slow climb to −50 mV. The quick phase is predicted by Eq. 6a, assuming that all internal concentrations are the same before and just after the change. This phase is only about half the alteration of EK calculated from the Nernst equation, because current through Cl channels pulls Vm toward the as-yet-unchanged Cl− equilibrium potential (ECl), −80 mV. Cl−, however, is no longer in equilibrium: the less-negative interior allows Cl− to move inward. As [Cl−]i increases, both the ECl and Vm drift in the positive direction, each influenced by the other. Finally, a new equilibrium for Cl− is achieved at −50 mV where ECl and Vm are equal. Cl− is not pumped in any way into the model cell and it must come to equilibrium (unless its permeability is zero) at the voltage dictated by the concentrations and permeabilities of the pump-regulated ions, Na+ and K+. There is a small increase in volume, accounted for by an increase in the cell's content of K+ and Cl−.
Figure 3.
Cl permeability and membrane voltage. Traces were generated by the model in the text to simulate a classical experiment of Hodgkin and Horowicz (13). (A) To the left of 0 on the time axis, the cell is in normal conditions. At 0 min, [K+]o was increased from 5 to 20 mM, causing a quick change of Vm. A slower change follows as Cl−, no longer at equilibrium, drifts into the cell, causing a small volume increase. During the interval when Cl− is not in equilibrium (0 min to ≈9 min), there is a Cl− current that keeps Vm negative to its steady-state level, −50 mV. The current weakens with time as equilibrium ([Cl−]i = 23 mM, Vm = −50 mV) is approached. (B) The experiment is repeated after setting PCl to zero at the time indicated. When [K+]o is increased to 20 mM at time 0, Vm rises within milliseconds to −50 mV. The time course is quicker than in A because there is no Cl− current. Notice that [Cl−]i, the very bottom trace, and volume do not change.
If the experiment is repeated with PCl = 0 the results are quite different. In Fig. 3B the trace begins in standard conditions, and PCl is lowered at the time indicated. As predicted by Eq. 6a, there is no change in Vm, because Cl− is at equilibrium and the net flux through an open Cl channel is zero. When [K+]o is increased ([Na+]o decreased in compensation), Vm jumps immediately to −50 mV, with no delay because of Cl− readjustments. Note that there is a small volume increase with PCl = 2, but none when PCl = 0. These experiments are based on the classic work of Hodgkin and Horowicz (13), and show clearly that [Cl−]i in the model cell is set in the steady state by Vm, which is, in turn, set (in the steady state) by the gradients and permeabilities of Na+ and K+. These results also show that when (and only when) it is not in equilibrium, Cl− has an influence on Vm by means of the current flowing through open Cl channels. When Cl− is at equilibrium (ECl = Vm) the current is zero (Eqs. 3).
The Pump, Cl− Ion, and Cell Volume.
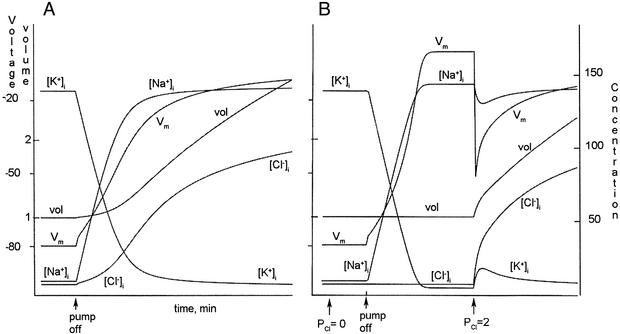
The influence of the pump on cell volume is made clear by the experiment in Fig. 4A. The model cell is in standard conditions until the arrow, when the pump is turned off. At this point, [Na+]i begins to rise immediately and [K+]i begins to fall. Vm quickly goes positive by ≈2 mV and then rises more slowly toward 0 mV. Volume and [Cl−]i rise after a lag, i.e., with a sigmoid time course. Cl− movements are controlled by Vm and the rapid phase of Cl− entry does not occur until Vm has fallen to a low value, in response to falling [K+]i. The internal Cl− concentration slowly approaches 150 mM, the concentration in the extracellular solution, while the volume continues to climb toward infinity. The rate of volume increase slows as the surface-to-volume ratio of the cell decreases, but the increase is inexorable: with the pump stopped, there is no equilibrium until the volume is infinite. In these conditions there is no osmotic room for the vital S− substances in the cell, but they are trapped inside nonetheless. The result is that swelling continues until S− is infinitely dilute.
Figure 4.
The pump, Cl−, and cell volume. (A) Turning off the pump of an unperturbed cell leads to an exchange of Na+ for K+ internally. As Vm rises, Cl− is no longer in equilibrium and enters the cell. The volume increases as the result of increased cell content of Na+ and Cl− (Na+ enters faster than K+ is lost). Swelling continues, in theory, until volume is infinite. (B) PCl is decreased to zero at the arrow. When the pump is turned off, the changes are similar to those in A except that Cl− cannot enter and volume remains constant. On restoring PCl to 2, Vm jumps negative, pulled by Cl− current, then moves toward zero as Cl− equilibrates. The negative jump of Vm causes a transient increase in [K+]i as internal negativity pulls K+ inward. The quick volume increase causes a transient dilution of Na+. Volume then increases slowly toward infinity, as Na+ and Cl− enter the cell. The total cell content of S− remains fixed, but [S−] falls as volume increases.
The crucial importance of low internal [Cl−] to osmotic stability is made evident when this experiment is repeated with PCl made zero by adding an imaginary toxin. In Fig. 4B the toxin is added to a cell in standard conditions at the time indicated (PCl− > 0), producing no detectable effect because Cl− is in equilibrium. At the second arrow the pump was turned off, causing (i) an immediate efflux of K+; (ii) an immediate influx of Na+; and (iii) a small quick jump of Vm, followed by a slower increase toward 0 mV that is mainly the result of falling [K+]i. Thanks to the absence of Cl− permeability, [Cl−]i does not change. Most importantly for the present argument, there is no volume change. It is important to remember that [Cl−]i was initially low in the cell, making osmotic room for S−. Volume remains normal (1.0) because Cl− cannot enter.
After the model reaches a steady state, the imaginary toxin is removed (PCl = 2). Vm jumps to −68 mV thanks to ICl (ECl is −80 mV) and then rises toward zero as Cl− enters the cell. The most important point is that volume rises concurrent with the entry of Cl− and continues to rise until S− is infinitely dilute. There is a transient increase in [K+]i as internal negativity draws K+ into the cell. The transient decrease of [Na+]i observed is simply because of dilution: volume rises faster than Na+, with its limited permeability, can follow.
Discussion
The central problem in stabilizing a cell osmotically arises from the need to make osmotic room for vital substances that the cell must retain internally. A relatively easy path through the thicket of pumps, channels, and voltages that accomplishes this goal is the following: (i) The cell makes osmotic room internally by driving most of the Cl− out of the cell. (ii) With low [Cl−] inside, electroneutrality is achieved by placing negative charges on some of the vital substances that are retained inside. (iii) The force for driving Cl− out of the cell is internally negative membrane voltage. Cl− moves through the membrane via Cl-selective channels. (iv) The membrane voltage is made by (1) exchanging K+ for Na+ internally (osmotically neutral) and (2) installing K+-selective channels in the membrane.
Regarding points i and iii, why does the cell use membrane voltage rather than an ATP-driven Cl− pump? There are, at best, few examples of ATP-driven Cl− pumps. This paucity may simply be an evolutionary development from bacteria, which have a very negative internal membrane voltage (necessary for making ATP), and thus have no need for a Cl− pump: internal negativity is sufficient to drive Cl− out. For the purpose of lowering Cl− concentration, there is little advantage in making voltage more negative than about −70 mV, because at this point internal Cl− is 14× lower than outside (assuming Cl− is in equilibrium). It might be anticipated that metabolically active cells, like skeletal and cardiac muscle cells, and neurons, with need for a lot of osmotic room internally, would have quite negative membrane voltages, whereas metabolically inactive cells, e.g., red blood cells, would (and do) have small membrane voltages.
The essential role of internal Cl− and the vital internal substances (S−) in osmotic stabilization is emphasized by the following equation, which can be derived from the equations given above (cf. Jakobsson, ref. 7):
 |
where [S−]1.0 is the concentration of S− when the volume equals 1.0 (143 mM in the model). The equation makes it clear that there are two ways to lower volume. The first is to lower [Cl−]i, which is normally accomplished by making the membrane voltage negative, as described above. The second method is to lower [S−]i. This method is used by ischemic heart cells (14) and glial cells (15), which capture or release amino acids or inositol to regulate internal osmolarity.
An alternative qualitative description of cellular osmotic stabilization is that of a double Donnan equilibrium (5). Thus, Na+, although recognized as permeant, is said to be an effectively impermeant external species thanks to the operation of the pump, thus offsetting the vital impermeant substances saved inside. This explanation does not seem completely satisfactory, because one could argue on the same grounds that K+, although much more permeable than Na+, is an effectively impermeable internal species thanks to the pump, offsetting Na+ outside, and leaving the internal substances uncompensated.
Although most (possibly all) cells use the mechanism described for lowering internal Cl− concentration to make osmotic room, it is clear that Cl− is not in equilibrium in all cells. An example is the squid giant axon, in which [Cl−] is much higher than the equilibrium level (16), presumably in part to increase internal conductance.
Acknowledgments
I thank Dr. David Gadsby and Dr. Paul DeWeer for discussion and careful reading of the manuscript. This work was supported by National Institutes of Health Grant NS 12547.
Abbreviation
- GHK
Goldman–Hodgkin–Katz
A Gas-Law Model for Membrane Flux, the Equilibrium Potential of Ions, and the Membrane Voltage.
An idealized model for flux of ions through a membrane can be based on the physical picture used in deriving the gas laws, with the addition of a membrane voltage.
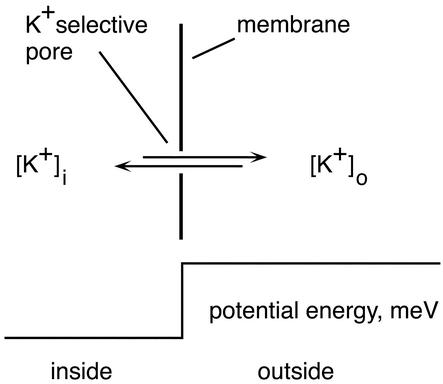 |
An ideally thin membrane separates an inside compartment from an outside one, each compartment containing a different concentration of an ion (K+ taken as a specific example). There is a membrane voltage (Vm) with external voltage defined as zero. The potential energy of a K+ ion because of the voltage is Vm × the charge of a K+ ion, and is drawn for Vm negative. The membrane is infinitely thin and contains a single pore that is infinitesimal in length and is perfectly selective for K+. The pore is so short that no interaction occurs with the selected ion. Ions are present inside and out at the concentrations [K+]i and [K+]o. The objective is to obtain current–voltage relations from this physical model and to use these relations to derive an equation for membrane voltage (Eqs. 6a or 6b in the text) that includes the effect of the current generated by the Na/K pump. To show that the physical model is reasonable, it will be used in this appendix to derive two well known equations, the Nernst equation for the equilibrium potential of an ion (K+), and the GHK equation (11,12) for membrane voltage.
When Vm is negative, K+ ions that arrive at the outer side of the pore and have the proper trajectory simply pass on through: all of the ions have enough energy to fall down the potential hill created by the membrane voltage. The fraction of the ions that have the proper trajectory is proportional to [K+]o and independent of Vm. This fraction and other considerations, e.g., the ion velocity, determine the permeability of a (single) pore, ρK (cm3⋅s−1⋅pore−1). Thus
 |
Similarly, out-moving ions with the proper trajectory arrive at the inner end of the pore at a rate proportional to the internal concentration. In this case, however, only a fraction of the ions have sufficient energy to jump up the potential hill created by the membrane voltage. This fraction is given by the Boltzmann factor eψ (see Eqs. 3a above):
 |
At −61 mV (37°C), for example, only 1 K+ ion in 10 can jump up the barrier and pass from inside to outside. At a specific membrane voltage, called EK (the potassium equilibrium potential), the influx and the efflux are equal for given concentrations of K+ inside and out, and there is equilibrium. If Vm = EK,
 |
or
 |
Taking the natural logarithm of both sides yields the Nernst equation
 |
If the internal voltage is positive rather than negative
 |
which again yields the Nernst equation.
This model can be extended to obtain the GHK equation. The requirement for an unchanging voltage is that the net current through the membrane be zero:
 |
Using the gas-law picture for flux through pores selective for Na+, K+, and Cl−, the sum of currents becomes
 |
 |
at negative voltage. Here, PK is the number of K pores/cm2 × ρK, the permeability of a single K pore, and similarly for the other pores. Note that for the negative Cl− ion the energy hill is reversed: inward flux is reduced by the negative internal voltage. Consequently the influx term PCl[Cl−]o is multiplied by eψ. At positive voltage,
 |
 |
Both of these equations rearrange to
 |
and taking the logarithm of both sides gives the GHK equation,
 |
where z is 1. More generally, z must be the same for all ions considered.
References
- 1.Tosteson D C, Hoffman J F. J Gen Physiol. 1960;44:169–194. doi: 10.1085/jgp.44.1.169. [DOI] [PMC free article] [PubMed] [Google Scholar]
- 2.Danowski T S. J Biol Chem. 1941;139:693–705. [Google Scholar]
- 3.Harris J E. J Biol Chem. 1941;141:579–595. [Google Scholar]
- 4.Wilson T H. Science. 1954;120:104–105. doi: 10.1126/science.120.3107.104. [DOI] [PubMed] [Google Scholar]
- 5.Leaf A. Ann NY Acad Sci. 1959;72:396–404. doi: 10.1111/j.1749-6632.1959.tb44168.x. [DOI] [PubMed] [Google Scholar]
- 6.Tosteson D C. In: The Cellular Functions of Membrane Transport. Hoffman J F, editor. Englewood Cliffs, NJ: Prentice–Hall; 1964. pp. 3–22. [Google Scholar]
- 7.Jakobsson E. Am J Physiol. 1980;238:C196–C206. doi: 10.1152/ajpcell.1980.238.5.C196. [DOI] [PubMed] [Google Scholar]
- 8.Lev V L, Freeman C J, Ortiz O E, Bookchin R M. J Clin Invest. 1991;87:100–112. doi: 10.1172/JCI114958. [DOI] [PMC free article] [PubMed] [Google Scholar]
- 9.Post R L, Jolly D C. Biochim Biophys Acta. 1957;25:118–128. doi: 10.1016/0006-3002(57)90426-2. [DOI] [PubMed] [Google Scholar]
- 10.Mullins L J, Noda K. J Gen Physiol. 1963;47:117–132. doi: 10.1085/jgp.47.1.117. [DOI] [PMC free article] [PubMed] [Google Scholar]
- 11.Goldman D E. J Gen Physiol. 1943;27:37–60. doi: 10.1085/jgp.27.1.37. [DOI] [PMC free article] [PubMed] [Google Scholar]
- 12.Hodgkin A L, Katz B. J Physiol (London) 1949;108:37–77. doi: 10.1113/jphysiol.1949.sp004310. [DOI] [PMC free article] [PubMed] [Google Scholar]
- 13.Hodgkin A L, Horowicz P. J Physiol (London) 1959;148:127–160. doi: 10.1113/jphysiol.1959.sp006278. [DOI] [PMC free article] [PubMed] [Google Scholar]
- 14.Smith T W, Rasmusson R L, Lobaugh L A, Lieberman M. Basic Res Cardiol. 1993;88:411–420. doi: 10.1007/BF00795408. [DOI] [PubMed] [Google Scholar]
- 15.Jackson P S, Strange K. Am J Physiol. 1993;256:C1489–C1500. doi: 10.1152/ajpcell.1993.265.6.C1489. [DOI] [PubMed] [Google Scholar]
- 16.Russell J M. J Gen Physiol. 1983;81:909–925. doi: 10.1085/jgp.81.6.909. [DOI] [PMC free article] [PubMed] [Google Scholar]


