Abstract
This article presents a computational model of the process through which the human visual system transforms reflectance spectra into perceptions of color. Using physical reflectance spectra data and standard human cone sensitivity functions we describe the transformations necessary for predicting the location of colors in the Munsell color space. These transformations include quantitative estimates of the opponent process weights needed to transform cone activations into Munsell color space coordinates. Using these opponent process weights, the Munsell position of specific colors can be predicted from their physical spectra with a mean correlation of 0.989.
Classical opponent process theory usually is modeled as a linear combination of cone signals, with different color perceptions characterized by different combinations of the activation or inhibition of the long, medium, and short cones. Finding the appropriate weights to assign to the three cones has long been a problem within this theory (1–3). This article presents a quantitative model for the transformation of reflectance spectra into the perceptually based Munsell color space by using regression analysis to estimate opponent process weights. Four sets of data are required for this task: (i) reflectance spectra of Munsell color chips, (ii) the spectral radiant power distribution for D65 illumination, (iii) quantitative estimates of the three human cone sensitivity functions, and (iv) Cartesian coordinates for the Munsell color space.
The Munsell Color System
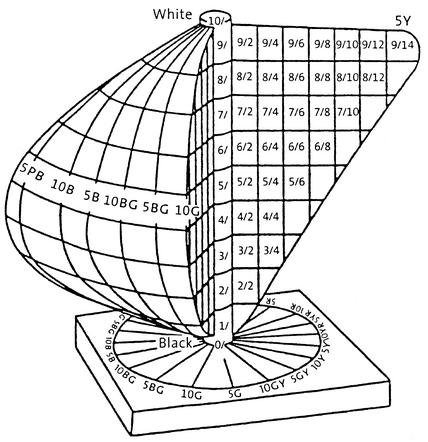
The Munsell system, developed by the artist Albert Munsell circa 1905, is based on a standardized set of painted color surfaces, commonly called color chips, arranged in a globe-like 3D space. The goal of the Munsell system is to present an arrangement of a full sample of colors in equal perceptual intervals over the three dimensions of the color space. The vertical dimension, called value, runs in equal perceptual steps from white to black. Circling the equator of the globe are the hues, divided into 10 equally distant sectors labeled red, yellow-red, yellow, green-yellow, green, blue-green, blue, purple-blue, purple, and red-purple. Each sector is further divided into four subdivisions, labeled 2.5, 5.0, 7.5, and 10.0, with the best exemplar color for each hue sector at 5.0. Right angle distance from the value axis represents degree of saturation, labeled chroma. The chroma scale runs in equal perceptual intervals from 0 (achromatic) to 16 or more (highly saturated). The full sample of color chips in the Munsell book of color form an irregular sphere with notable protuberances in the yellow and red regions (see Fig. 1).
Figure 1.
Diagrammatic representation of the Munsell color solid with one quarter section removed.
Although there are a variety of systems for ordering colors, so far as we are aware, only the Munsell and Optical Society of America (OSA) systems are based on extensive direct judgments of perceptual similarity. The two systems have similar hue axes, one axis extending from yellow to purple-blue, the other from red to blue-green (1, 2). Based on millions of human judgments, the OSA estimated the best-fitting Commission International de l'Eclairage (CIE) colorimetric positions for each of the Munsell color chips so that the entire set would conform as closely as possible to the Munsell conceptual system (4). A number of scaling studies have confirmed the approximately equal perceptual spacing of color chips and the overall organization of the system (5). We think it reasonable to assume that the Munsell axes approximate the true perceptual axes of hue and value not only because of the scaling results, but also because hue complements and negative afterimages are found on opposite sides of the Munsell space, exactly as they should be given the basic assumptions of opponent process theory (1).
To construct quantitative measures on the Munsell color structure, the Munsell spherical coordinates have been transformed into standard Cartesian coordinates. The value measure for each color chip has been assigned to first dimension. To position color chips on the second and third hue dimensions, each of the 40 hues has been positioned around the circumference of the globe, beginning with 5.0 red at 0°, moving clockwise 9° for each of the other 39 hues. The position of each color chip is then calculated by standard trigonometric functions. The position of a chip on the red to blue-green dimension, extending from 5.0 red to 5.0 blue-green, equals the cosine of its hue angle times its score on the chroma dimension. The position of a chip on the yellow to purple-blue dimension, extending from 10.0 yellow to 10.0 purple-blue, equals the sine of its hue angle times its score on the chroma dimension. The chips on each dimension are standardized to a mean of zero and a standard deviation of one. As a result of this change from spherical to Cartesian coordinates, every Munsell color chip can be represented as a point at the intersection of a normalized orthogonal x, y, z space. It should be stressed that the points in this space are a purely conceptual system; an idealized representation of what the perceptual relations among the color chips should be, not an actual set of observations.
To obtain estimates of parameter variability our data have been divided into four separate hue groups. The first group contains all of the Munsell 2.5 hue color chips (2.5 red, 2.5 yellow-red, 2.5 yellow, etc.), the second group contains all of the 5.0 color chips (5.0 red, 5.0 yellow red, 5.0 yellow, etc.), and so on. Because of the irregular character of the Munsell globe, the four groups contain different numbers of color chips (2.5 hues n = 277, 5.0 hues n = 354, 7.5 hues n = 276, and 10.0 hues n = 343).
The Reflectance Spectra
The physical data set is based on spectral reflectance measurements made with a spectrophotometer on 1,250 color chips in the 1976 Munsell Matte Color Book (17) at a 5-nm resolution from 400 to 700 nm. The data set was obtained from www.cs.joensuu.fi/∼spectral/databases/download/munsell_aotf.htm. We selected color chips from 430 to 660 nm to approximate the range of human color vision. Analyses using greater ranges were also carried out; no measurable increase in accuracy was obtained by increasing the range. Thus the basic matrix S(λ) consists of 1,250 rows of Munsell color chips and 47 columns, with each column containing the reflectance data averaged for 5-nm intervals running from 430 to 660 nm. The first step of the analysis was to multiply the figures in each column of the spectral reflectance data matrix by the spectral radiant power distribution of D65 light, D(λ), creating a new matrix SD(λ), which approximates the amount of radiant energy falling on the retina under conditions of D65 illumination (6).
The Representation of Cone Sensitivities
We have used the Stockman and Sharpe (7) sensitivity functions for the long, medium, and short cones. The Stockman and Sharpe curves are normalized to 1.0 at their peaks. We used cone fundamentals in 5-nm steps in terms of energy (linear) from http://cvision.ucsd.edu/database/text/cones/ss10.htm. To estimate the total activity for each cone for any given color chip we first multiplied the cone sensitivity figures for that cone across each of the 5-nm intervals from 430 to 660 by the corresponding spectral reflectance figures from matrix SD(λ) and then summed across the 5-nm intervals to obtain the summed cone response. The result is a three-column matrix, LMS, with a row of the matrix for each color chip and each column containing the summed cone response data.
The Cube Root Transformation
Because the relationship between physical energy and neural or perceptual responses is generally recognized to be nonlinear, we explored some of the standard transformations given in the literature. For photopic vision, both log and cube root of the spectral energy (luminance) have been used. Wyszecki and Stiles (6) presented plots of six curves (Fig. 2) and formulae (Table 1) relating lightness-scale values and luminance factors. The functions they present include square roots, cube roots, and logs.
Figure 2.
Spectral reflectance curves for seven 5.0 green color chips at chroma 2 and value levels 3–9. The original linear reflectance scale is plotted (Left), on a log scale (Center), and on a cube root scale (Right).
Table 1.
Opponent process weights
| Value | Cones
|
Sum of weights | ||
|---|---|---|---|---|
| Long | Medium | Short | ||
| White to black | ||||
| 2.5 group | 0.42 | 0.63 | −0.06 | 0.99 |
| 5.0 group | 0.45 | 0.61 | −0.08 | 0.99 |
| 7.5 group | 0.34 | 0.71 | −0.07 | 0.99 |
| 10.0 group | 0.47 | 0.58 | −0.007 | 0.98 |
| Yellow to purple-blue | ||||
| 2.5 group | −2.03 | 3.76 | −1.82 | −0.09 |
| 5.0 group | −2.37 | 4.50 | −2.18 | −0.05 |
| 7.5 group | −1.85 | 3.56 | −1.77 | −0.06 |
| 10.0 group | −2.35 | 4.56 | −2.21 | −0.02 |
| Red to blue-green | ||||
| 2.5 group | 6.05 | −6.27 | 0.32 | −0.05 |
| 5.0 group | 7.46 | −7.82 | 0.41 | −0.05 |
| 7.5 group | 6.21 | −6.46 | 0.31 | −0.09 |
| 10.0 group | 7.72 | −8.12 | 0.41 | −0.05 |
A visual comparison of the effect of different transformation can be obtained by plotting the spectral reflectance curves for a series of color chips. Fig. 2 shows spectra for seven 5.0 green color chips at chroma 2 and value levels 3, 4, 5, 6, 7, 8, and 9. In Fig. 2 Left the reflectance spectra are plotted on the original reflectance scale, in Fig. 2 Center they are on a log scale, and in Fig. 2 Right they are on a cube root scale. On the original reflectance scale the spectra are neither parallel nor equally spaced, on the log scale they are parallel but not equally spaced, and on the cube root scale they are both parallel and approximately equally spaced. The same result was found across a range of spectral reflectance curves. Romney and Indow (8), in a scaling analysis of reflectance spectral data, also found the cube root transformation yielded a close approximation to the value dimension.
Because the cube root transformation maintains linear relationships among spectral curves for color samples of the same hue and chroma, the summed cone values in the matrix LMS were cube-rooted. We also explored whether taking the cube root function at different points along the transformational process had effects on predictive accuracy. Neither cube rooting the spectra data matrix S(λ) before engaging in any other transformations, nor cube rooting the spectral data after they had been multiplied by the D65 illumination [the matrix SD(λ)], affected predictive accuracy. Correlations of the sums of the long, medium, and short cones created by the different cube root procedures were all in the 0.999 range.
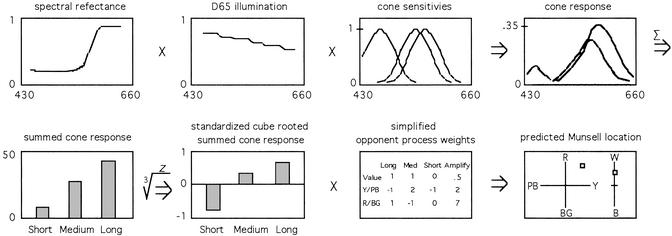
The values of each of the L, M, and S columns of the matrix were then transformed into z scores with a mean of zero and a standard deviation of one, creating a new matrix designated z3rLMS. Scores were standardized because the summed cone scores have no absolute reference point because the cone sensitivity functions used here were already normed with each curve having a maximum value of one. We recognize that this is not the usual cone normalization procedure. A more common procedure is to normalize summed cone scores by dividing the scores for each cone by the total sum of the three cone scores for that chip (i.e., L/L+M+S), M/L+M+S, S/L+M+S). We have carried out our full analyses on both procedures and found a slight, but significant, increase in predictive accuracy with z scores, possibly because using all scores to estimate relationships among cones yields better estimates than using only the three cone scores for each chip. For the purposes of this article, there is no theoretical import to using one rather than another kind of normalization procedure. A cartoon describing the transformations we have carried out, some of which have yet to be described, is presented in Fig. 3.
Figure 3.
Cartoon of the data transformations carried out in this article, using as an example a single spectral reflectance curve that is multiplied by the D65 illumination curve, then multiplied by the short, medium, and long cone sensitivity functions, then summed for each cone, cube-rooted and standardized, and finally multiplied by opponent process weights to its predicted Munsell location on the yellow to purple-blue, red to blue-green, and white to black axes.
Obtaining Linear Estimates for the Munsell Color Space
The opponent process of color vision can be conceptualized as a set of transformations by which the summed cone activity of each color sample is translated into the coordinates of perceptual color space. Quantitatively, this can be modeled by finding weights that predict the Munsell coordinates from the matrix of summed cone activity z3rLMS. Assuming that the process is linear and scores have been standardized, standard multiple regression or least-squares analysis of multiple linear equations are appropriate techniques that yield identical results. The standardized regression coefficients, or opponent process weights, are presented in Table 1 for all four Munsell groups.
Overall, weights vary little by hue group. The ratios between the weights vary even less, indicating a robust estimation procedure. The weights for value and the red to blue-green dimension are generally what one would expect from the literature on the opponent processes (2, 3, 9–12). Value, the light to dark dimension, is almost entirely a function of the long and medium cones. The red to blue-green dimension is primarily a function of the difference between the medium versus the long cones. The weights for the yellow to purple-blue dimension show a more complex pattern, with long and short cones in opposition to medium cones. In the literature, this dimension has shown the greatest divergence of estimates of opponent process weights.
It should be mentioned that the weights reported here are applicable only for the axes from which they were computed. Given any rotation of the axes, the weights will change, although the overall degree of accuracy in predicting the Munsell conceptual position of chips from the spectral data will remain the same. We believe the Munsell axes are reasonable approximations to whatever axes are used by the neural system because the red end of the red to blue-green axis is fixed by hue of the longest perceived wavelengths and the purple-blue end of the yellow to purple-blue axis is fixed by the shortest perceived wavelengths. In this sense, each axis is fixed on one side by its furthest limit of perception. As a formal computation matter, however, the position of the axes is arbitrary.
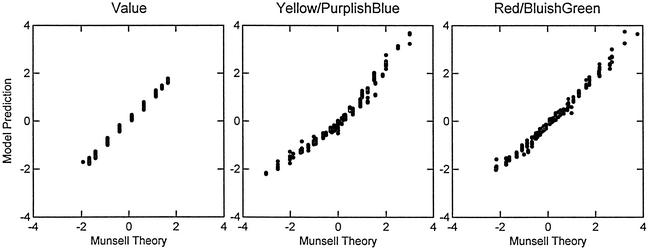
The next issue concerns how well these weights predict the position of the color chips in the Munsell space. To predict the position of any given color chip, the summed and standardized activity of each cone has been multiplied by the appropriate opponent process weights for each Munsell dimension. Table 2 presents the correlations between predicted and the conceptual Munsell color chip positions on the three color dimensions for each of the four hue groups; Fig. 4 presents the scatter plots for these three dimensions for the 5.0 hue group.
Table 2.
Correlations by dimension for the fit between predicted and conceptual Munsell locations
| Hue group | Value | Yellow to purple-blue | Red to blue-green | Mean r |
|---|---|---|---|---|
| 2.5 | 0.997 | 0.980 | 0.994 | 0.990 |
| 5.0 | 0.998 | 0.975 | 0.995 | 0.989 |
| 7.5 | 0.998 | 0.977 | 0.995 | 0.990 |
| 10.0 | 0.998 | 0.972 | 0.994 | 0.988 |
Figure 4.
Plot of the relation between the positions of 355 5.0 hue chips on the theoretical Munsell Cartesian axes versus the position predicted from the spectral reflectance curves and opponent process weights.
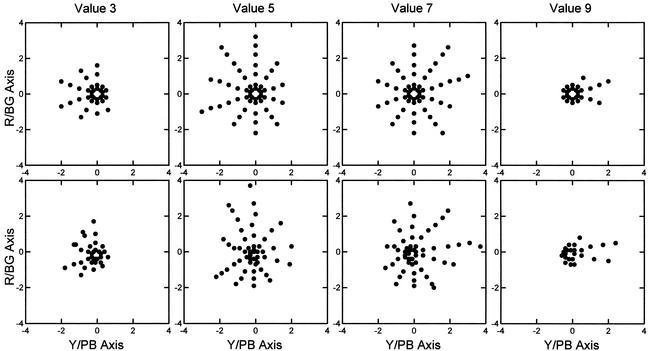
Given the real-world problems involved in producing color chips that are exactly positioned in their proper perceptual location in the Munsell space, the fit between predicted and conceptual positions seems excellent. The graphic results for the Munsell 5.0 hue group with respect to the hue dimensions at values 3, 5, 7, and 9 are presented in Fig. 5.
Figure 5.
Comparison of plots at selected levels of value for the Munsell hue dimensions. (Upper) The conceptual positions of chips on the two hue dimensions. (Lower) The positions predicted from the spectral reflectance curves and opponent process weights. R/BG, red/bluish-green; Y/PB, yellow/purplish-blue.
Examination of the residuals shows a systematic difference between the predicted and conceptual data. Overall, there is a tendency for the predicted points on the yellow side of the yellow to purple-blue axis to extend further out from the achromatic point than the corresponding conceptual points, whereas the predicted points on the purple-blue side of the axis fail to extend far enough from the achromatic point.
Two sources of data lead us to believe the problem here is in positioning of the actual color chips, not some complex nonlinearity in perception. The first is that the principal components obtained from a single value decomposition of the spectral data obtained by Romney and Indow (8) displays the same systematic divergence with respect to the yellow to purple-blue axis when all components are rotated into conformity with the Munsell system. Here the mapping is directly from the physical spectral data to the Munsell conceptual system. Although one would not necessarily expect an isomorphic mapping directly from the physical data to the perceptual data, the fact that both the opponent process analysis and the purely physical analysis show the same divergence from the Munsell color samples is notable.
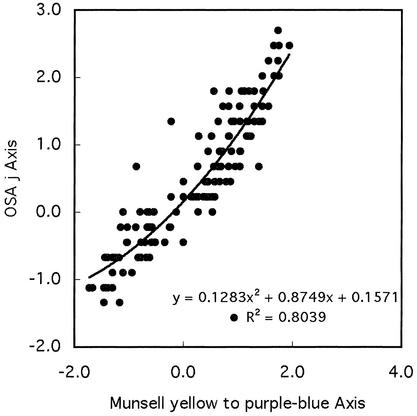
The second source of evidence is based on work by Boynton, MacLaury, and Uchikawa (14) in which Munsell color chips were directly matched to OSA color tiles. Comparing matched OSA and Munsell colors, the same divergence becomes apparent. Examination of the matched color samples show that OSA tiles have proportionally greater values on yellow side of the yellow to purple-blue dimension than the corresponding Munsell chips, and proportionally smaller values on the purple-blue side of the axis. Fig. 6 presents a scatter plot of these data fitted to a second-order polynomial.
Figure 6.
Plot of the relation of 135 matched Munsell chips and OSA tiles on the Munsell yellow to purple-blue axis and the OSA j axis, including a least-squares fitted trend line and second-order polynomial equation for these data.
Although the number of matched color samples between the OSA and Munsell systems is not great enough to arrive at a fully determinate result, a nonlinear relation between the two systems with respect to the yellow to purple-blue axis is apparent. Comparison of the red to blue-green axes across the two systems, on the other hand, shows no evidence of nonlinearity. Modifying the Munsell conceptual system by using a second-order polynomial correction to take account of this nonlinearity raises the correlation between predicted and conceptual scores from 0.976 to 0.991 for the yellow to purple-blue dimension.
Simplification of Opponent Process Weights
Because regression weights are based on least-squares approximations, such weights can often be unitized without adversely affecting accuracy of prediction (13). By treating the weights as if they were composed of two components it is possible to replace the many-place numbers in Table 1 with simple integers with little loss of accuracy. The first step in doing this is to abstract the relations between the cones. Thus, for example, for the 5.0 group, for the yellow to purple-blue axis the weights in Table 1 are −1.99 for the long cone, +4.04 for the medium cone, and −2.10 for the short cone. The proportions here are ≈−1 to +2 to −1. These integers then become the unitized weights. To predict actual locations along this axis, the results of the −1, +2, −1 weightings must be multiplied by two to make the results correspond to results obtained from the unsimplified regression weights. A simplified matrix for the opponent process weights is presented in Table 3 and a comparison between the results of predicting from calculated weights versus simplified weights is presented in Table 4. Because it is easier to imagine neural opponent connections on a 1-to-1 basis, which are then amplified seven times than it is to imagine neural connections matching up on a 7.74 to −8.09 to 0.37 basis, the fact that relatively simple integer relations can be found to model the opponent process weights adds to the potential neural plausibility of our model.
Table 3.
Simplified opponent process weights
| Value | Cones
|
|||
|---|---|---|---|---|
| Long | Medium | Short | Amplify by | |
| White to black | 1 | 1 | 0 | 0.5 |
| Yellow to purple-blue | −1 | 2 | −1 | 2 |
| Red to blue-green | 1 | −1 | 0 | 7 |
Table 4.
Comparison of correlations by dimension for the fit between predicted and conceptual Munsell locations for calculated versus simplified weights (means for all hue groups)
| Weights | Munsell dimensions
|
Mean r | ||
|---|---|---|---|---|
| Value | Yellow to purple-blue | Red to blue-green | ||
| Calculated | 0.998 | 0.976 | 0.995 | 0.989 |
| Simplified | 0.997 | 0.974 | 0.980 | 0.984 |
To help resolve some of the differences in the literature about the weights for the yellow to purple-blue dimension, we have assigned different sets of integer weights to find out which set best predicts the data. Results for four different sets of integer weights are presented in Table 5. Although the differences between the coefficients are small, all pairs of coefficients are significantly different at probability levels <0.01. These results support our assignment of −1 long, +2 medium, and −1 short weights for the yellow to purple-blue dimension, given the understanding that these weights are specific to the Munsell axes used here.
Table 5.
Comparison of simplified opponent process weights for the yellow to purple-blue dimension
| Cones
|
Correlation between conceptual and predicted | ||
|---|---|---|---|
| Long | Medium | Short | |
| −1 | 2 | −1 | 0.974 |
| 0 | 1 | −1 | 0.930 |
| 1 | 1 | −2 | 0.891 |
| 1 | 0 | −1 | 0.847 |
Other Color-Matching Functions
Besides cone sensitivity functions, other functions, such as the 10° red, green, blue (RGB) color-matching functions and CIE 10° (1964) XYZ functions, have been used in color-matching research (15, 16). These functions all appear to be linear transformations of each other, which means regression weights can be used to transform any set of color-matching functions to any other. This also means that we can use any linearly related set of color-matching functions exactly as we have used the cone sensitivity functions to predict from spectral reflectance curves to the Munsell perceptual space. Table 6 presents the results of carrying out the operations depicted in Fig. 4 using the 10° RGB and the CIE 10° XYZ color-matching functions for the 5.0 hue group (obtained from http://cvision.ucsd.edu/cmfs.htm) instead of cone sensitivity functions. Table 6 shows that while the weights change for the different sets of functions, the sets predict from the spectral data to the Munsell color space equally well.
Table 6.
Opponent process weights 5.0 hue group for cone sensitivity, RGB, and CIE XYZ color-matching functions
| Value | Cones
|
Sum | r between predicted and conceptual | ||
|---|---|---|---|---|---|
| Long | Medium | Short | |||
| White to black | |||||
| Cone sensitivity | 0.45 | 0.61 | −0.08 | 0.99 | 0.998 |
| RGB | 0.24 | 0.84 | −0.08 | 1.01 | 0.997 |
| CIE XYZ | −0.11 | 1.19 | −0.09 | 0.99 | 0.997 |
| Yellow to purple-blue | |||||
| Cone sensitivity | −2.37 | 4.50 | −2.18 | −0.05 | 0.975 |
| RGB | −2.03 | 3.76 | −1.82 | −0.09 | 0.971 |
| CIE XYZ | −1.85 | 3.56 | −1.77 | −0.06 | 0.979 |
| Red to blue-green | |||||
| Cone sensitivity | 7.46 | −7.82 | 0.41 | −0.05 | 0.995 |
| RGB | 2.28 | −2.49 | 0.41 | −0.08 | 0.990 |
| CIE XYZ | 6.21 | −6.46 | 0.31 | −0.09 | 0.994 |
Discussion
The data transformations presented here produce a reasonably satisfactory positioning of the Munsell color chips in perceptual color space from spectral reflectance data. Although by themselves these transformations are not sufficient to account for many aspects of color vision, such as color constancy or hue shifts with changes in illumination, our results do indicate that simple linear opponent process mechanisms give an adequate account of certain basic features of human color vision. This model may also prove to have some practical value, making it possible to effectively assign Munsell positions to a wide variety of colored materials based solely on their spectral reflectances without requiring complex psychological scaling judgments. At this point, analyses of spectral reflectance data from the OSA system are clearly needed as an independent check on the procedures and weights presented here.
Acknowledgments
We are grateful to Donald MacLeod, Manuel Rotenberg, Tarow Indow, Paul Kay, and Geoff Iverson for extensive comments and advice on earlier drafts of this manuscript. The research was supported in part by National Science Foundation Grant SBR-9531213 (to A.K.R. and William H. Batchelder).
Abbreviations
- OSA
Optical Society of America
- CIE
Commission International de l'Eclairage
- RGB
red, green, blue
Footnotes
This contribution is part of the special series of Inaugural Articles by members of the National Academy of Sciences elected on April 28, 1998.
References
- 1.Jameson K, D'Andrade R G. In: Color Categories in Thought and Language. Hardin C L, Maffi L, editors. New York: Cambridge Univ. Press; 1997. pp. 295–319. [Google Scholar]
- 2.Boynton R M, Olson C X. Color Res Appl. 1987;12:94–105. [Google Scholar]
- 3.Eskew R T, McLellan J S, Giulianini F. In: Color Vision: From Genes to Perception. Gegenfurtner K R, Sharpe L T, editors. New York: Cambridge Univ. Press; 1999. pp. 345–368. [Google Scholar]
- 4.Newhall S M, Nickerson D, Judd B. J Opt Soc Am. 1943;33:385–418. [Google Scholar]
- 5.Indow T. Color Res Appl. 1980;5:5–12. [Google Scholar]
- 6.Wyszecki G, Stiles W S. Color Science: Concepts and Methods, Quantitative Data, and Formulae. 2nd Ed. New York: Wiley; 1982. [Google Scholar]
- 7.Stockman A, Sharpe L T. Vision Res. 2000;40:1711–1737. doi: 10.1016/s0042-6989(00)00021-3. [DOI] [PubMed] [Google Scholar]
- 8.Romney A K, Indow T. Color Res Appl. 2003;28:182–196. [Google Scholar]
- 9.Boynton R M. Human Color Vision. New York: Holt Rinehart and Winston; 1979. [Google Scholar]
- 10.Cornsweet T N. Visual Perception. New York: Academic; 1971. [Google Scholar]
- 11.De Valois R L, Cottaris N P, Elfar S D, Mahon L E, Wilson J A. Proc Natl Acad Sci USA. 2000;97:4997–5002. doi: 10.1073/pnas.97.9.4997. [DOI] [PMC free article] [PubMed] [Google Scholar]
- 12.Kuehni R G. Color Res Appl. 2002;25:56–63. [Google Scholar]
- 13.Dawes R M. Am Psychologist. 1979;34:571–582. [Google Scholar]
- 14.Boynton R M, MacLaury R, Uchikawa K. Color Res Appl. 1989;14:6–15. [Google Scholar]
- 15.Stiles W S, Burch J M. Optica Acta. 1959;6:1–26. [Google Scholar]
- 16.Romney A K, Indow T. Proc Natl Acad Sci USA. 2002;99:11543–11546. doi: 10.1073/pnas.162368999. [DOI] [PMC free article] [PubMed] [Google Scholar]
- 17.Munsell Color Company, Inc. Munsell Book of Color: Matte Finish Collection. Baltimore: Munsell; 1976. [Google Scholar]


