

Abstract
Nystatin (nys) is an antifungal agent that preferentially forms ion channels in membranes containing the sterol, ergosterol (erg). The structure of the nystatin channel is not clear, but it is known that multiple nystatin monomers must aggregate to form channels in a sterol-rich membrane. When nys/erg containing vesicles are fused to a sterol-free bilayer, characteristic spikelike changes in membrane conductance are observed. An abrupt increase in conductance is followed by a decay that is generally stepwise linear and the decay time depends strongly on [erg]. These data are inconsistent with the hypothesis that nys channels form uniformly throughout the membrane and decay independently (which would produce exponential decay). We propose that channels are located at the boundaries of lipid superlattices such that diffusion of erg out of the lattice results in correlated channel decay. This was tested using a statistical mechanical analysis and Monte Carlo simulations, which reveal details of the diffusion process and provide insight into conditions at superlattice boundaries during decay. This analysis predicts the linear decay schemes and the dramatic drop in channel decay time observed at erg mol % = 50. This interpretation also explains puzzling data relating conductance spike height to vesicle diameter.
INTRODUCTION
Nystatin is a polyene antifungal agent that is used topically. In the presence of ergosterol, nystatin forms channels in the cell membrane, which disrupts the normal cellular environment and ultimately leads to cell death. In addition to its antifungal properties, nystatin is also used to measure vesicle-bilayer fusion. If nystatin/ergosterol channels are present in the membrane of a vesicle, then, upon fusion with a planar phospholipid bilayer, these channels are transported to the bilayer. The newly delivered channels will produce a sudden increase in bilayer conductance (detected as a current spike). If the bilayer contains no ergosterol, this spike decays, as vesicular ergosterol diffuses into the phospholipid bilayer and the hundreds of tiny nystatin/ergosterol channels fall apart. The rate of ergosterol diffusion (and the subsequent disassembly of nystatin channels) will depend on the fluidity of the lipid membrane into which the ergosterol partitions.
Ordered lipid domains are two-dimensional lipid structures that usually contain significant amounts of sterols (e.g., cholesterol or ergosterol). These have attracted the attention of numerous authors (1–14). Of particular interest to us has been the seminal work of Chong and Liu et al. (3,9), which revealed that the partitioning of the sterol in a lipid membrane attained distinct minima at sterol mol fractions that matched those geometrically required for the formation of a superlattice of sterols. As the term has been used by other authors (2,3,7,8,11,13,14), a superlattice of sterols is a regular array of sterols arranged within a hexagonal lattice of lipid acyl chains. Each sterol molecule replaces an acyl chain in the superlattice. Wang et al. (14) showed that the presence of these sterol superlattices strongly affected the partitioning of nystatin into the membrane. Radhakrishnan and McConnell (13) have developed a thermodynamic model, which treats molecular complexes of dihydrocholesterol and phospholipids. This model is general enough to include superlattices and produces results very suggestive of data used in support of the superlattice model. Fundamental work on the interaction of nystatin with membranes has been done by Coutinho, Prieto and co-workers (4,5). They found that monomeric nystatin molecules partition into the membrane surface and reversibly assemble into aggregates (oligomers) of 4–12 antibiotic molecules.
The Monte Carlo simulations of Huang and Feigenson (7,8) have revealed the complexity of the interactions that must be considered in any attempt to understand the formation of sterol superlattices. A critical aspect of the sterol-membrane interaction, which emerges from these studies, can be understood in terms of an umbrella model in which the lipid headgroups cover the hydrophobic sterol. These studies have provided a theoretical basis for experimental work and numerical values for interaction energies between sterols and lipids required to form superlattices.
We have studied the dynamics of the decay of current spikes resulting from the fusion of vesicles containing nystatin/ergosterol channels with a planar phospholipid bilayer essentially free of sterol or nystatin. We prepared the vesicles used in these studies with ergosterol mol fractions which presumably resulted in superlattice structures on the vesicle membranes. Because of experimental limitations on the accuracy in measuring microliter amounts of lipid and ergosterol, however, we cannot anticipate that the vesicle membrane is covered completely by a superlattice. We expect a superlattice covering of the majority of the vesicle surface with possible gaps and fissures between sections of superlattice. During fusion, the membrane of the vesicle is placed under extreme stress. It is possible that the vesicle membrane has sufficient cohesive forces to remain intact. But a more likely alternative is that the vesicle membrane breaks up, possibly along the assumed boundaries between superlattice regions, which may take on the form of the circular domains identified by Baumgart et al. (1). We suppose, therefore, that our experiments have been conducted on groups of channels in the presence of domains containing ergosterol superlattices, which we shall call ergosterol superlattice domains (ESLDs).
In this article, we present experimental evidence that the nystatin/ergosterol channels are not independent of one another and that their decay is strongly dependent on the mol fraction of ergosterol present in the vesicles. We then propose a model, in which the sort of channels identified by Coutinho, Prieto and co-workers (4,5) form on the perimeter of the ESLDs. In the model, these channels dissolve as the ergosterol in the supporting ESLD diffuses into the bilayer. We subject this model to statistical mechanical analysis and Monte Carlo simulation studies. We show that this model successfully accounts for the experimental observations reported here as well as some previously puzzling results obtained by one of us (D.J.W.).
METHODS
Artificial vesicle preparation
Artificial vesicles (AVs) were prepared using a mixture (10 mg/ml) of lipids, brain phosphatidylethanolamine (PE), phosphatidylcholine (PC), phosphatidylserine (PS) (Avanti Polar Lipids, Alabaster, AL), and ergosterol (Sigma Chemical, St. Louis, MO). The lipids were in a 2:1:1 weight ratio and the ergosterol fixed by the mol fraction desired. Quantities were measured using Hamilton syringes (Hamilton, Reno, NV). Nystatin (Sigma Chemical) dissolved in dry methanol (2.5 mg/ml) was added (5 μl). The solution was dried under nitrogen and 0.2 ml of 150 mM KCl (8 mM HEPES, pH 7.2) was added. The solution was then vortexed for 6 min and bath-sonicated for 90 s. Finally, the AVs were processed with three freeze-thaw-sonicate cycles as described (15,16).
Preparation of lipid bilayer
Lipid bilayers were prepared using brain PE and PC (Avanti Polar Lipids). A 100 μl suspension of PE/PC in a volume ratio of 7:3 (10 mg/ml) was prepared using glass pipettes and dried under nitrogen gas. The dried lipids were resuspended in 50 μl decane. The lipid in decane suspension was brushed onto a 150–300 μm hole to form the planar bilayer.
Vesicle fusion experiments
From 10 to 20 μl of AV preparation was stirred (4 Hz) in the cis chamber of a planar lipid bilayer apparatus described elsewhere (15). An osmotic gradient of 410:150 mM KCl (cis/trans) and an electrical potential of 60 mV were then imposed across the bilayer. Fusion spikes were recorded at ergosterol mol fractions in the vesicles of χerg = 0.143–0.5. The data were digitally recorded every 4 ms. The data were fit numerically.
EXPERIMENTAL RESULTS
Dynamics of decay
Typical experimental results for bilayer currents as functions of time for two different mol fractions of ergosterol are shown in Figs. 1 and 2. In these experiments, vesicles containing nystatin and ergosterol were added to one side of a bilayer chamber. Vesicles were induced to fuse with the bilayer by forming an osmotic gradient across the bilayer as previously described (16,17).
FIGURE 1.

Bilayer current versus time for χerg = 0.245. Sample size = 47 spikes. Note that the decay is smooth. If single nystatin channels had a detectable current, the decay would appear as a downward staircase; however, the decay appears smooth since nystatin channels have a single channel conductance <1 pS.
FIGURE 2.

Bilayer current versus time for χerg = 0.4. Sample size = 14 spikes. Note the much longer timescale for the spike on the right.
Each experimental peak was carefully studied and the individual sections numerically fit to a linear function. Exponentials (I ∝ exp(−t/τ)) and power-series fits were tried for comparison if a section was not clearly linear. More than 95% of all fusion events were well fit by up to four linear segments. Note that some spikes had decay slopes that both increased and decreased with successive linear segments (e.g., right graph in Figs. 1 and 2). Such decays are clearly not exponential. Only 2% of all decay curves observed were better fit by an exponential function. The fit schemes and the numbers of sections were not correlated with peak heights or with peak durations.
If closing (breakup) of nystatin channels is an independent process (such as radioactive decay), then the decay rate is proportional to the number of channels present on the bilayer and the decay of the resulting bilayer current is an exponential function of the time. The experimentally observed piecewise linear decay scheme is, therefore, evidence that the nystatin/ergosterol channels are not independent of one another. It was fortuitous that the observed schemes are linear. Linear schemes are easily distinguished numerically from exponentials. The simplicity of the linear scheme did not, however, yield an immediately simple or obvious interpretation.
Spike duration
Spike duration is the time between the first appearance of the spike and the time at which the spike was no longer discernible from the noise at the baseline. Each spike was plotted and duration determined from the plot. Because >95% of the spikes decayed in stepwise linear segments, it was not difficult to determine the end of the spike duration. Overlapping spikes resulting from short times between vesicle fusions were ignored in all measurements.
We found that spike duration depended strongly on the mol fraction of ergosterol present in the vesicle membrane χerg. The spike duration and the spread in values of the spike duration both increased with χerg. Both of these observations are evident in the plot of spike duration as a function of χerg in Fig. 3.
FIGURE 3.

Spike duration as a function of mol fraction ergosterol in vesicles. Solid diamonds are averages of data. Vertical bars are ±1 SD.
The longest spike duration measured at χerg = 0.33 was 312 s and the longest spike duration measured at χerg = 0.40 was 800 s. For both concentrations the shortest spike durations were <1 s. This increase in spike duration with χerg ended dramatically at χerg = 0.50. At χerg = 0.50 the longest spike duration measured was 11 s and the shortest was <1 s.
The shape of the decay for spikes with extremely long durations was not observed to be different from short duration spikes. In each case a piecewise linear decay scheme was observed. Only the timescale was vastly different. For example, in Fig. 2, with χerg = 0.40, the duration of the spike on the left is just over 2 s and that on the right is >600 s.
THE MODEL
Description
We propose a model to account for the experimental observations reported here. The model attempts to bring together the findings of authors reported in the Introduction with the realization that there must be a physical connection among the channels to cause the conductance spikes appearing in a planar phospholipid bilayer after the fusion of a vesicle containing lipids, sterol, and nystatin. This physical connection is required to account for the linear rather than exponential form of the decay of conductance spikes found in our data and the model was primarily developed in an attempt to account for this experimental result. Our subsequent analysis of this model, which we report below, has shown that the model also accounts for the strong dependence of spike duration on sterol mol fraction in the vesicle membrane and accounts for other previously unexplained, but distinctive results.
As we pointed out in the Introduction, it seems reasonable to assume that the fusion of a vesicle containing sterol and nystatin with a phospholipid bilayer results in the formation of one or more ergosterol-rich domains on the bilayer. We make no attempt at an analysis of the details of the fusion, which is a complicated dynamical event. We propose, however, that these ergosterol-rich domains left by the fusion event correspond to the comparatively rigid and circular domains that have been identified by others (1,10) and that the sterol arrangement in these ergosterol-rich domains is in the form of a superlattice (3,7–9,11,13,14). These domains we term ergosterol superlattice domains (ESLDs).
We assume that the rigidity of the ESLD denies ready-access by nystatin, which may be in monomeric form on the surface of the ESLD or may partition into the bilayer outside or at the perimeter of the ESLD. Indirect support for this idea is also available from the evidence presented by Wang et al. (14) that nystatin partitioning is minimal at the mol fractions of ergosterol corresponding to ordered structures in the vesicles, but that upon slight deviations from these mol fractions the change in the nystatin partitioning is dramatic. We assume further that nystatin monomers aggregate to form stable channels only at the perimeter of the ESLDs.
The exact structure of the nystatin/sterol channel and the role of the sterol in the channel formation and conductance are unknown. We accept, however, that individual channels form, consisting of 4–12 nystatins and an indeterminate number and arrangement of sterols (4,5). Channels do not form a diffusion-limiting boundary around an ESLD. Rather, there is some arrangement of individual channels with spacings between them that is determined by the requirements of the role of the sterol in channel formation. As long as there is a separation between individual channels, regardless of the size of that separation, there will be diffusion of sterol molecules from the ESLD into the bilayer, provided this results in a decrease in chemical potential of the sterols. This diffusion will result in a decrease in the size of the ESLD with time.
At the beginning of an experiment there is no sterol in the bilayer. During an experiment the concentration of sterols in the bilayer is only increased by the fusion of vesicles and remains very small. The chemical potential of the sterols in the bilayer is then much less than that of the sterols in the ESLD during an experiment. The diffusion process itself will probably depend on the identity and structure of the lipid within and without the ESLD. We assume, however, that this has only a secondary effect on the diffusion timescale and does not affect the proposal that the principal cause of ESLD decay is diffusion of the sterol into the bilayer.
We then propose that a channel dissolves and no longer conducts ions when the contact is lost with the ESLD boundary, or that at least the viability of an individual channel is of a very short duration after separation from the ESLD. The model then identifies the decay of the nystatin/ergosterol channels with the decrease in the size of the ESLD resulting from the diffusion of the ergosterol molecules from the superlattice into the bilayer.
A conceptual picture of an ESLD and the associated channels is shown in Fig. 4. In real vesicles and consequently on real bilayers, ESLDs are likely much larger than shown in this picture, but the general organization, we propose, would be the same.
FIGURE 4.

Conceptual drawing of the ESLD and channel model. Solid circles are ergosterol, open circles are acyl chains (two per lipid), and large circles are a cluster of nystatins forming a ion channel. For simplicity, a small ESLD is shown. The actual linear density (channels per length of ESLD circumference) of nystatin channels is not known. After a vesicle fuses with an ergosterol-free bilayer, any vesicular superlattices may break into smaller fragments and hundreds of vesicular nystatin channels are transferred to the bilayer. This produces the sudden rise in bilayer current.
Because these ESLDs are formed from a single fusion and occupy a very small region in the lipid bilayer, there will be diffusion of the ergosterol from the superlattices into an essentially ergosterol-free bilayer. This results in a decrease in the size of the region occupied by the ESLD and of the circumference of that region. Since, at a given bilayer potential, the bilayer current is proportional to the number of channels, this decrease in superlattice circumference will result in a decay of the bilayer current. The decay in bilayer current is then a result of the diffusion of ergosterols from the interior of the ESLD.
Diffusion of ergosterols from the ESLD produces a region surrounding each ESLD in which the density of the ergosterols decreases from that of the superlattice to that of the bilayer, which is zero. A continuum description of diffusion from the ESLD would require knowledge of the ergosterol density in this transition region and specifically of the gradient of chemical potential in this region. Based on our Monte Carlo studies of diffusion of ergosterols from the ESLD, which will be described below, we have concluded, however, that such a transition region is, at best, poorly defined. A least-biased approach is then to ignore this region in the theoretical description of the model. We, therefore, specifically assume in our model that the ESLD is the domain in which the superlattice exists and that the boundary of the ESLD is defined by the points at which the sterols are no longer integrated into the superlattice but move freely. We then focus our attention only on the ergosterols in the superlattice and the channels attached to the superlattice, making no hypothesis about the bonding between the nystatins forming the channels and the superlattice.
Our model system then consists of ergosterol molecules in superlattices and channels bound to those superlattices, as shown in Fig. 4. Both of these constituents are functions of time. The system is not an equilibrium system, but the timescale on which the currents change (seconds) is much greater than the times necessary for establishing local thermodynamic equilibrium. We shall then use equilibrium statistical mechanics as the basis for our description of the superlattice and the channels. Because the number of ergosterols and channels are changing in the system, we use the grand canonical ensemble as the basis for our description. In this we shall require that the ensemble averages of the number of ergosterol molecules and of the number of channels are time functions.
Statistical mechanical analysis
The lipids of the bilayer, including those added to the original bilayer by the vesicle fusion, form a constant supportive surface, but need not be considered in the problem. We need then only consider the number densities NC = number of channels and Nerg = number of ergosterols in the superlattice. That is, ergosterols leaving the superlattice immediately become a part of the diffusion current away from the ESLD (see below).
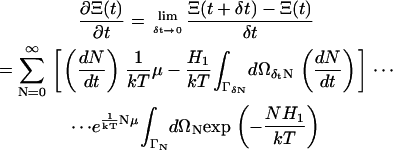
The grand canonical partition function, Ξ, for the system is then (18–21)
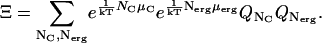 |
(1) |
In Eq. 1, the canonical partition functions are given by
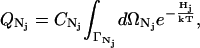 |
(2) |
in which 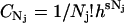 , Nj = Nerg or NC, h is Planck's constant, and s is the degrees of freedom of the ergosterol or the channel. The differential
  is the differential volume in the phase space
  of Nj particles. The phase space
  has a generalized momentum and a generalized coordinate for each of the s degrees of freedom of each particle. There are then 2sNj dimensions in the phase space
  . This is, however, of no concern to us here, since we shall carry out none of the details of any of the integrations in this development. The parameters μerg and μC are chemical potentials of the ergosterol and the channels. The ensemble average of a system quantity Φ is defined as
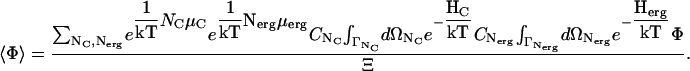 |
(3) |
We shall assume that the Hamiltonian Herg has the general form proposed by Huang and Feigenson (7,8), Herg = Hpair + Hmulti, where Hpair involves the pairwise interaction between ergosterols and lipids and pairs of ergosterols and Hmulti involves a multibody interaction among neighboring molecules. Huang and Feigenson demonstrated the importance of Hmulti in establishing the superlattices of sterols in lipids and showed that this interaction can be understood in terms of a covering of the sterol by the lipid headgroups. Since only sterols arranged in a superlattice enter our considerations here, it is sufficient to write the Hamiltonian as a product of the number of sterols and the energy of the superlattice site ESL. In this, we shall neglect the energy difference between the sites deep in the superlattice and those on the boundary but still integral to the superlattice. For the considerations of this section, we shall then simply write Herg = NergESL.
The Hamiltonian for the nystatin/ergosterol channels involves the binding energy of the sterols and nystatins. Although we have done molecular modeling (data not shown) to produce a general picture of the nystatins in the lipid membrane, this does not clarify the arrangement of the sterols and nystatins in the channel or the detailed form of the interaction we have proposed between the channels and the superlattice. In the present treatment we are assuming that the connection between the channels and the superlattice boundary is of primary importance in sustaining the channel and that when this connection is broken the channel is destroyed. Therefore the only energy we need to consider in the Hamiltonian is the energy of the connection between the channel and the superlattice. We shall write this as ESLC. Then HC = NCESLC.
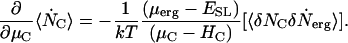
From Eq. 3 the ensemble average of the number of channels is 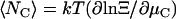 . The time rate of change of the ensemble average number of channels requires evaluation of the time derivative of Ξ. We assume that the structure of Ξ does not change and that only the ensemble averages of the channel and ergosterol numbers are time functions. In Appendix A, we obtain a general expression for ∂Ξ /∂t valid for the chosen form of the Hamiltonians, Eq. A4. With Eq. A4 we have
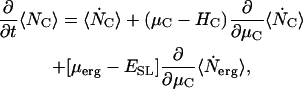 |
(4) |
in which we use the standard dot notation for time derivative. That is,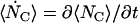 .
.
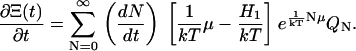
From Eq. 3, we have
 |
where the correlation function  is
is  . Then Eq. 4 reduces to
 |
(5) |
Eq. 5 may be integrated to give
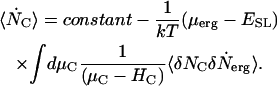 |
(6) |
Physically,  is the correlation of the channels and the rate of loss of the ergosterols from the superlattice. In our model, ergosterols are lost by diffusion from the superlattice into the bilayer. Because the superlattice remains intact, its chemical potential is a constant and the gradient in μerg, which drives the diffusion of the ergosterols, is constant. The rate of loss of ergosterols from the superlattice is then a constant, as is the correlation function
  . Therefore, the rate of loss of channels given by Eq. 6 is constant in time.
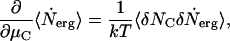
If  is also only a weak function of the chemical potential μC, we can integrate Eq. 6 to obtain
 |
(7) |
The rate of change of channel current from a particular ESLD, which is the system being considered, is the product of  and the current per channel, IC,
 |
(8) |
dropping the initial constant as superfluous.
In Appendix B, we derive an equivalent expression, Eq. B4, from macroscopic considerations. The result is the macroscopic analog of Eq. 8 for circular ESLDs. Equating Eq. B4 and Eq. 8, we have an expression for the correlation function valid for circular ESLDs,
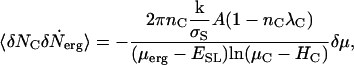 |
(9) |
which is consistently a weak function of μC and proportional to δμ.
Using the coupling parameter method of Kirkwood (22,23), the application of this by Haile and Chialvo (24,25) and the results of Monte Carlo simulations, Huang and Feigenson computed the excess Gibbs free energy for the mixed sterol/lipid system. The computations provided the excess chemical potential as a function of sterol mol fraction, including some of the mol fractions resulting in sterol superlattices (8). The relationship between the chemical potential of the sterol in the superlattice μsuperlatticeS and the excess chemical potential of the sterol in the superlattice  is
is
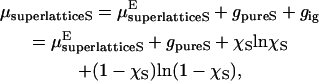 |
(10) |
in which gpureS is the chemical potential of the pure sterol. A plot of the theoretical μsuperlatticeS is presented in Fig. 5. The data in this graph were calculated from the data presented in Huang and Feigenson's Fig. 5 with a choice of multibody interaction energy parameters IV (MIEP IV) and a strength of the sterol multibody interaction of 3 kT using Eq. 10. Huang and Feigenson's Monte Carlo simulations of the sterols in the bilayer then provide a step in the chemical potential at χerg = 0.5. Our model (e.g., Eq. B4) predicts a step increase in the rate of loss of channels corresponding to this step in the chemical potential. This is consistent with our observations shown in Fig. 3. A step increase in channel loss rate produces a step decrease in duration time for a linear decay scheme.
FIGURE 5.

Chemical potential of sterol superlattice.
Monte Carlo simulation
We conducted Monte Carlo simulations to study the microscopic details of the diffusion of sterols from an ESLD. The Monte Carlo approach is based on a time-independent solution to a Markovian master equation in which the transition rates are constructed so that the simulation seeks a molecular configuration consistent with a Gibbs/Boltzmann distribution in system energies. It is statistical in nature and is not exact physics. This approach is, however, consistent with our assumption in the preceding section of local thermodynamic equilibrium on the timescales of interest.
A step in a Monte Carlo simulation considers possible moves for each of the sterol molecules in the system. Every possible move for a particular sterol molecule results in a specific change in the energy of the system. For each sterol molecule, a specific move is randomly selected from among the possible moves and the energy change Δɛ that would result is used to compute an acceptance ratio for that move, A = exp(−Δɛ/kT). The acceptance or rejection of the move is based on a comparison of A to a random number generated for that step. The result of a Monte Carlo step is then a statistical change in the system state, which is biased toward a local Gibbs/Boltzmann thermodynamic equilibrium. The Monte Carlo step is a step in an algorithm and is not a step in real time. However, at the boundary between the superlattice and the pure lipid our understanding of the physical process of diffusion does not provide us with any more than a statistical answer regarding which molecule(s) will dissociate from the superlattice in a particular time interval. And our physical understanding of the motion of freed sterol molecules into the lipid relates this motion to forces dependent on potential energies, as the system is driven toward thermodynamic equilibrium. We believe, therefore, that in the neighborhood of the superlattice boundary the change in molecular configuration resulting from a Monte Carlo step is a reasonable model of the process of diffusion from the superlattice in an actual time step.
For the Monte Carlo simulation we used a Metropolis algorithm (26) and standard boundary conditions for an hexagonal lattice of lipid acyl chains. The Hamiltonian was that of Huang and Feigenson for which we used their set of energy parameters MIEP IV with a strength of the sterol multibody interaction equal to 3 kT (7,8). Computer code was written in Maple 9.5 (Adept Scientific, Letchworth, Herts, UK) and was run on a PC with a 1.5 GHz Athlon microprocessor.
The Metropolis algorithm has become the algorithm of choice in many Monte Carlo simulations. In the Metropolis algorithm, all the sterol-moves to states for which the system energy is decreased, are accepted, resulting in a great increase in efficiency and a very small effect on the physics. The use of a hexagonal lattice for the lipid acyl chains is a simplifying assumption. For Monte Carlo simulations of more complicated systems in which phase transitions are present, such as those of Nielsen et al. (27) in which the effect of cholesterol on lipid phases and on phase transitions was studied, this assumption is not valid.
As a check on our routine and its capabilities we reproduced the results of the Monte Carlo simulations for the superlattices presented by Huang and Feigenson. For an initial condition on the simulation we filled all lattice sites in one region with sterols. The result for χerg = 0.50 and 5600 Monte Carlo steps was identical to Huang and Feigenson's Fig. 3 b for comparable conditions (7).
In the studies reported here, we determined diffusion currents from lines of symmetry in the superlattice. These can be used to approximate the circular perimeter. For example, in Fig. 6 we have reconstructed part of the perimeter of a circular ESLD (χerg = 0.50) with symmetry lines. This construction provides a reasonable approximation to a circular ESLD for the purposes of studying the diffusion current density from the ESLD. The net current from the ESLD is obtained from the product of current densities in each direction, indicated by the shaded arrows in Fig. 6, and segments of the ESLD perimeter perpendicular to that current density. The current densities corresponding to the shaded arrows (Fig. 6 A) and (Fig. 6 C) are perpendicular to lines along which the ergosterol densities are the same. This is also true of the shaded arrows (Fig. 6 B) and (Fig. 6 D).
FIGURE 6.

Reconstruction of ESLD perimeter using symmetry lines for χerg = 0.50. The shaded arrows indicate current densities perpendicular to the symmetry lines.
In each of the primary directions indicated by the shaded arrows, we considered a two-dimensional problem. For the initial conditions in the Monte Carlo simulation, we arranged the group of mobile sterols to be studied in the appropriate superlattice. One boundary was provided by a set of fixed sterols arranged in the superlattice. The other boundary was the pure lipid. The initial condition for the directions B and D in Fig. 6 and χerg = 0.50 is shown in Fig. 7 a. The frames in Fig. 7, b and c, show the diffusion current emerging from the edge of the superlattice, i.e., the edge of the ESLD, after 15 and 70 Monte Carlo steps, respectively. For each frame there is a region to the left, not shown, that contains a fixed superlattice. The sterols shown are active in the simulation. The number of active sterols was a parameter in the program.
FIGURE 7.

Diffusion from a χerg = 0.50 superlattice. (a) Initial condition with active ergosterols in superlattice, (b) after 15 Monte Carlo steps, and (c) after 70 Monte Carlo steps.
We found that after a few Monte Carlo steps a steady-state condition was established in the region immediately beyond the boundary of the superlattice for each symmetry direction, which corresponded to a steady diffusion current from the superlattice in all directions. A plot of the number of sterols freed from a superlattice with χerg = 0.40 as a function of the number of Monte Carlo steps is shown in Fig. 8.
FIGURE 8.

Number of sterols freed from the superlattice as a function of Monte Carlo step for χerg = 0.40.
The straight line in Fig. 8 is a least mean-square fit to the data beyond the Monte Carlo step 15. The linearity of the fit indicates a constant diffusion current if the Monte Carlo step is considered as a measure of the time. Because a finite number of active sterols are used in the simulation the current measurements from the simulations are only meaningful as long as there are active sterols forming the superlattice boundary. The initial Monte Carlo steps required for establishing this steady current have no physical meaning as far as the experiments are concerned. Under the present experimental conditions there is no way to determine the condition at the boundary of the superlattice immediately after vesicle fusion.
Our Monte Carlo simulations showed that the diffusion current densities of the ergosterol molecules from each of the superlattice directions were constant and very nearly equal, respectively, for the two mol fractions studied (χerg = 0.40 and 0.50). Specifically, we found that the ratios of the radial diffusion current densities from the directions D and C of Fig. 6 were 1.10 ± 0.28 at χerg = 0.40 and 1.11 ± 0.27 at χerg = 0.50. We expected slight differences in the diffusion current densities in the different directions because the energy change in removing a sterol from the superlattice is affected by the immediate environment of the sterol. The fact that we obtained ratios of these currents that were so close to unity indicates that the diffusion rate may be taken to be circularly symmetric. This corresponds to a macroscopic, thermodynamic picture in which diffusion is determined by a gradient in chemical potential which is uniform around the perimeter of the circular ESLD. The microscopic picture, however, requires no transition region from the structured superlattice to a region of free ergosterols and lipids. For this reason, based on our Monte Carlo studies, we have considered the boundary of the ESLD to be the edge of the superlattice for the statistical mechanical considerations (see above) rather than including a transition region.
In terms of freed sterols per Monte Carlo step, the sterol diffusion currents obtained from the simulations were almost identical numerically for χerg = 0.40 and χerg = 0.50. Specifically for the symmetry direction D of Fig. 7, the numbers of freed sterols per Monte Carlo step are given in Table 1.
TABLE 1.
Number of freed sterols per Monte Carlo step for the symmetry direction (D) of Fig. 7
| χerg | 0.40 | 0.50 |
|---|---|---|
| Freed sterols per MC step | 1.08 ± 0.2 | 1.12 ± 0.2 |
If the Monte Carlo steps correspond to actual time steps with the same scale this would indicate that the spike durations at χerg = 0.40 and χerg = 0.50 should be identical. In our model, the spike duration is determined by the rate of loss of ergosterol from the superlattice. Fig. 3, however, shows a dramatic difference in the spike durations at χerg = 0.40 and χerg = 0.50. To understand this, we undertook an analysis of the ratio of the timescales at different mol fractions. This analysis is outlined in Appendix C. We then used the results of the simulations between 17 and 40 Monte Carlo steps to obtain energy changes per freed sterol and the currents per Monte Carlo step required in the calculation of the timescale ratio, Eq. C5. For kT = 1/2 we obtained a ratio of the time per Monte Carlo step at χerg = 0.50 to that at χerg = 0.40 of 65:1. This corresponds to the rise in the chemical potential of the superlattice in the neighborhood of χerg = 0.5 (Fig. 5) and predicts a shorter spike duration when χerg increases from 0.40 to 0.50, as observed experimentally (Fig. 3).
DISCUSSION
We have presented a model that accounts for our experimental results in Figs. 1–3. A conceptual picture of the model is shown in Fig. 4. The principal elements of the model are:
The decay of channels is a result of a decay of ESLDs in which the sterols are arranged in a superlattice.
The decay of an ESLD results from diffusion of sterols from the superlattice into the lipid.
The ESLDs of sterol superlattices are generally circular.
The channels are linked to the ESLDs at the circumference.
We developed the model originally as a possible explanation of the linear decay observed in current spikes resulting from fusions. Therefore we have included in the model only those aspects of the physical situation we believe will have the greatest effect on the decay of nystatin/ergosterol channels. To keep the model mathematically tractable, we have introduced idealizations such as the planar hexagonal lattice for the lipid acyl chains. The model is not intended to provide a complete biophysical picture of the nystatin/ergosterol channels or of the ESLDs.
We have subjected this model to a statistical mechanical analysis and Monte Carlo simulation studies to compare the predictions of the model directly with experiment.
In these theoretical studies we considered only the sterol mol fractions of 0.40 and 0.50, both of which produce superlattices. Likewise for simplicity, in lipid vesicle experiments we considered only sterol concentrations designed to give superlattices. We did not observe fusion of vesicles containing 14.3% ergosterol, which still results in a superlattice (3). This may indicate that functional channels depend on a specific superlattice structure or that nystatin does not partition as strongly at the boundary for this low percentage superlattice. Also, no fusion was observed with ergosterol-free vesicles, confirming that these channels are not stable under these conditions.
As noted above, the fundamental concept that nystatin channels predominantly partition at ESLD boundaries is reasonable from a thermodynamic perspective. Similar partitioning is known to occur in the case of the lipase PLA2, which binds and hydrolyzes lipids at the boundaries of two lipid domains (28,29). We have begun molecular modeling to investigate potential physical arrangement of nystatin channels in a lipid bilayer, but these studies are still preliminary and are not easily extended to lipids in different superlattice configurations.
The statistical mechanical analysis of the model revealed that the rate of loss of functional channels is constant, in agreement with the experimental results of Figs. 1 and 2, provided the rate of loss of sterols from the ESLDs is constant. We supposed that the rate of loss of sterols was a result of diffusion from the ESLD into the bilayer. To determine the functional form of this diffusion we conducted Monte Carlo studies of the sterol loss from the boundary of the superlattices formed by the sterols at χerg = 0.40 and 0.50.
The Monte Carlo studies revealed that after ∼15–17 Monte Carlo steps, the sterol diffusion was constant (Fig. 8) for both principal symmetry directions for the superlattices obtained at χerg = 0.40 and 0.50. The ratios of the magnitudes of the current densities for these directions were found to be very nearly unity, indicating that the radial current density from a circular ESLD may be considered constant. A constant radial diffusion current density produces a linear loss of channels arranged uniformly around a circular ESLD in agreement with the experimental results of Figs. 1 and 2.
An approximate analysis of the actual times in Monte Carlo steps revealed that the energy differences experienced by sterols diffusing from the superlattices at χerg = 0.40 and 0.50 produce timescales which are related by a factor of 65. Although this analysis provides a timescale difference which is greater than experimental observation, we believe it provides at least the basis for a statistical understanding of the dramatic drop in spike durations observed between χerg = 0.40 and 0.50, as shown in Fig. 3.
The model makes no statement about the molecular interactions between nystatin channels and the sterols of the superlattice (or those diffusing from the superlattice). Specifically, the question of the dynamics of channel separation from an ESLD is not considered by the model. The model requires only that separation from the ESLD results in loss of the channel as a functional unit. However, simple thermodynamic considerations demand a small energy cost for the boundary, which decreases the net energy gained by formation of the superlattice. We envision that nystatin channels may act as a one-dimensional surfactant that partitions at the boundary and thereby lowers the boundary energy cost.
The model must also account for the multiple slopes that are often observed in fusion spikes. As we pointed out in the Introduction, vesicle fusion may produce a number of ESLDs, each with the superlattice of the original vesicle. The stresses experienced by the vesicle in the fusion event likely produce more complicated structures than the single superlattice shown in Fig. 4. Fig. 9 shows such a structure adapted from several different frames of the superlattice development from our Monte Carlo simulations. The ESLD contains a fissure and symbolic channels at the superlattice boundary.
FIGURE 9.

ESLD with fissure and channels. Symbols have same meaning as in Fig. 4. Outwardly diffusing ergosterol molecules have been added.
As a specific example, consider the case in which there are two ESLDs in the membrane after fusion. One has a uniform interior as in Fig. 4 (only much larger). The second ESLD is even larger and, like the one in Fig. 9, with an irregular internal fissure. The nystatin decay kinetics would be expected to look like the curves on the right side of Figs. 1 and 2. The initial fast fall is due to loss of channels from the perimeters of both ESLDs as ergosterol diffuses out of the ESLD. The smaller, uniform ESLD disappears first. Its demise is marked by a decrease in slope. The second ESLD continues to shrink until the perimeter intersects the fissure of Fig. 9. At that time the internal fissure opens up and two ESLDs are formed. This is marked by an increase in slope followed by a decrease as one of the new ESLDs disappears. Once all the channels are gone, the conductance returns to baseline, as observed. Thus, applying this model to a simple combination of ESLDs bordered with nystatin channels predicts current decays as observed.
The conclusion that nystatin channels form at lipid domain boundaries predicts not only the linear decay explained above, but also predicts a linear relationship between the size of a vesicle and the number of channels in a vesicle. In contrast, if nystatin channels form within a superlattice, or throughout the entire vesicle, then the number of channels should be proportional to the surface area of the vesicle. We have previously shown that channel number is not proportional to the square of the diameter (surface), but is linear or sublinear (Fig. 2, inset, of (16)). Table 2 displays spike-height data from over 150 fusion spikes obtained from vesicles in three different size ranges. The vesicles were sized by extrusion through a polycarbonate filter with hole size as indicated. As shown in Fig. 10, these data confirm a linear relationship. The model presented here is the first explanation for this unexpected linear relationship.
TABLE 2.
Spike height data from different size vesicles
| Prefilter size (nm) | Filter size (nm) | Postfilter size (nm) | Mean peak current (pA) | 95% Error (pA) | n |
|---|---|---|---|---|---|
| 400–750 | 100 | 100–140 | 1.23 | +0.36 | 42 |
| 400–750 | 200 | 200–240 | 2.50 | +0.75 | 47 |
| 400–750 | 1000 | 350–650 | 5.33 | +1.99 | 62 |
Spike height data from >150 fusion spikes obtained from vesicles in three different size ranges. The vesicles were sized by extrusion through a polycarbonate filter with hole size as indicated.
FIGURE 10.

Average fusion spike current is a linear function of vesicle diameter, not of vesicle surface area. Vesicles were prepared, as described in Methods with χerg = 0.22, except they were only briefly sonicated before extrusion through a filter. The prefilter size of vesicle prepared in this manner is variable but in the range indicated (determined by dynamic light scattering). Filtered vesicles have a much narrower size range. Fusion spike currents were recorded at +60 mV and averaged.
Upon detailed analysis, then, our proposed model has accounted for all of our present as well as previously obtained (and unexplained) experimental results. We believe, therefore, that it can be used as the basis of further investigations of nystatin/sterol channels, including the form of the chemical linkage between nystatin and the sterol discussed above.
Acknowledgments
The authors thank Dr. David Busath and Dr. Douglas Henderson for productive discussions during the course of this work.
This work was supported by National Institutes of Health grant No. MH50003 and by the Turner Laboratory and the Maple Scholars undergraduate research program (Goshen College).
APPENDIX A
In the constant  , the factor
  serves to nondimensionalize
  and provide a fine-grain limit on the phase space in accordance with the Heisenberg principle. The factor 1/Nj! is necessary because for indistinguishable particles we have Nj! integrals all alike. That is, the factor
  only accounts for dimensions and multiplicity of integrals and may be incorporated into the phase extension d
 . We then redefine d
 as
as 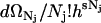 .
.
The grand canonical ensemble for a single species is then Eq. 1 with a summation only over a single component, N. The canonical partition is defined by Eq. 2 with Nj = N and Hj = NH1, where H1 is the single-particle (molecule) Hamiltonian. This simplified form of the Hamiltonian is specific to the system we are considering.
The relative size of the fluctuations in number in the grand canonical ensemble is very small, i.e.,  . We may then assume that the systems with particle numbers in the neighborhood of 〈N〉 are those that are of the most importance, and write
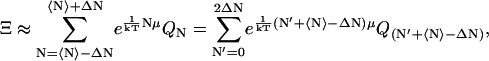 |
(A1) |
with N′ = N − 〈N〉 + ΔN.
We now assume that the ensemble average 〈N〉 is a time-dependent quantity. At time t, its value is 〈N〉 and at time t + δt, it is 〈N〉 + δtN. Then
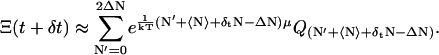 |
(A2) |
We now assume that the variation δtN is small. We expand Eq. A2 in powers of δtN and neglect O(δtN2). After some manipulation and upon reverting to the initial summation index, we have the time derivative of Ξ(t) from Eq. 11 and Eq. A2,
 |
(A3) |
Recognizing the summand of the grand canonical partition function in Eq. A3, we have
 |
(A4) |
That is, the time derivative of Ξ(t) has the same form it would have had if we differentiated the summation index N directly as a time function ignoring the summation.
APPENDIX B
We consider a circular superlattice of radius r with σS ergosterols per unit area and a total of NS ergosterols. Let there be nC channels per unit length around the circumference of the superlattice, each occupying a length λC of the circumference. Each channel carries a current IC. The rate of loss of ergosterols from the superlattice is
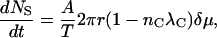 |
(B1) |
where A is a constant, δμ is the difference between the chemical potential of the superlattice and the immediate surroundings, and T is the absolute temperature. The area of the superlattice is πr2 = NS/σS. Then
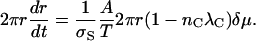 |
(B2) |
The number of channels on an ESLD of radius r is NC = 2πrnC. Then
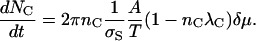 |
(B3) |
We assume that each channel carries a current IC until the channel becomes detached from the superlattice and is no longer functional. Then the rate of change of the bilayer current is
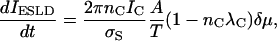 |
(B4) |
which is a constant.
APPENDIX C
To determine the ratio of timescales for our Monte Carlo simulations at different mol fractions, we assume that the ergosterol molecules released from the superlattice undergo a transition from an energy Eμ → Eν. We have taken these energies to be the average over the possible energy change for a sterol in the simulation and determined this energy change during the simulation.
The transition probabilities in the Monte Carlo simulation are
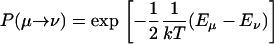 |
(C1) |
We shall take this as the probability for the actual transitions of ergosterol molecules.
The time per Monte Carlo step τS is
 |
(C2) |
The time per transition is inversely proportional to the probability of transition,
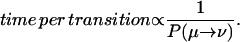 |
(C3) |
The transitions per Monte Carlo step is the current obtained in terms of ergosterols released per Monte Carlo step. We shall call this Jμν . Then, using Eq. C1 and Eq. C3 in Eq. C2, we have
 |
(C4) |
The ratio of timescales at two different sterol concentrations is then
 |
(C5) |
Here we assume that the energy in the free lipid, Eν, is the same in each case.
References
- 1.Baumgart, T., S. T. Hess, and W. W. Webb. 2003. Imaging coexisting fluid domains in biomembrane models coupling curvature and line tension. Nature. 425:821–824. [DOI] [PubMed] [Google Scholar]
- 2.Cannon, B., G. Heath, J. Huang, P. Somerharju, J. A. Virtanen, and K. H. Cheng. 2003. Time-resolved fluorescence and Fourier transform infrared spectroscopic investigations of lateral packing defects and superlattice domains in compositionally uniform cholesterol/phosphatidylcholine bilayers. Biophys. J. 84:3777–3791. [DOI] [PMC free article] [PubMed] [Google Scholar]
- 3.Chong, P. L.-G. 1994. Evidence for regular distribution of sterols in liquid crystalline phosphatidylcholine bilayers. Proc. Natl. Acad. Sci. USA. 91:10069–10073. [DOI] [PMC free article] [PubMed] [Google Scholar]
- 4.Coutinho, A., L. Silva, A. Fedorov, and M. Prieto. 2004. Cholesterol and ergosterol influence nystatin surface aggregation: relation to pore formation. Biophys. J. 87:3264–3276. [DOI] [PMC free article] [PubMed] [Google Scholar]
- 5.Coutinho, A., and M. Prieto. 2003. Cooperative partition model of nystatin interaction with phospholipid vesicles. Biophys. J. 84:3061–3078. [DOI] [PMC free article] [PubMed] [Google Scholar]
- 6.Dietrich, C., L. A. Bagatolli, Z. N. Volovyk, N. L. Thompson, M. Levi, K. Jacobson, and E. Gratton. 2001. Lipid rafts reconstituted in model membranes. Biophys. J. 80:1417–1428. [DOI] [PMC free article] [PubMed] [Google Scholar]
- 7.Huang, J. 2002. Exploration of molecular interactions in cholesterol superlattices: effect of multibody interactions. Biophys. J. 83:1014–1025. [DOI] [PMC free article] [PubMed] [Google Scholar]
- 8.Huang, J., and G. W. Feigenson. 1999. A microscopic interaction model of maximum solubility of cholesterol in lipid bilayers. Biophys. J. 76:2142–2157. [DOI] [PMC free article] [PubMed] [Google Scholar]
- 9.Liu, F. L., I. P. Sugar, and P. L.-G. Chong. 1997. Cholesterol and ergosterol superlattices in three-component liquid crystal bilayers as revealed by dehydroergosterol fluorescence. Biophys. J. 72:2243–2254. [DOI] [PMC free article] [PubMed] [Google Scholar]
- 10.Pandit, S. A., E. Jakobsson, and H. L. Scott. 2004. Simulation of the early stages of nano-domain formation in mixed bilayers of sphingomyelin, cholesterol, and dioleoylphosphatidylcholine. Biophys. J. 87:3312–3322. [DOI] [PMC free article] [PubMed] [Google Scholar]
- 11.Parker, A., K. Miles, K. H. Cheng, and J. Huang. 2004. Lateral distribution of cholesterol in dioleoylphosphatidylcholine lipid bilayers: cholesterol-phospholipid interactions at high cholesterol limit. Biophys. J. 86:1532–1544. [DOI] [PMC free article] [PubMed] [Google Scholar]
- 12.Samsonov, A. V., I. Mihalyov, and F. S. Cohen. 2001. Characterization of cholesterol-sphingomyelin domains and their dynamics in bilayer membranes. Biophys. J. 81:1486–1500. [DOI] [PMC free article] [PubMed] [Google Scholar]
- 13.Radhakrishnan, A., and H. M. McConnell. 1999. Condensed complexes of cholesterol and phospholipids. Biophys. J. 77:1507–1517. [DOI] [PMC free article] [PubMed] [Google Scholar]
- 14.Wang, M. M., I. P. Sugar, and P. L.-G. Chong. 1998. Role of the sterol superlattice in the partitioning of the antifungal drug nystatin into lipid membranes. Biochemistry. 37:11787–11805. [DOI] [PubMed] [Google Scholar]
- 15.Pick, U. 1981. Liposomes with a large trapping capacity prepared by freezing and thawing of sonicated phospholipid mixtures. Arch. Biochem. Biophys. 212:187–197. [DOI] [PubMed] [Google Scholar]
- 16.Woodbury, D. J. 1999. Nystatin/ergosterol method for reconstituting ion channels into planar lipid bilayers. Ion channels, part C. Meth. Enzymol. 294:319–339. [DOI] [PubMed] [Google Scholar]
- 17.Woodbury, D. J., and C. Miller. 1990. Nystatin-induced liposome fusion: a versatile approach to ion channel reconstitution into planar bilayers. Biophys. J. 58:833–839. [DOI] [PMC free article] [PubMed] [Google Scholar]
- 18.Huang, K. 1987. Statistical Mechanics, 2nd Ed. John Wiley, New York.
- 19.Toda, M., R. Kubo, and L. Saitô. 1983. Statistical Physics I. Springer-Verlag, Berlin, Heidelberg, New York, Tokyo.
- 20.Davidson, N. 1962. Statistical Mechanics. McGraw-Hill, New York.
- 21.Hill, T. L. 1956. Statistical Mechanics. McGraw-Hill, New York.
- 22.Kirkwood, J. G. 1935. Statistical mechanics of fluid mixtures. J. Chem. Phys. 3:300–313. [Google Scholar]
- 23.Kirkwood, J. G. 1936. Statistical mechanics of liquid solutions. Chem. Rev. 19:275–307. [Google Scholar]
- 24.Haile, J. M. 1986. On the use of computer simulation to determine the excess free energy in fluid mixtures. Fluid Phase Eq. 26:103–127. [Google Scholar]
- 25.Chialvo, A. A. 1990. Determination of excess Gibbs free energy from computer simulation by the single charging-integral approach. I. Theory. J. Chem. Phys. 92:673–679. [Google Scholar]
- 26.Metropolis, N., A. N. Rosenbluth, M. N. Rosenbluth, A. H. Teller, and E. Teller. 1953. Equation of state calculation by fast computing machines. J. Chem. Phys. 21:1087–1092. [Google Scholar]
- 27.Nielsen, M., L. Miao, J. H. Ipsen, M. J. Zuckermann, and O. G. Mouritsen. 1999. Off-lattice model for the phase behavior of lipid-cholesterol bilayers. Phys. Rev. E. 59:5790–5803. [DOI] [PubMed] [Google Scholar]
- 28.Grainger, D. W., A. Reichert, H. Ringsdorf, and C. Salesse. 1990. Hydrolytic action of phospholipase A2 in monolayers in the phase transition region: direct observation of enzyme domain formation using fluorescence microscopy. Biochim. Biophys. Acta. 1023:365–379. [DOI] [PubMed] [Google Scholar]
- 29.Henshaw, J. B., C. A. Olsen, A. R. Farnbach, K. H. Nielson, and J. D. Bell. 1998. Definition of the specific roles of lysolecithin and palmitic acid in altering the susceptibility of dipalmitoylphosphatidylcholine bilayers to phospholipase A2. Biochemistry. 37:10709–10721. [DOI] [PubMed] [Google Scholar]