

Abstract
We present the crystalline organization of 33 all-AT deoxyoligonucleotide duplexes, studied by x-ray diffraction. Most of them have very similar structures, with Watson-Crick basepairs and a standard average twist close to 36°. The molecules are organized as parallel columns of stacked duplexes in a helical arrangement. Such organization of duplexes is very regular and repetitive: all sequences show the same pattern. It is mainly determined by the stacking of the terminal basepairs, so that the twist in the virtual TA base step between neighbor duplexes is always negative, ∼−22°. The distance between the axes of parallel columns is practically identical in all cases, ∼26 Å. Interestingly, it coincides with that found in DNA viruses and fibers in their hexagonal phase. It appears to be a characteristic distance for ordered parallel DNA molecules. This feature is due to the absence of short range intermolecular forces, which are usually due to the presence of CG basepairs at the end of the oligonucleotide sequence. The duplexes apparently interact only through their diffuse ionic atmospheres. The results obtained can thus be considered as intermediate between liquid crystals, fibers, and standard crystal structures. They provide new information on medium range DNA-DNA interactions.
INTRODUCTION
The availability of whole genome sequences has unveiled some striking features of the DNA sequence. One of them is the abundance of AT bases in noncoding regions, in particular in introns (1) and in matrix-associated sequences (MARs, SARs) (2). There is no available explanation for these findings. In yeast it has been found (3) that poly(dA-dT) stretches are regularly present in nucleosome-free regions where they probably play a structural role. In the case of lower organisms, some genomes have a very high AT content (4). The social ameba Dictyostelium discoideum, for example, has 78% AT content. Intergenic regions are very rich in AT, with many of them over 90% AT (5). It should be noted that Dictyostelium is one of the most primitive organisms capable of cell differentiation. There is no obvious relationship between the latter feature and the high AT content. Nevertheless the high AT content in noncoding regions and in some organisms suggests that the AT bias in composition may play some structural and/or epigenetic role in genome function.
Despite its obvious interest, very few studies have been carried out on AT-rich sequences. For example, there is no structure available of any complex of a protein associated with an all-AT DNA sequence. It is known that such sequences are strongly polymorphic (6,7). Their structure may change as a function of temperature (8,9) and in the presence of high salt concentrations (10). In our laboratory, we have recently found that oligonucleotides with an alternating AT sequence may form Hoogsteen duplexes (11) and coiled-coils (12). In the case of all-AT oligonucleotides with a nonalternating sequence, there is only one structure available: the octamer AAATATTT (13).
In view of this situation, we decided to study the structure of a significant number of all-AT oligonucleotides by single crystal x-ray diffraction. One of the motivations for our work was to determine whether such sequences might also form Hoogsteen duplexes. Preliminary attempts showed that oligonucleotides that start with T do not crystallize easily. Therefore, we carried out our studies on self-complementary oligonucleotides that start with A. We have studied all possible hexamer (4 cases), octamer (8 cases), and decamer (16 cases) sequences, as well as a few dodecamers and tetradecamers. In most cases, the crystals have very large unit cells, so that synchrotron radiation was essential to study them. Practically all of them crystallize as helical arrangements of stacked oligonucleotides (HASO structure), building parallel columns. The oligonucleotide columns do not show any obvious direct lateral intermolecular interactions, which could stabilize packing in the crystal. As a result the crystals usually diffract up to a limited resolution (4–6 Å). Nevertheless, in most cases columns are packed in a very regular pseudohexagonal lattice, independent of length and sequence. Such packing appears to be due to the electrostatic field of DNA. The structures obtained may be considered as intermediate between real crystals, liquid crystals, and fibers. An advantage of this situation is that the structures obtained are highly hydrated and may be comparable to solution NMR results. The disadvantage is that atomic resolution is not always attained. On the other hand, our results may help to understand some features of DNA packing in viruses and of liquid crystalline spermine-DNA complexes, which are being studied in detail in several laboratories (14–18). This question will be considered in the Discussion. The main difference is that in our work we use both spermine and an alcohol precipitant to obtain crystals.
In most previously studied oligonucleotides, the crystal lattice is stabilized by the interactions of guanine, either directly with other guanines or indirectly through the strong affinity of the N7 atom of guanine with divalent cations. The absence of guanine in the oligonucleotides presently studied prevents such interactions. Our results allow a comparison of the structure of all-AT duplexes with AT regions embedded in CG sequences.
MATERIALS AND METHODS
Oligonucleotides were prepared by the phosphoramidite method and purified by high-performance liquid chromatography. Crystals were obtained by vapor diffusion in hanging drops in cacodylate buffers with spermine and 2-methyl-2,4-pentanodiol as precipitants. To optimize conditions, various divalent cations were added to the drops. A list of the conditions used in the crystals from which the reported data were collected is given as Supplementary Material. Many more trials were performed, and similar results were obtained with different ions under similar conditions. Very often birefringent needles with blunt ends were obtained, which indicated poor quality of the crystals. Attempts to improve their quality were carried out by narrowing down the conditions used for crystallization.
Diffraction data were collected at the BM16 Spanish line at the European Synchrotron Radiation Facility. Depending on the resolution, the rotation angle for each image was varied between 2° and 15°. When possible, the collected data were processed automatically with either DENZO or HKL2000 (19). However, in many cases, only a limited number of spots were collected, which is due to several factors: low resolution, high mosaicity, intrinsic symmetry of the DNA duplexes, eventual presence of a small pseudocell, etc. Furthermore, in most cases, the unit cell is highly asymmetric, with a very large c parameter. The combination of all these factors prevented automatic processing. In such cases the parameters of the true unit cell were determined manually with the help of MOSFLM (20). In practically all cases, the patterns could be indexed in either a trigonal or pseudohexagonal unit cell.
For the purpose of the results reported here, there are only a few parameters of interest that can be adequately calculated manually: the size of the unit cell; length, orientation, and distance among duplexes inside the unit cell; and average distance among basepairs in the double helical duplexes.
In the rotation diagrams that we have collected, there is always a region in which the c axis of the unit cell is approximately parallel to the spindle axis of the goniometer. Then the c axis is approximately vertical in oscillation patterns, such as those shown in Figs. 1 and 2. From them it is immediately clear that the oligonucleotide duplexes are approximately parallel to the c direction of the unit cell, since the strong stacking reflection appears as a sharp streak and is meridionally oriented.
FIGURE 1.

Oscillation patterns of different crystals with the c axis approximately vertical. (a) AAATTT, 5° oscillation; (b) AAATATTT (Form II), 3° oscillation; (c) AATAATTATT (Form II), 10° oscillation; and (d) AATATATATT, 2° oscillation.
FIGURE 2.

Enlarged view of the center of the oscillation pattern obtained from different crystals with the c axis approximately vertical. (a) AAATATTT (Form II), 15° oscillation, from the same crystal as in Fig. 1 b; (b) AAAATTTT, 15° oscillation; (c) AATAATTATT (Form II), 10° oscillation, from the same crystal as in Fig. 1 c; and (d) ATAAATATATTTAT, 15° oscillation. Note the pairs of closely spaced spots in a and b, which allow a determination of the number of duplexes in a HASO column as described in the text.
The meridional [00l] spots give a direct measure of the length l of individual duplexes. The length of one duplex is the spacing that corresponds to the smallest strong reflection along the c axis. For example, it is very prominent in Fig. 2 b, but weaker in Fig. 2 a.
The rise is the spacing that corresponds to the strong base-stacking reflection. Since the latter reflection is rather broad, the average distance between basepairs (rise parameter) was determined by dividing l by the number of bases in one duplex. The value of rise calculated in this way was found to be within 1% of the spacing of the prominent stacking reflection.
The c value of the unit cell was determined from the distance between closely spaced spots, such as those visible in the different frames in Fig. 2. In a few cases, as indicated in the tables, only sharp streaks were visible. From their spacing, the value of c could also be determined. The number of stacked duplexes in one unit cell was then determined from the value c/l. Simulations and drawings were prepared with the CERIUS2 program (Acelrys, San Diego, CA).
RESULTS
General features
Examples of the diffraction patterns are given in Figs. 1 and 2. A striking feature in all of them is the presence of rather few diffraction spots, despite the large unit cells. This is due to the presence of pseudosymmetry, as it will become apparent below.
The DNA duplexes are organized as parallel stacked and aligned columns, as indicated by the well-defined meridional stacking reflection at ∼3.3 Å spacing. Resolution is often limited to 5–6 Å. Most patterns can be indexed in a P3 related space group, with unit cell sides (a = b) of ∼45 Å, which correspond to a 26 Å distance between the axes of neighbor duplexes. Other space groups have been found in a few cases, but all of them show a pseudohexagonal arrangement, as it will be described in detail below. The 26 Å distance between columns of duplexes corresponds to a large volume per basepair, ∼1900 Å3. In conventional crystals of oligonucleotides with a mixed sequence, this volume is significantly smaller, ∼1300 Å3. Such a high hydration in the absence of strong interactions explains the low resolution we have found in most of the diffraction patterns. Even in those patterns that diffract to a higher resolution (∼3 Å), high mosaicity is found, as it is evident in Fig. 1 d.
When inspected in detail (Fig. 2, a and b), some of the spots either appear double or show a weaker spot next to it. The close spacing of the spots indicates a relatively large value of the c dimension of the unit cell. In other cases, no double spots are detected, but they clearly fall in different layer lines. All spots in each pattern can then be indexed with such c dimension.
Given the intrinsic symmetry of the DNA duplexes, we have assumed that the space group is P321, with dyad axes that relate half of a column of duplexes with the other half. However the eventual presence of a dyad axis has no influence on the results we will describe. In such space groups, either P3 or P321, there are no systematic absences, so it is surprising that only a few spots can be detected. This fact can be easily explained by the presence of a smaller pseudocell with a smaller number of duplexes in it. Examples will be given below. Crystal symmetry will be further analyzed in the Discussion section.
The HASO structure
Before describing further our results, it is appropriate to define what we consider a HASO structure. In most oligonucleotide crystal structures, the duplexes are stabilized by intermolecular interactions that have a strong influence in the organization of the crystal. The best known of such interactions is the one found in the Dickerson dodecamer, where the terminal CG sequence is involved in lateral interactions with neighbor duplexes (21). In the case of decamers with mixed sequences, the situation is different. End-to-end interactions are present that define a continuous pseudohelical arrangement (22): the terminal basepairs of contiguous duplexes are stacked and define a virtual base step in which the phosphate groups are missing. This is a simple case of what we call a HASO structure. A scheme is shown in Fig. 3. Neighbor oligonucleotides are approximately coaxial. The twist in each virtual base step is called ωT. The overall rotation of one duplex with respect to its neighbor in a column is called Ω, which is related to the individual twist values by the relation
 |
(1) |
where n is the number of basepairs in a duplex and 〈ω〉 is the average twist of its base steps.
FIGURE 3.

Scheme of the HASO structure. Two octamers are shown. Each duplex rotates an angle Ω with respect to its neighbor in a column. The twist ωT of the virtual base step between the terminal basepairs in contact is also represented. It is negative in the case of the TA sequence present in all the duplexes studied in this article.
In the autocomplementary duplexes studied in this article, the value of 〈ω〉 is expected not to vary much. The low twist of the AT step should be compensated by the high twist of the TA step. If the average values obtained from mixed CG/AT sequences and calculated by Gorin et al. (23) are used, the value of 〈ω〉 turns out to be 35.9 ± 0.5°. The higher values correspond to long alternating sequences, such as ATATATATATATAT, whereas the lower values correspond to short continuous sequences such as AAATTT.
The value of Ω can be exactly determined once the number N of duplexes stacked in one unit cell is known, since NΩ must be an exact multiple of 360°, so that the following relationship must be obeyed, with m a whole number:
 |
(2) |
Such determination is usually unambiguous, with some exceptions that will be noted in the presentation of the results. The helical arrangement that is obtained with these geometrical requirements has N individual duplexes in m turns, equivalent to 360/Ω duplexes per turn of the overall helix. Note that when Ω > 360°, one should use the alternative expression 360°/(Ω −360°). Most cases described in the literature correspond to the trivial case Ω = 360°, which generates a translation, equivalent to a HASO structure with one duplex per turn of the helix. From such structures it is possible to calculate the values of ωT, which are given in Table 1. The base step AT is absent from the table since no crystal structure is available for any autocomplementary oligonucleotide that starts with T. No data are available for the other base steps, which would require crystals of nonautocomplementary oligonucleotides.
TABLE 1.
Twist values between contiguous stacked terminal base steps (virtual steps)
The values in the table have been calculated from Eq. 1 and the 〈ω〉 values reported in the Nucleic Acid Database (37). In all cases, Ω = 360°, with the exception of the CG value for which Ω = 480°. The range of variation is also indicated. In the case of TA, we have considered the seven values available and excluded one (ωT = −27.5°), which appears to be an outlier.
In this context, we should note that Timsit, Moras, and co-workers have published three isomorphous structures obtained from related nonautocomplementary dodecamers in which they find virtual steps AA/TT (24), CA/TG (25), and CG (26). The three of them have ωT negative values similar to those found in the TA case (27,28). However, since the structures are isomorphous and are stabilized by similar strong groove-groove interactions, we have not included these values in Table 1, since end-to-end interactions appear to be marginal in the latter structures (24–26).
In the structures that we will describe in this article, the resolution is not sufficient to determine directly the values of ωT and 〈ω〉 in Eq. 1; only the value of Ω can be calculated. However, we should expect a limited range of variation of ωT (Table 1) and 〈ω〉 should be close to 36°, as discussed above. In all the cases studied in this article, we have a TA virtual base step between neighbor duplexes in a HASO column. In Fig. 4, we compare a conventional TA base step within an oligonucleotide duplex (29), which has very poor base stacking (30), with the virtual base step found in the HASO structures reported in this article. It is clear that the negative value of ωT in the latter case generates a much better stacking, which may explain why ωT is found to be negative. Furthermore, it is stabilized by hydrogen bonds between the O5′ terminal atom and a phosphate oxygen in a neighbor duplex (13). In the tables that follow, we will assume ωT = −22° in all cases and calculate 〈ω〉 from Eq. 1. We will start our presentation with the octamer structures, which give a clear overall view of the HASO organization.
FIGURE 4.

Stereo view showing a comparison of stacking in the virtual base step between the ends of two AAATATTT duplexes (13) in a HASO structure (upper frame), with the T5-A6 step (lower frame) in the CGCATATATGCG duplex (29).
Octamers
The eight possible duplexes have been studied. Suitable crystals were obtained from six sequences. In the case of ATTATAAT, we found two different forms in crystals obtained from the same crystallization droplet. Structural data are summarized in Table 2. In this case, we expect Ω to have a value close to 230°, since in Eq. 1 Ω = 7 × 36° − 22° = 230°. As shown in Table 2, Ω values deviate <3° from the 230° value. HASOs with either 11, 14, or 17 duplexes in a helical repeat are found, with estimated 〈ω〉 values between 35.9° and 36.4°, if ωT is assumed to be −22° as mentioned above.
TABLE 2.
Structural parameters of all-AT octamers
| Sequence | Base steps AA – AT – TA | Unit cell (Å) | Space group | Helix type | Ω(°) | 〈ω〉 (°) | Length (Å) | Rise (Å) | Comments |
|---|---|---|---|---|---|---|---|---|---|
| AAAATTTT | 6 – 1 – 0 | 47.3x47.3 × 444 | P321 | 17/11 | 232.9 | 36.4 | 26.1 | 3.26 | |
| AAATATTT (I) | 4 – 2 – 1 | 147.6 × 25.0x82.1 β = 90.51° | C2 | 11/7 | 229.1 | 35.9 | 26.2 | 3.27 | Reference 13 |
| AAATATTT (II) | 4 – 2 – 1 | 43.0 × 43.0x367 | P321 | 14/9 | 231.4 | 36.2 | 26.2 | 3.28 | |
| AATTAATT | 4 – 2 – 1 | 43.7 × 43.7x366 | P321 | 14/9 | 231.4 | 36.2 | 26.1 | 3.26 | |
| ATTTAAAT | 4 – 2 – 1 | 44.3 × 44.3x288 | P321 | 11/7 | 229.1 | 35.9 | 26.2 | 3.27 | |
| ATAATTAT | 2 – 3 – 2 | – | – | – | – | – | – | – | Poor crystals |
| ATTATAAT (I) | 2 – 3 – 2 | 42.6 × 42.6 × 367 | P321 | 14/9 | 231.4 | 36.2 | 26.2 | 3.28 | Mainly streaks |
| ATTATAAT (II) | 2 – 3 – 2 | 43.6 × 43.6 × 289 | P321 | 11/7 | 229.1 | 35.9 | 26.3 | 3.29 | |
| AATATATT | 2 – 3 – 2 | 43.5 × 43.5 × 286.1 | P321 | 11/7 | 229.1 | 35.9 | 26.0 | 3.25 | |
| ATATATAT | 0 – 4 – 3 | – | – | – | – | – | – | – | No crystals |
| Pseudocell | – | 44 × 44 × 78.3 | P3 | 3/2 | 240 | 36 | 26.1 | 3.26 | ωT = −12° |
All diffraction patterns are similar, except Form I of AAATATTT presented elsewhere (13). Some examples are shown in Figs. 1 b and 2, a and b. Comparison of Fig. 2, a and b, clearly shows that the neighbor spots in AAAATTTT are more closely spaced than in AAATATTT (Form II), which indicate a larger unit cell for AAAATTTT and a larger number of duplexes in the HASO structures, as summarized in Table 2.
A model for the AAATATTT (Form II) structure is presented in Fig. 5. Its diffraction pattern has been simulated with CERIUS2 and is shown in Fig. 6 superimposed on the experimental results. The overall appearance is practically identical; some spots are doubled both in the experimental and simulated results.
FIGURE 5.
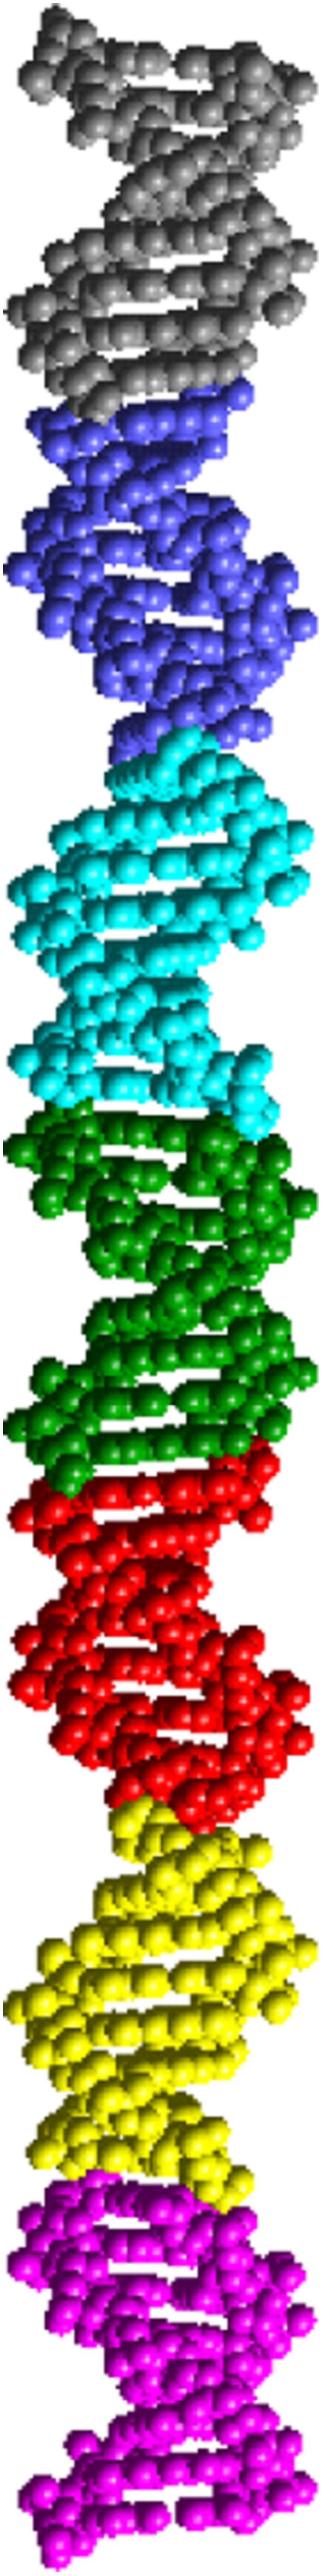
Model of the asymmetric unit of d(AAATATTT), Form II, a column of seven duplexes. The dyad axis in the P321 cell creates a column of 14 duplexes, which is equivalent to the c dimension of the unit cell. The 14 duplexes correspond to one helical turn of the HASO structure.
FIGURE 6.

Superposition of the simulated and experimental diffraction patterns of d(AAATATTT), Form II. The black dots correspond to the experimental data (Fig. 2 a). The yellow circles have been calculated for the model shown in Fig. 5 with the Cerius2 program. The patterns correspond to the [100] diffraction region. Some of the hkl indices are indicated. The diffraction simulated for the pseudocell discussed in the text is practically identical, no double spots are present in this case.
The diffraction patterns of all octamers, presented in Figs. 1, 2, and 6, can be simulated from a smaller pseudocell. As shown in Table 1, the values of Ω are close to 240°. Thus a P3 pseudocell with a HASO of three duplexes in the asymmetric unit with c = 26.1 × 3 = 78.3 Å and Ω = 240° shows the main features of the actual diffraction patterns. A partial view of the pseudocell is presented in Fig. 7. Its diffraction pattern (not shown) is practically identical with the one presented in Fig. 6. The main difference is that no double diffraction spots are present.
FIGURE 7.

A view of one layer of the pseudocell for the octamers discussed in the text. Its asymmetric unit contains three duplexes with Ω = 240°. They are shown in different colors. Each column is rotated 120° with respect to its neighbors. It is apparent that minor grooves never face each other. The same feature is found in all the other structures in the P321 space group.
It should be noted that in a P321 space group, the three parallel oligonucleotide columns in each unit cell are rotated by ±120° with respect to their neighbors. As a result, each column is surrounded by six columns with alternate rotations of −120° and +120°, as shown in Fig. 8. This feature is also present in most of the other oligonucleotide structures that we will present in the next paragraphs. The significance of this observation will be analyzed in the Discussion section.
FIGURE 8.

Projection of four unit cells in the P321 and R32 space groups. Each duplex is surrounded by six identical duplexes with alternate relative rotations of ±120°.
Decamers
There are 16 possible duplexes formed by all-AT autocomplementary decamers that start with A. We have studied all of them (Table 3). Only in one case we did not obtain suitable crystals. Examples of the diffraction patterns are shown in Figs. 1, c and d, and 2 c. The results obtained are presented in Table 3. In the case of the alternating decamer ATATATATAT, we found coiled-coil structures similar to those previously observed (12). They will be described elsewhere.
TABLE 3.
Structural parameters of decamers
| Sequence | Base steps AA – AT – TA | Unit cell (Å) | Space group | Helix type | Ω(°) | 〈ω〉 (°) | Length (Å) | Rise (Å) | Comments |
|---|---|---|---|---|---|---|---|---|---|
| AAAAATTTTT | 8 – 1 – 0 | 45.2 × 45.2 × 194 | P321 | 6/5 | 300 | 35.8 | 32.3 | 3.23 | |
| AAAATATTTT | 6 – 2 – 1 | 45.1 × 45.1 × 194 | P321 | 6/5 | 300 | 35.8 | 32.3 | 3.23 | |
| AAATTAATTT | 6 – 2 – 1 | 46.3 × 46.3 × 424 | P321 | 13/11 | 304.6 | 36.3 | 32.8 | 3.28 | |
| AATTTAAATT | 6 – 2 – 1 | 45.9 × 45.9 × 197 | P321 | 6/5 | 300 | 35.8 | 32.8 | 3.28 | |
| ATTTTAAAAT | 6 – 2 – 1 | 69.1 × 44.4 × 77.0 90°, 111.6°, 90° | C2 | 6/5 | 300 | 35.8 | 32.1 | 3.21 | |
| AAATATATTT | 4 – 3 – 2 | 26.5 × 26.5 × 230 90–90–120° | P1 | 7/6 | 308.6 | 36.7 | 32.9 | 3.29 | With netropsin |
| AATTATAATT | 4 – 3 – 2 | 44.9 × 44.9 × 198 | R32 | 6/5 | 300 | 35.8 | 32.9 | 3.29 | |
| AATAATTATT (I) | 4 – 3 – 2 | 44.6 × 44.6 × 194.8 | P321 | 6/5 | 300 | 35.8 | 32.5 | 3.25 | |
| AATAATTATT (II) | 4 – 3 – 2 | 44.2 × 44.2 × 195.8 | R32 | 6/5 | 300 | 35.8 | 32.6 | 3.26 | With peptide |
| AATAATTATT (III) | 4 – 3 – 2 | 70.5 × 38.5 × 76.3 90°, 111.6°, 90° | P2 | – | – | – | 32.8 | 3.28 | |
| AATAATTATT (IV) | 4 – 3 – 2 | 70.0 × 43.8 × 76.3 90°, 111.0°, 90° | C2 | 6/5 | 300 | 35.8 | 32.7 | 3.27 | With peptide |
| ATTAATTAAT (I) | 4 – 3 – 2 | 47.7 × 47.7 × 197 | P321 | 6/5 | 300 | 35.8 | 32.8 | 3.28 | Only streaks |
| ATTAATTAAT (II) | 4 – 3 – 2 | 43.7 × 43.7 × 228 | P321 | 7/6 | 308.6 | 36.7 | 32.6 | 3.26 | |
| ATAAATTTAT | 4 – 3 – 2 | 44 × 44 × 196 | P321 | 6/5 | 300 | 35.8 | 32.7 | 3.27 | |
| ATTTATAAAT | 4 – 3 – 2 | – | – | – | – | – | – | – | Poor crystals |
| ATAATATTAT | 2 – 4 – 3 | 45.5 × 45.5 × n.d. | – | – | – | – | 32.7 | 3.27 | Diffuse pattern |
| ATATTAATAT | 2 – 4 – 3 | 43.1 × 43.1 × 196.8 | P321 | 6/5 | 300 | 35.8 | 32.8 | 3.28 | |
| ATTATATAAT | 2 – 4 – 3 | 45.1 × 45.1 × 197.4 | P321 | 6/5 | 300 | 35.8 | 32.9 | 3.29 | |
| AATATATATT | 2 – 4 – 3 | 44.7 × 44.7 × 198 | P321 | 6/5 | 300 | 35.8 | 33.0 | 3.30 | |
| ATATATATAT | 0 – 5 – 4 | Several | Several | – | – | – | – | – | Coiled-coil |
| ATATGCATAT | – | 44 × 44 × 262 | P321 | 8/7 | 315 | 37.4 | 32.9 | 3.29 | Contains CG |
In the case of decamers, we should expect Ω = 36° × 9 − 22° = 302° . We have detected two main types of helical arrangements, with either six or seven duplexes in the unit cell, which correspond to Ω equal to either 300° or 308.6°, as summarized in Table 3. Only in one case we found a HASO structure with 13 duplexes in a column, which corresponds to Ω = 304.6°. The 6/5 helix found in most cases corresponds to a left-handed helix with six duplexes per turn, a symmetry that is compatible with a 65 crystallographic axis. However, the overall symmetry of the crystal does not appear to allow such axis. On the other hand, a 32 screw axis is possible in this case, so that some decamers are found to crystallize in a highly symmetrical R32 space group, with a single duplex in the asymmetric unit. In fact, some of the decamer structures for which we have assigned a P321 space group could be due to twinned R32 crystals. Other related space groups are also possible. In fact, in some cases we found monoclinic space groups (P2 or C2), as it will be described at the end of the Results section. In all cases, a similar pseudohexagonal organization is present and related HASO structures are found.
A decamer with central CG basepairs
We have also studied the decamer ATATGCATAT, which forms a duplex with two central CG basepairs. Since they occupy a central position, they should not influence much the overall organization of the HASO structure. This is in fact what is observed, as indicated by its structural parameters (Table 3). It forms a HASO structure with eight duplexes in seven turns, which corresponds to Ω = 315° and 〈ω〉 = 37.4°. The latter value is larger than those found in all-AT duplexes, a result due to a larger twist in the TG/CA steps (23,31).
Dodecamers
Shakked and co-workers (27,28) have studied several dodecamers with mixed sequence that form trivial HASO structures with Ω = 360°. In such cases from Eq. 1, it turns out that 〈ω〉 = 34.7°, a value in agreement with what should be expected for mixed sequence DNA. In the case of the all-AT dodecamers studied here, the situation is more complex, since we should expect Ω = 36° × 11 − 22° = 374°, which is very close, but deviates significantly from 360°.
We have studied five dodecamer sequences; their structural data are summarized in Table 4. An example of their diffraction pattern is presented in Fig. 9. In this case, we find a pseudocell with only one dodecamer in the asymmetric unit, with Ω = 360° (Fig. 9 and Table 4). This pseudocell is equivalent to the structures studied by Shakked et al. (27,28) mentioned above, although in our case there are three symmetry-related duplexes in a P3 unit cell. The observed diffraction patterns are practically identical with the one produced by the pseudocell. The diffraction spots appear at approximately the same position as it is found in the pseudocell, but close inspection shows that they are not found on the same layer lines, as demonstrated in Fig. 9. Only occasional double spots are found. As a result, it is difficult to determine the exact number N of duplexes in the HASO helix. The values given for the c parameter in Table 4 are only approximate, in particular for AATTAATTAATT and AATATATATATT, which have a value of Ω closer to 360°.
TABLE 4.
Structural parameters of all-AT dodecamers and tetradecamers
| Sequence | Base steps AA – AT – TA | Unit cell (Å) | Space group | Helix type | Ω(°) | 〈ω〉 (°) | Length (Å) | Rise (Å) | Comments |
|---|---|---|---|---|---|---|---|---|---|
| AAAAAATTTTTT | 10 – 1 – 0 | 44.2 × 44.2 × 890 | P321 | 23/24 | 375.7 | 36.2 | 38.8 | 3.23 | Additional structures found |
| AATAAATTTATT | 6 – 3 – 2 | 45.4 ×45.4 × 650 | P321 | 17/18 | 381.2 | 36.7 | 38.4 | 3.20 | |
| AATTAATTAATT | 6 – 3 – 2 | 43.9 × 43.9 × n.d. | P321 | n.d. | n.d. | n.d. | 39.0 | 3.25 | Large c not measurable |
| AATATATATATT | 2 – 5 – 4 | 45.8 × 45.8 × 1300 | P321 | 34/35 | 370.6 | 35.7 | 38.6 | 3.22 | |
| Pseudocell | – | 44 × 44 × 38.8 | P3 | 1/1 | 360.0 | 36.0 | 38.8 | 3.23 | ωT = -36° |
| ATATATATATAT | 0 – 6 – 5 | 27.9 × 27.9 × 216 | P6122 | 6/1 | – | – | – | – | Hoogsteen coiled-coil (12) |
| ATAAATATATTTAT | 4 – 5 – 4 | 25.4 × 25.4 × 183.2 90–90–120° | P1 | 4/5 | 450.0 | 36.3 | 45.8 | 3.27 | |
| ATATATATATATAT | 0 – 7 – 6 | 25.5 × 25.5 × n.d. | P1 | – | – | – | 45.1 | 3.22 | Fiber pattern |
FIGURE 9.

At the left is presented a 15° oscillation diffraction image in the [100] region of the dodecamer AATAAATTTATT. It can be appreciated that the spots are localized in closely spaced different layer lines. From their position and also from the separation of doublets in the equator ([01 ] and [0
 1] reflections), the value of c can be estimated. Some of the indexes that result from such an estimation are indicated on the figure. At right is presented the equivalent simulated diffraction pattern from a pseudocell, which is only one dodecamer high (parameters given in Table 4). The intensity of the diffraction spots is quite similar in both cases. Note that layer line 17 in the experimental data (left) corresponds to layer line 1 in the pseudocell (right).
In the case of AATTAATTAATT, it could be possible that continuous helices might be present, since this sequence might pair in a staggered fashion. We have described such an organization for ATATATATATAT, which forms coiled-coils (12). The diffraction pattern is then significantly different. We conclude, therefore, that AATTAATTAATT crystallizes as a HASO structure in a standard way, as most of the duplexes described in this article.
Tetradecamers
We have studied two sequences. Both crystallize in a pseudohexagonal P1 space group. The fully alternating sequence ATATATATATATAT only gave well-oriented fiber patterns, with no spots on the layer lines. No trace of a coiled-coil structure could be detected, such as the one found in the shorter alternating dodecamer (12).
The second sequence studied, ATAAATATATTTAT, gave a rather simple HASO structure. An example of its diffraction pattern is given in Fig. 2 d. In this case, we should expect Ω = 13 × 36° − 22° = 446°. The actual value was 450° (Table 4), equivalent to a rotation of 90°, which generated a HASO structure with four stacked duplexes in the unit cell. The distance between neighbor columns in this packing arrangement is practically identical to that found in the shorter duplexes described in this article, although neighbor columns are now related by a translation, whereas in most other cases they are related by rotation (Fig. 8).
Hexamers
We present last our results on hexamers (Table 5). Since these duplexes are shorter, they have much greater freedom and show more variability. In this case, we should expect Ω = 36 × 5 − 22 = 158°. The two sequences AAATTT and AATATT behave as standard HASOs, as shown in Table 5. A diffraction pattern is presented in Fig. 1 a.
TABLE 5.
Structural parameters of all-AT hexamers
| Sequence | Base steps AA – AT – TA | Unit cell (Å) | Space group | Helix type | Ω(°) | 〈ω〉 (°) | Length (Å) | Rise (Å) | Comments |
|---|---|---|---|---|---|---|---|---|---|
| AAATTT | 4 – 1 – 0 | 43.1 × 43.1 × 176.5 | R32 | 9/4 | 160 | 36.4 | 19.61 | 3.27 | See footnote |
| AATATT | 2 – 2 – 1 | 44.3 × 44.3 × 137.8 | P321 | 7/3 | 154.3 | 35.3 | 19.69 | 3.28 | |
| ATTAAT | 2 – 2 – 1 | 24.7 × 24.7 × 99.1 90–90–120° | P1 | 5/3. | 216 | ? | 19.8 | 3.30 | Unrelated |
| ATATAT | 0 – 3 – 2 | 23.7 × 48.4 × 32.2 90–92.8–90° | P21 | Hoogsteen. | – | 36.0 | 19.3 | 3.22 | Reference 32 |
A low resolution structure of AAATTT has been deposited at the Nucleic Acid Database (37), reference code BD0093.
The ATATAT oligonucleotide was previously found to form a Hoogsteen duplex (11,32), under crystallization conditions quite similar to those reported here. In that case, the structure appears to be stabilized by some of the terminal bases that stick out and interact with the grooves of either the same or neighbor duplexes in the crystal, a situation that we have not found in any of the structures presented here. We cannot exclude that further work with different crystallization conditions could yield crystals of other duplexes in the Hoogsteen conformation.
The fourth hexamer sequence ATTAAT is also organized as a HASO structure, but its helical parameters are different. It has five duplexes in a cell, which is 30 basepairs high. The most likely interpretation is that a pseudocontinuous helix is formed, with 10 basepairs per turn. In that case, 〈ω〉 = ωT = 36°, in disagreement with the rest of oligonucleotide structures we have studied. The latter values of 〈ω〉 and ωT would be more consistent with a Hoogsteen structure, since in the crystals of Hoogsteen duplexes (11,32) pseudocontinuous helices are found. We are presently studying bromo-derivatives to determine the structure of this duplex.
Crystal polymorphism
In several cases, we detected additional crystal forms. The dodecamer AAAAAATTTTTT could be crystallized in several complex unit cells that we are studying. Zuo et al. (7) have already reported some unusual features of this dodecamer. Among the octamers, we found that ATTATAAT and AAATATTT could show two crystal forms (Table 2), as described in detail elsewhere (13). A more striking case is the decamer AATAATTATT, which has been found in four crystal forms. Two of them have practical identical unit cells (Table 3), in the related space groups R32 and P321. In the former, the asymmetric unit is a single duplex. In the P321 space group, the three duplexes in the asymmetric unit must be rather similar, given the simple diffraction patterns obtained, such as the one shown for another decamer in Fig. 1 d. Two additional crystal forms are found in this decamer, with similar unit cells (Table 3), but in two related space groups, with either six (P2) or three (C2) duplexes in the asymmetric unit. In the latter case, the duplexes were localized in the unit cell with the help of the AMoRe program (33). Unfortunately, the resolution of the diffraction pattern was not sufficient to proceed with refinement. The duplexes are also organized as HASO structures in a pseudohexagonal arrangement, as illustrated in Fig. 10. In all these cases, it is striking to note that polymorphism is found under very similar crystallization conditions.
FIGURE 10.

Structure of AATAATTATT in space group C2 (Form IV). In the upper frame, a layer through four unit cells is shown. The asymmetric unit has three duplexes, shown in different colors. Dyad axes are present between either two red or two green molecules. They relate the duplexes in each column. In the lower frame, a projection of the structure onto the bc plane is shown. Each duplex is related to its neighbors in the same way as those found in the P321 space group (Fig. 8), despite the different symmetry present in either case. Note the similar organization, when compared with octamers (Fig. 7).
DISCUSSION
The results we have presented are consistent with a very uniform structure for all-AT duplexes, as summarized in Table 6. Practically all of them are organized as a helical arrangement of stacked oligonucleotides (HASO structure), with a negative twist (ωT ∼−22°) in the virtual base step between neighbor stacked duplexes. The average twist is close to 36°, as found in poly(dA)·poly(dT) (34). In alternating sequences, the large twist of the TA step (23) is compensated by the lower twist of the AT step. In Tables 2−5, we have indicated the number of base steps of each type present in all the duplexes studied: sequence does not appear to have any significant effect either on the average twist 〈ω〉 or the organization of duplexes. It should be noted that small differences of ±3° in ωT (Table 1) will not change appreciably the average twist 〈ω〉 of the duplexes, as given in the Tables 2–5.
TABLE 6.
Average parameters of all-AT HASOs
| ΩE* | 〈ΩF〉† | N‡ | |
|---|---|---|---|
| Hexamers | 158° | 159° | 7,9 |
| Octamers | 230° | 231° | 11,14,17 |
| Decamers | 302° | 304° | 6,7,13 |
| Dodecamers | 374° | 376° (16°) | 17-34 |
| Tetradecamer | 446° | 450° (90°) | 4 |
ΩE is the expected value of Ω according to Eq. 1, with 〈ω〉 = 36° and ωT = −22°.
〈ΩF〉 is the average value calculated from the results reported in Tables 2–5.
N is the number of duplexes in a helical repeat of a HASO structure.
We have assumed that all duplexes have Watson-Crick basepairs. Indeed, in the structure that we have recently studied at the molecular level, a B-form has been found (13). The main exception of this uniform HASO structure is present in duplexes with an alternating sequence, which may show Hoogsteen basepairing (11) and a coiled-coil organization (12). One of the conclusions of our work is that all-AT oligonucleotides with a mixed sequence do not easily form Hoogsteen duplexes, since we have not detected any crystal structure of this type.
Packing: interhelical distances
Packing of DNA molecules has been studied in detail, as reviewed by Livolant and Leforestier (35). As the DNA concentration is increased, the isotropic solution progressively forms cholesteric, hexagonal, and orthorhombic phases. The hexagonal phase is found for intermolecular distances in the range 24–31 Å. A three-dimensional ordered hexagonal phase appears when the latter distance is ∼26 Å (36). No similar studies have been carried out with short oligonucleotide duplexes, since the aim of their study has usually been to obtain suitable crystals to determine the detailed molecular structure. In oligonucleotide crystals, the equivalent of the orthorhombic phase is found, although the organization of the oligonucleotides varies as a function of length, sequence, and crystallization conditions (37). In the experiments described in this article, we have trapped the equivalent of the hexagonal phase previously described as an intermediate state in long DNA molecules.
A striking feature of our results is the rather invariable distance of 26 Å between the axes of oligonucleotide duplexes. This is a characteristic distance that has been already found in either hexagonal DNA fibers at 92% relative humidity (38,39) or in ordered DNA fragments (36). When the DNA concentration is increased, there is an abrupt transition to an orthorhombic structure, with a higher degree of order (38,39). Under the conditions used by us, we have never detected a transition to such orthorhombic phase. It appears that there is a barrier to tighter packing. Available theoretical studies (14,15) do not provide any explanation for this behavior.
Under our experimental conditions, crystal formation is induced by lowering water activity through the presence of 2-methyl-2,4-pentanodiol. It appears that when this method is used, the DNA molecules reach a limiting distance of approach (26 Å), which cannot be overcome due to electrostatic repulsion of the phosphate charges and the absence of specific interactions between the oligonucleotides. In our hands, attempts to decrease further the water activity did not yield any suitable crystals.
In the cases we have mentioned (36,38,39), the DNA molecules are also organized in a pseudohexagonal unit cell with a = 45 Å as in our experiments, with three DNA molecules organized at different heights. The relative height of the molecules has been related to the interlocking of the phosphate helical ridges of DNA (40), but overall electrostatic interactions between the hydrated counterions and DNA may be more important. In fact, in our case, the intermolecular distances are rather large (Figs. 8 and 10), so that practically all phosphate-phosphate distances are >8 Å, and ridge interlocking does not appear to be required for packing. Neighbor duplexes are either rotated ±120°, as shown in Fig. 8, or related by translation in the P1 space group. A rotation of ±120° is equivalent to a vertical displacement of ⅓ of the pitch of the DNA molecules, at variance with the value of 1/6 previously suggested for whole DNA molecules (36,38). It should be noted that a displacement of ±1/6 in the vertical direction results in a different environment for each column of duplexes in the unit cell, whereas with a displacement of ±⅓, all columns have the same environment, as already noted by Marvin et al. (40). We conclude that in the oligonucleotide duplexes we have studied, the electrostatic interactions among DNA molecules and their ionic atmospheres may prevent the minor grooves from facing each other, a situation found with relative rotations of either ±120° in the P3 space group or 0° in the P1 case with a single molecule in the unit cell. Such interactions may stabilize the distance between parallel duplexes at the observed 26 Å distance. It appears that in all-AT duplex crystals, there are neither ion-mediated nor end-to-end close interactions, which are known to stabilize the crystal structure of mixed sequence oligonucleotides. The AT bases cannot easily form cross-bridges with other AT bases, either directly or mediated by ions. Such features can explain the low resolution of most of the crystal structures we have described. Attempts to increase the resolution by changing the crystallization conditions did not yield suitable crystals. It is possible that the amorphous/microcrystalline precipitates obtained by us by increasing the concentration of precipitants could adopt the orthorhombic structure, typical also for DNA fibers (38) and fragments (36) when the concentration is increased.
Another feature of interest of the 26 Å invariable intermolecular distance that we find among oligonucleotide columns is its coincidence with the arrangement of double-stranded DNA in viruses, which is also packed in a pseudohexagonal lattice with intermolecular distances close to 26 Å (41–43). Thus the optimization of DNA electrostatic interactions discussed in the previous paragraph appears to be also essential for DNA packing in viruses. In the case of liquid crystalline precipitates (17) and toroids (18), a slightly greater distance (28–29 Å) has been reported. The difference should be attributed to the greater degree of order in the crystals of short duplexes studied in this article.
Packing: symmetry considerations
All the oligonucleotides studied are packed in a pseudohexagonal unit cell, usually with a = b = 45 Å approximately, γ = 120°. In such a cell, three parallel HASO structures are present. If the three columns have different displacements in the vertical direction, they will diffract independently, in a P1 space group. We cannot exclude that in some cases this might be the situation present. However, in all cases in which a higher resolution has been observed, the three oligonucleotide columns in the unit cell are rotated 120°, as required in either a P3 or R3 space group (Fig.8). The simulations carried out with smaller pseudocells (Figs. 6 and 9) are also consistent with this organization. Since the DNA duplexes have an intrinsic dyad, we have further assumed that the space group is P321 as shown in the tables. The presence of this dyad has been confirmed in the case of AAATTT and AAATATTT (13).
In the case of the decamers with six duplexes in a helical turn of a HASO structure, additional related space groups with a higher symmetry, such as R32, P3221, P6522, etc. are possible. From the pattern of systematic extinctions, we have clearly detected some structures in an R32 space group (Tables 3 and 5), which also requires a relative rotation such as the one shown in Fig. 8. The case of the P3221 space deserves further comment, since in that space group the three columns of duplexes in a unit cell may be placed at different heights, so that variable vertical displacements may be present in the crystal, similar to those suggested for the long DNA structures discussed in the previous section (36,38). From the results currently available, we cannot determine if such a space group occurs in any of the 6/5 HASOs reported in Table 3.
Special cases are the duplex crystals that are found in the C2 space group. They are also organized as continuous HASO structures in a pseudohexagonal packing as shown in Fig. 10 and in the work of Valls et al. (13). It is not clear why this space group is chosen in such cases. A similar situation is found in a mixed sequence oligonucleotide (44), which is also packed as parallel HASO columns in a C2 space group. However, in most mixed sequence decamers in the C2 space group, the duplex columns are packed in different directions, so that there is an interlocking of the helical grooves (reviewed in Tereshko and Subirana (22)).
A final question to consider is how similar are the individual duplexes in a HASO column. The fact that in most cases we only find meridional reflections at the spacings that correspond to the length of a duplex (Fig. 2 a, for example) indicates that they are practically identical. However, in other cases (Fig. 2 b), additional spots appear that indicate small structural differences, as it has been found (13) in the octamer AAATATTT (Form I). Only in the case of decamers in the R32 space group, all duplexes must have an identical structure.
The geometry of the TA base step
In all the HASO columns we have described, the virtual TA base step between stacked neighbor duplexes is ∼−22° (Table 1). As shown in Fig. 4, this behavior may be attributed to an improvement of stacking in this base step. When the TA sequence is embedded in a continuous duplex, stacking is very poor, so that its contribution to the stability of DNA duplexes should be very low, as it has recently been demonstrated by Yakovchuk et al. (45). The variability of the TA twist (31) may also reflect the poor stability of this base step.
SUPPLEMENTARY MATERIAL
An online supplement to this article can be found by visiting BJ Online at http://www.biophysj.org.
Acknowledgments
We thank the staff of the BM16 Spanish beam line at the European Synchrotron Radiation Facility (Grenoble) for assistance in data collection. We also thank Drs. Valentina Tereshko, Isabel Usón, and Ignacio Fita for help and advice throughout this work.
This study has been supported by grants BIO2002-00317 from the Ministerio de Ciencia y Tecnología and 2001 SGR 00250 from the Generalitat de Catalunya.
References
- 1.Lander, E. S., L. M. Linton, B. Birren, C. Nusbaum, M. C. Zody, J. Baldwin, K. Devon, K. Dewar, M. Doyle, W. FitzHugh, R. Funke, D. Gage, et al. 2001. Initial sequencing and analysis of the human genome. Nature. 409:860–921. [DOI] [PubMed] [Google Scholar]
- 2.Liebich, I., J. Bode, I. Reuter, and E. Wingender. 2002. Evaluation of sequence motifs found in scaffold/matrix-attached regions (S/MARs). Nucleic Acids Res. 30:3433–3442. [DOI] [PMC free article] [PubMed] [Google Scholar]
- 3.Yuan, G.-C., Y.-J. Liu, M. F. Dion, M. D. Snack, L. F. Wu, S. J. Altschuler, and O. J. Rando. 2005. Genome-scale identification of nucleosome positions in S. cerevisiae. Science. 309:626–630. [DOI] [PubMed] [Google Scholar]
- 4.Glöckner, G. 2000. Large scale sequencing and analysis of AT rich eukaryote genomes. Current Genom. 1:289–299. [Google Scholar]
- 5.Eichinger, L., J. A. Pachebat, G. Glöckner, M. A. Rajandream, R. Sucgang, M. Berriman, J. Song, R. Olsen, K. Szafranski, Q. Xu, B. Tunggal, S. Kummerfeld, et al. 2005. The genome of the social amoeba Dictyostelium discoideum. Nature. 435:43–57. [DOI] [PMC free article] [PubMed] [Google Scholar]
- 6.Leslie, A. G. W., S. Arnott, R. Chandrasekaran, and R. L. Ratliff. 1980. Polymorphism of DNA Double Helices. J. Mol. Biol. 143:49–72. [DOI] [PubMed] [Google Scholar]
- 7.Zuo, E. T., F. A. Tanious, W. D. Wilson, G. Zon, G. Tan, and R. M. Wartell. 1990. Effect of base-pair sequence on the conformations and thermally induced transitions in oligodeoxyribonucleotides containing only AT base pairs. Biochemistry. 29:4446–4456. [DOI] [PubMed] [Google Scholar]
- 8.Movileanu, L., J. M. Benevides, and G. J. Thomas Jr. 2002. Temperature dependence of the Raman Spectrum of DNA. II. Raman Signatures of premelting and melting transitions of poly(dA)·Poly(dT) and comparison with poly(dA-dT)·Poly(dA-dT). Biopolymers. 63:181–194. [DOI] [PubMed] [Google Scholar]
- 9.Brahms, S., J. Brahms, and K. E. Van Holde. 1976. Nature of conformational changes in poly[d(A-T)·d(A-T)] in the premelting region. Proc. Natl. Acad. Sci. USA. 73:3453–3457. [DOI] [PMC free article] [PubMed] [Google Scholar]
- 10.Kypr, J., J. Chládková, L. Arnold, J. Sági, A. Szemzö, and M. Vorlíčkova. 1996. The unusual X-from DNA in oligodeoxynucleotides: dependence of stability on the base sequence and length. J. Biomol. Struct. Dyn. 13:999–1006. [DOI] [PubMed] [Google Scholar]
- 11.Abrescia, N. G. A., C. González, C. Gouyette, and J. A. Subirana. 2004. X-Ray and NMR studies of the DNA oligomer d(ATATAT): Hoogsteen base pairing in duplex DNA. Biochemistry. 43:4092–4100. [DOI] [PubMed] [Google Scholar]
- 12.Campos, J. L., L. Urpí, T. Sanmartín, C. Gouyette, and J. A. Subirana. 2005. DNA coiled coils. Proc. Natl. Acad. Sci. USA. 102:3663–3666. [DOI] [PMC free article] [PubMed] [Google Scholar]
- 13.Valls, N., M. Richter, and J. A. Subirana. 2005. Structure of a DNA duplex with all-AT base pairs. Acta Crystallogr. D61:1587–1593. [DOI] [PubMed] [Google Scholar]
- 14.Korolev, N., A. P. Lyubartsev, L. Nordenskiöld, and A. Laaksonen. 2001. Spermine: An “invisible” component in the crystals of B-DNA. A grand canonical Monte Carlo and molecular dynamics simulations study. J. Mol. Biol. 308:907–917. [DOI] [PubMed] [Google Scholar]
- 15.Korolev, N., A. P. Lyubartsev, A. Laaksonen, and L. Nordenskiöld. 2002. On the competition between water, sodium ions, and spermine in binding to DNA: A molecular dynamics computer simulation study. Biophys. J. 82:2860–2875. [DOI] [PMC free article] [PubMed] [Google Scholar]
- 16.Yang, J., and D. C. Rau. 2005. Incomplete ion dissociation underlies the weakened attraction between DNA helices at high spermidine concentrations. Biophys. J. 89:1932–1940. [DOI] [PMC free article] [PubMed] [Google Scholar]
- 17.Raspaud, E., D. Durand, and F. Livolant. 2005. Interhelical spacing in liquid crystalline spermine and spermidine-DNA precipitates. Biophys. J. 88:392–403. [DOI] [PMC free article] [PubMed] [Google Scholar]
- 18.Hud, N. V., and I. D. Vilfan. 2005. Toroidal DNA condensate: unraveling the fine structure and the role of nucleation in determining size. Annu. Rev. Biophys. Biomol. Struct. 34:295–318. [DOI] [PubMed] [Google Scholar]
- 19.Otwinowski, Z., and W. Minor. 1997. Processing of X-Ray diffraction data collected in oscillation mode. Methods Enzymol. 276:307–326. [DOI] [PubMed] [Google Scholar]
- 20.Leslie, A. G. W. 1992. Recent changes to the MOSFLM package for processing film and image plate data. Joint CCP4 and ESF-EAMCB Newsletter on Protein Crystallography. 26.
- 21.Dickerson, R. E., D. S. Goodsell, M. L. Kopka, and P. E. Pjura. 1987. The effect of crystal packing on oligonucleotide Double Helix Structure. J. Biomol. Struct. Dyn. 5:557–579. [DOI] [PubMed] [Google Scholar]
- 22.Tereshko, V., and J. A. Subirana. 1999. Influence of packing interactions on the average conformation of B-DNA in crystalline structures. Acta Crystallogr. D55:810–819. [DOI] [PubMed] [Google Scholar]
- 23.Gorin, A. A., V. B. Zhurkin, and W. K. Olson. 1995. B-DNA twisting correlated with base-pair morphology. J. Mol. Biol. 247:34–48. [DOI] [PubMed] [Google Scholar]
- 24.Timsit, Y., E. Westhof, R. P. P. Fuchs, and D. Moras. 1989. Unusual helical packing in crystals of DNA bearing a mutation hot spot. Nature. 341:459–462. [DOI] [PubMed] [Google Scholar]
- 25.Timsit, Y., E. Vilbois, and D. Moras. 1991. Base-pairing shift in the major groove of (CA)n tracts by B-DNA crystal structures. Nature. 354:167–170. [DOI] [PubMed] [Google Scholar]
- 26.Timsit, Y., and D. Moras. 1994. DNA self-fitting: the double helix directs the geometry of its supramolecular assembly. EMBO J. 13:2737–2746. [DOI] [PMC free article] [PubMed] [Google Scholar]
- 27.Rozenberg, H., D. Rabinovich, F. Frolow, R. S. Hegde, and Z. Shakked. 1998. Structural code for DNA recognition revealed in crystal structures of papillomavirus E2-DNA targets. Proc. Natl. Acad. Sci. USA. 95:15194–15199. [DOI] [PMC free article] [PubMed] [Google Scholar]
- 28.Hizver, J., H. Rozenberg, F. Frolow, D. Rabinovich, and Z. Shakked. 2001. DNA bending by an adenine-thymine tract and its role in gene regulation. Proc. Natl. Acad. Sci. USA. 98:8490–8495. [DOI] [PMC free article] [PubMed] [Google Scholar]
- 29.Yoon, C., G. G. Privé, D. S. Goodsell, and R. E. Dickerson. 1988. Structure of an alternating-B DNA helix and its relationship to A-tract DNA. Proc. Natl. Acad. Sci. USA. 85:6332–6336. [DOI] [PMC free article] [PubMed] [Google Scholar]
- 30.Lingbeck, J., M. G. Kubinec, J. Miller, B. R. Reid, G. P. Drobny, and M. A. Kennedy. 1996. Effect of adenine methylation on the structure and dynamics of TpA steps in DNA: NMR Structure determination of [d(CGAGGTTTAAACCTGC)]2 and its A9-methylated derivative at 750 MHz. Biochemistry. 35:719–734. [DOI] [PubMed] [Google Scholar]
- 31.Subirana, J. A., and T. Faria. 1997. Influence of Sequence on the conformation of the B-DNA Helix. Biophys. J. 73:333–338. [DOI] [PMC free article] [PubMed] [Google Scholar]
- 32.Abrescia, N. G. A., A. Thompson, T. Huynh-Dinh, and J. A. Subirana. 2002. Crystal structure of an antiparallel DNA fragment with Hoogsteen base pairing. Proc. Natl. Acad. Sci. USA. 99:2806–2811. [DOI] [PMC free article] [PubMed] [Google Scholar]
- 33.Navaza, J. 1994. AMoRe: an automated package for molecular replacement. Acta Crystallogr. A50:157–163. [Google Scholar]
- 34.Rhodes, D., and A. Klug. 1981. Sequence-dependent helical periodicity of DNA. Nature. 292:378–380. [DOI] [PubMed] [Google Scholar]
- 35.Livolant, F., and A. Leforestier. 1996. Condensed phases of DNA: structures and phase transitions. Prog. Polym. Sci. 21:1115–1164. [Google Scholar]
- 36.Durand, D., J. Doucet, and F. Livolant. 1992. A study of the structure of highly concentrated phases of DNA by X-ray diffraction. J. Phys. II. (France). 2:1769–1783. [Google Scholar]
- 37.Nucleic Acid Database. http://ndbserver.rutgers.edu
- 38.Langridge, R., H. R. Wilson, C. W. Hooper, M. H. F. Wilkins, and L. D. Hamilton. 1960. The molecular configuration of deoxyribonucleic acid. I. X-Ray diffraction study of a crystalline form of the lithium salt. J. Mol. Biol. 2:19–37. [Google Scholar]
- 39.Suwalsky, M., W. Traub, U. Shmueli, and J. A. Subirana. 1969. An X-ray study of the interaction of DNA with spermine. J. Mol. Biol. 42:363–373. [DOI] [PubMed] [Google Scholar]
- 40.Marvin, D. A., M. Spencer, M. H. F. Wilkins, and L. D. Hamilton. 1961. The molecular configuration of deoxyribonucleic acid. III. X-ray diffraction study of the C form of the lithium salt. J. Mol. Biol. 3:547–565. [DOI] [PubMed] [Google Scholar]
- 41.Subirana, J. A., J. Lloveras, M. Lombardero, and E. Viñuela. 1979. X-ray scattering of the non-isometric Bacillus subtilis phage φ29. J. Mol. Biol. 128:101–106. [DOI] [PubMed] [Google Scholar]
- 42.Cerritelli, M. E., N. Cheng, A. H. Rosenberg, C. E. McPherson, F. P. Booy, and A. C. Steven. 1997. Encapsidated conformation of bacteriophage T7 DNA. Cell. 91:271–280. [DOI] [PubMed] [Google Scholar]
- 43.Cockburn, J. J. B., N. G. A. Abrescia, J. M. Grimes, G. C. Sutton, J. M. Diprose, J. M. Benevides, G. J. Thomas Jr., J. K. H. Bamford, D. H. Bamford, and D. I. Stuart. 2004. Membrane structure and interactions with protein and DNA in bacteriophage PRD1. Nature. 432:122–125. [DOI] [PubMed] [Google Scholar]
- 44.Heinemann, U., and C. Alings. 1989. Crystallographic study of one turn of G/C-rich B-DNA. J. Mol. Biol. 210:369–381. [DOI] [PubMed] [Google Scholar]
- 45.Yakovchuk, P., E. Protozanova, and M. D. Frank-Kamenetskii. 2006. Base-stacking and base-pairing contributions into thermal stability of the DNA double helix. Nucleic Acids Res. 34:564–574. [DOI] [PMC free article] [PubMed] [Google Scholar]
- 46.Huang, D.-B., C. B. Phelps, A. J. Fusco, and G. Ghosh. 2005. Crystal structure of a free κB DNA: insights into DNA recognition by transcription factor NF-κB. J. Mol. Biol. 346:147–160. [DOI] [PubMed] [Google Scholar]