

Abstract
Infection of primary fibroblasts with human cytomegalovirus (HCMV) causes a rapid stabilization of the cellular protein p53. p53 is a major effector of the cellular damage response, and activation of this transcription factor can lead either to cell cycle arrest or to apoptosis. Viruses employ many tactics to avoid p53-mediated effects. One method HCMV uses to counteract p53 is sequestration into its viral replication centers. In order to determine whether or not HCMV benefits from this sequestration, we infected a p53−/− fibroblast line. We find that although these cells are permissive for viral infection, several parameters are substantially altered compared to wild-type (wt) fibroblasts. p53−/− cells show delayed and decreased accumulation of infectious viral particles compared to control fibroblasts, with the largest difference of 100-fold at 72 h post infection (p.i.) and peak titers decreased by approximately 10- to 20-fold at 144 h p.i. Viral DNA accumulation is also delayed and somewhat decreased in p53−/− cells; however, on average, levels of DNA are not more than fivefold lower than wt at any time p.i. and thus cannot account entirely for the observed differences in titers. In addition, there are delays in the expression of several key viral proteins, including the early replication protein UL44 and some of the late structural proteins, pp28 (UL99) and MCP (UL86). UL44 localization also indicates delayed formation and maturation of the replication centers throughout the course of infection. Localization of the major tegument protein pp65 (UL83) is also altered in these p53−/− cells. Partial reconstitution of the p53−/− cells with a wt copy of p53 returns all parameters toward wt, while reconstitution with mutant p53 does not. Taken together, our data suggest that wt p53 enhances the ability of HCMV to replicate and produce high concentrations of infectious virions in permissive cells.
Human cytomegalovirus (HCMV) is the major viral cause of birth defects. Primary infection during pregnancy poses a 30 to 40% risk of intrauterine transmission, with adverse outcomes more likely if the infection is within the first half of gestation (57). Each year approximately 1% of all newborns are congenitally infected, and of these infants, 5 to 10% manifest signs of serious neurological defects at birth which can include deafness, mental retardation, blindness, microencephaly, and cerebral calcification (6, 8, 13, 20). HCMV infection is also a major medical problem in immunocompromised individuals, particularly for transplant recipients and AIDS patients (8). Recent literature also points to HCMV as a potential causative agent for the development of certain types of cancers, including malignant gliomas, prostate carcinomas, and colorectal cancers (14, 21, 47). The clear health risks of exposure to HCMV make understanding the mechanism of pathogenesis for this virus imperative.
HCMV has a wide range of permissiveness in vivo. The major targets of infection are ubiquitously distributed cell types such as epithelial and endothelial cells and fibroblasts; however, peripheral blood leukocytes and specialized parenchymal cells such as neurons in the brain and retina, smooth muscle cells, and hepatocytes can also be infected with the virus (53). Like other herpesviruses, the genome of HCMV is temporally expressed in the permissively infected cell. The immediate-early (IE) genes are transcribed after virus entry and rely mainly on host factors for expression. Prior to viral DNA synthesis, the early genes are expressed with the aid of one or more IE gene products. Finally, late genes are transcribed after the initiation of viral DNA replication, with substantial release of virions beginning at approximately 72 h postinfection (p.i.) (55).
Binding and fusion of the virion with the host cell membrane triggers a cascade of physiological responses and virus/host cell protein interactions, which allow productive infection to proceed (2). The productive HCMV infection leads to a fully “activated” state by stimulating expression of several S-phase proteins (4, 16, 17, 22, 25, 61). Several hours after permissive infection, HCMV induces elevated levels of active cyclins E and B, p53, and hyperphosphorylated Rb but delays active cyclin A expression until late times in the infection (26). Our main focus among these early events has been to examine the interaction between p53 and HCMV in the infected cell.
As a key player in the cellular damage response, p53 is stabilized and activated in the uninfected cell after several potentially harmful events, including UV or gamma irradiation, exposure to extreme heat, hypoxia, or starvation and after viral infection (31). Activation of p53 can lead either to cell cycle arrest, presumably to allow repair of damaged DNA, or to apoptosis. p53 mediates control of these two outcomes primarily by sequence-specific DNA binding and transactivation of specific target genes (reviewed in reference 50). One target of p53 is HDM2, an E3 ubiquitin ligase that works in an autoregulatory feedback loop to tightly control levels of p53 within the cell (29). Recent literature has also revealed another inhibitor of p53 called ΔNp73, a variant of p73 and a p53 family member. Lacking a transactivation domain, ΔNp73 cannot itself directly regulate transcription, but by binding to p53 it can block this protein's ability to transactivate its downstream targets (30, 68). ΔNp73 therefore adds another level to the tight control of p53 expression and activity.
Although primarily regarded as an activator of transcription, p53 can also act as an inhibitor or repressor when bound to its target DNA, particularly when the pathway leads to apoptosis. Several studies point to the repressed expression of cellular proteins involved in antiapoptotic activity by p53, including bcl-2 (38), microtubule-associated protein 4 (42), and survivin (23), and several other sites of repression have been found within the genome as well (37).
The p53 protein is posttranslationally modified via phosphorylation and acetylation upon cellular stress. Phosphorylation can occur in both the N-terminal transactivation domain and the C-terminal domain involved in nonspecific binding to the DNA, whereas acetylation and sumoylation primarily occur in the C-terminal region (reviewed in reference 67). It is thought that these modifications aid in stabilizing the protein, protecting it from ubiquitination and degradation by HDM2 (reviewed in references 34 and 67). The core sequence-specific DNA binding domain contains several key residues that contact the DNA directly, and it is this region that is most heavily mutated in human cancers involving modifications to the p53 protein (31).
Elevated steady-state levels of p53 are observed in HCMV-infected fibroblasts (26, 40), vascular smooth muscle cells (56), human umbilical vein endothelial cells (32), and astrocytes (35) by 24 h p.i.; however, p53 cellular targets are not activated after infection (7, 26). Like several other viruses (12, 15, 27, 28, 36, 51, 63, 65, 69), HCMV encodes a protein, IE86, which can interact with p53 in vitro and in in vivo overexpression assays (5, 39, 40, 54, 56, 59, 62). There are several examples in the literature wherein transient expression of IE86 has disrupted the activation of p53 cellular targets (11, 24, 41, 56, 59, 70). Clearly, HCMV has the ability to alter cell fate and fully “activate” the infected cell without triggering its death. The literature suggests that this may at least in part be due to an alteration in p53's ability to activate transcription of its cellular targets. Although IE86 most probably plays a role in the downregulation of p53 activity, direct interaction between the two proteins has never been demonstrated during the course of an infection. We propose that sequestration of p53 into viral replication centers, which occurs relatively early after infection (19), provides a second, equally likely mechanism for silencing p53 activity.
The sequestration of p53 into the viral replication centers has led us to ask whether the virus sequesters p53 solely to impede its interaction with its cellular targets or, alternatively, if there may be some functionality to the relocalization of p53 in terms of productivity of the viral infection. In this study, we explore the roles for p53 in the HCMV viral life cycle in a p53−/− telomerase-immortalized cell line. We have compared the growth of the virus in these mutant cells to growth in their parental telomerase-immortalized fibroblasts (hereafter THF cells), in the primary foreskin fibroblasts routinely used in our laboratory (hereafter HFF cells), and in primary human embryonic lung fibroblasts (from which the THF cells were derived originally) (data not shown). We have obtained very similar results in all of these control cells, although we do see some minor variations in the parameters we have tested, which may be due to differences in lineage or to telomerase immortalization. For this reason, we have included the results of experiments comparing the p53−/− cells to both their parental THF cells and to our laboratory HFF (nonimmortalized) cells. We find several parameters that are altered in p53−/− cells, resulting in an endpoint of substantially decreased production of infectious virions at times when normal fibroblasts are producing maximal amounts of extracellular virus. Partial reconstitution of the p53−/− cells with a wild-type (wt) copy of the p53 construct abates the large majority of these effects, whereas reconstitution with mutant p53 does not. Taken together, our data suggest that the presence of wt p53 in a permissive cell enhances the ability of HCMV to replicate within it.
MATERIALS AND METHODS
Cells and virus growth.
HFF cells were isolated from tissue and propagated in Earle's minimal essential medium supplemented with 10% heat-inactivated fetal bovine serum (FBS), l-glutamine (2 mM), penicillin (200 U/ml), streptomycin (200 μg/ml), and amphotericin B (1.5 μg/ml). p53−/− telomerase-immortalized fibroblasts (10, 64) (a kind gift from J. Sedivy, Brown University) were used in these studies. In these cells, exons 2 to 5 of the endogenous p53 gene were deleted by homologous recombination into one chromosome. The second wt allele was deleted after several passages via loss of heterozygosity (10; J. Sedivy, personal communication). The deleted region corresponds to amino acids 1 to 186, and no functional protein is expressed in these cells. These p53−/− cells, their parental cell line, THF, and all clones derived from the reintroduction of p53 constructs were propagated in Dulbecco minimal essential medium/F-12 medium supplemented with 10% FBS, l-glutamine, penicillin, and streptomycin. Cells were grown in incubators maintained at 37°C and 5% CO2. The Towne strain of HCMV was obtained from ATCC (VR 977), propagated by standard procedures (58), and used at a multiplicity of infection (MOI) of 5 for all experiments.
Cell cycle synchronization and infection.
When cells were nearing confluence, their medium was exchanged for one without serum or supplements for approximately 60 h to synchronize the cells via serum starvation. The cells were then trypsinized and reseeded onto 10-cm plates at a density of 5 × 10⁵ cells/plate in the appropriate complete medium. After allowing 1 h for attachment, cells were infected, with viral supernatant remaining on the cells for 2 to 4 h. Serum starvation was carried out to ensure that the large majority of cells were in G0 at the start of infection and would therefore be synchronously infected by HCMV (18, 46). Synchronous infection of the cells was confirmed by harvesting coverslips at approximately 8 and 24 h p.i. Coverslips were stained for both pp65 (to determine percentage of cells infected) and IE72 (to determine synchrony of infection). All cell types were 100% pp65 positive by 8 h p.i. and showed >90% positive staining for IE72 at 24 h p.i. (18). It should be noted that very similar results were obtained when asynchronous cultures were infected (data not shown), indicating no activation of the cellular stress response by starvation of these cells.
Titering.
Cells were seeded and infected as described above. During each time course, duplicate infections were performed for each cell type being tested. Time courses were repeated at least two times for each cell type, unless otherwise noted. At the indicated times p.i., a small aliquot (150 μl) of supernatant was harvested from each dish and stored at −80°C with the addition of 1% dimethyl sulfoxide. Virus was then titered on HFF cells by standard techniques. Plaques were counted at days 7 and 9 postplating, with multiple wells seeded for each dilution in the series, so that an average could be obtained for that dilution. These numbers were then compared for the duplicate infections within the experiment, and an average titer was derived for that experiment. To obtain cell-associated virus, supernatant was removed from the culture and the monolayer was washed twice with phosphate-buffered saline (PBS) to remove any loosely attached virions. Cells were then scraped into 1.5 ml of PBS and placed in Eppendorf tubes, sonicated on ice for 2 min at a power setting of 30% (Fisher sonic dismembranator, model 500), and spun to clear debris. One percent dimethyl sulfoxide was then added, and the samples were stored at −80°C.
Slot blot analysis.
After extensive washing with PBS to remove any exogenous viral particles, infected cells were harvested by trypsinization at the times indicated. DNA was extracted with the QIAamp DNA blood kit (QIAGEN). Each time course was repeated at least twice. Quantification of whole-cell DNA was performed by electrophoresis through a 0.7% agarose gel in parallel with a High Mass ladder (Invitrogen). Equal concentrations of DNA between the different samples were determined with the Bio-Rad Geldoc system. DNA and nylon filter preparation was according to standard procedures with a Scie-plas hybridization manifold. The nylon filter was probed with a 32P-labeled 4.5-kb ApaLI-NcoI DNA fragment isolated from pHCMV EcoRI B (48). Prehybridization, hybridization, and posthybridization washes and autoradiography were performed according to standard techniques. Slot blot signals were quantitated densitometrically with Metavue software.
Western analysis.
Cells were seeded and infected as described above. Cells were trypsinized, washed, counted, and lysed in Laemmli reducing sample buffer (2% sodium dodecyl sulfate [SDS], 10% glycerol, 100 mM dithiothreitol, 60 mM Tris [pH 6.8], bromophenol blue dye, aprotinin and leupeptin [2 μg/ml each], 20 mM sodium fluoride, 80 mM betaglycerophosphate, and 1 mM sodium orthovanadate) at a concentration of 104 cells/μl of buffer at the time points indicated. Lysates were then sonicated, boiled for 5 min, and spun at 15,000 rpm for 10 min at 4°C to pellet debris. Equivalent amounts of cell lysates were then loaded onto SDS-polyacrylamide gels. Proteins were transferred to a Protran membrane (Schleicher and Schuell), and blots were probed with each of the following mouse primary antibodies (Abs): anti-p53 (DO-1; Neomarkers), anti-MCP and anti-pp28 (kind gifts of Bill Britt), anti-pp65 (1205S [immunoglobulin G1 {IgG1}]; Goodwin Institute, Plantation, Fla.), anti-IE72/IE86 (CH16.0; [IgG1] Goodwin Institute), and anti-UL44 (1202S [IgG1]; Goodwin Institute). After extensive washing, blots were probed with goat anti-mouse secondary Ab conjugated with horseradish peroxidase (Amersham) to detect bound primary Ab. Proteins were visualized with enhanced-chemiluminescence reagents (Pierce).
Immunofluorescence.
Harvested coverslips were washed in PBS prior to simultaneous fixation/permeabilization in ice-cold methanol for 10 min at −20°C. The cells were then washed several times with room temperature PBS. Coverslips were blocked with 30% FBS in a blocking solution (PBS with 1% bovine serum albumin and 0.01% Tween 20) for 15 min and then treated with primary mouse monoclonal Abs diluted in blocking solution for 10 min. After extensive washes in PBS, coverslips were incubated for 10 min with isotype-specific secondary Abs diluted in blocking solution, washed again in PBS, and mounted in glycerol containing paraphenylene diamine to inhibit photobleaching. Nuclei were counterstained with Hoechst dye. Cells were examined and photographed on a Nikon Eclipse E800 fluorescence microscope equipped with a Nikon DXM camera and Metavue software. Primary Abs used were anti-pp65 (as described above) anti-UL44 (as described above), and anti-IE1 (IgG2A; a kind gift from B. Britt, University of Alabama, Birmingham). Secondary Abs used were anti-mouse IgG1-specific tetramethyl rhodamine isothiocyanate-coupled Ab (Southern Biotech) and IgG2A-specific Alexa Fluor 488-coupled Ab (Molecular Probes).
Molecular cloning.
The parental pCDNA3 vector (Invitrogen) was first modified by insertion of a HindIII-BamHI fragment containing the puromycin resistance gene (from the pPur vector; Clontech) into its polylinker to obtain pPur-pCDNA3. Secondly, the wt promoter-p53-green fluorescent protein (GFP) cassette, or an equivalent cassette containing an R273H or H179Q mutation, was cleaved from pCLNCX-p53pro-p53GFP (44) with the EcoRV and BamHI sites and was inserted downstream of the puromycin gene in the pCDNA3 polylinker to obtain pPur-wtp53-pCDNA3, pPur-R273H-pCDNA3, or pPur-H179Q-pCDNA3, respectively. Either pPur-pCDNA3 (as a control) or its p53-containing derivative vectors were then electroporated into p53−/− cells, followed by selection in puromycin. Resistant cells were allowed to grow out, and single clones (for wt p53 and pPur-pCDNA3 alone) or pooled clones (for p53 mutants and pPUR-pCDNA3 alone) were isolated by standard techniques.
RESULTS
p53−/− cells show delayed and decreased accumulation of infectious virus particles compared to control fibroblasts.
The goal of these studies was to address whether p53, a major transactivating protein within the cell, might play a role in the permissive HCMV life cycle. As all of our experiments to date had utilized primary fibroblasts as permissive host cells, we turned to infection of a p53 −/− fibroblast line derived in the lab of John Sedivy (10). We include comparisons with both our primary HFF cells and the parental THF cells to account for possible cell lineage and immortalization differences in infection parameters. While HCMV infection of the p53−/− cells was permissive, the virus was seriously compromised in its ability to replicate in these cells, as is described below.
We began our studies with an assessment of the ability of the mutant cells to produce infectious virions. Cells synchronized in G0 by serum starvation were released and then infected at an MOI of 5, and aliquots of supernatant were collected and titered for infectious virus at time points between 48 and 144 h p.i. (as described in Materials and Methods). As the later time points (from 72 to 144 h p.i.) have been used previously to assess peak virus production in fibroblast cultures infected with HCMV Towne (49), we concentrated on these times p.i. However, as viral DNA begins to accumulate in earnest at 48 h p.i. (see below), we also included this time point in one set of experiments. Figure 1 displays the results of representative experiments versus HFF (A) and THF (B) cells, respectively. Experiments were performed at least twice at each time point (unless otherwise indicated), and all experimental results are shown in the figures. The bars represent the average titers obtained with data from the represented experiments. Above each control fibroblast bar is a number representing the difference between these calculated average titers (for instance, at 72 h p.i., the difference between the average titers of p53−/− and THF is 100-fold). All cells had low levels of virus release that were roughly equivalent (between 1 × 10³ and 4 × 10³ PFU/ml) at the earliest time point, 48 h p.i., which were reflective of the differences in viral DNA accumulation observed at this time (see below). As can be seen from the graphs, the p53−/− cells show a clear lag in the accumulation of infectious virus particles compared to either HFF or THF cells after this time point. These differences appear to diminish as the infection proceeds, although substantial differences still exist even at the very late time point of 144 h p.i. (13-fold and 24-fold, respectively). It should be noted that the infection proceeded more slowly in the p53−/− cells, so that the large majority of cells were still intact at 120 and 144 h p.i. in these cultures. This was in sharp contrast to the HFF and THF cultures, where there was substantial cell death by 120 h p.i., thus decreasing the number of cells producing virus at these late time points and potentially skewing the results.
FIG. 1.

p53−/− cells show delayed and decreased production of infectious virions. For each experiment performed, duplicate cultures of p53−/−, HFF, and THF cells were infected at an MOI of 5; at the times indicated, aliquots were removed from the supernatant and titered on fresh monolayers of HFF cells. Plaques were counted on days 7 and 9 p.i. (A) Experiments testing p53−/− versus HFF cells. (B) Experiments testing p53−/− versus THF cells. Each separate experiment is represented by a different symbol on the graphs. Bars represent the average titer as calculated from all experiments at that time point. Numbers above the control wt bars represent the differences (n = fold) between wt and p53−/− cell average titers for that time point. All time points were assessed in at least two experiments, except for the 48-h-p.i. time point in panels A and B and the 144-h-p.i. time point in panel B, which were performed only once.
Cell-associated virus was also harvested and titered along with the viral supernatant twice at 120 h p.i. (for p53−/− and HFF cells) and once at 96 h p.i. (for p53−/− only). When the total infectious virus output from these cultures was calculated, cell-associated virus accounted for 2 and 10% (at 120 h p.i.) and 25% (at 96 h p.i.) for p53−/− cultures, compared to 0.3 and 14% for HFF cultures (at 120 h p.i.). For example, in one experiment at 120 h p.i., we calculated the average total virus produced from the p53−/− cultures to be 6 × 10⁵ PFU, 2% of which was contributed by cell-associated virus. This was compared to an average total of 1.75 × 10⁷ PFU for the FS2 cultures, 0.3% of which was cell associated. Comparison of these numbers results in a 29-fold difference in viral output between these two cultures. If we apply the highest cell-associated percentage to this scenario, we would only increase the total virus production of the p53−/− cultures to 7.3 × 10⁵ PFU, hypothetically resulting in a still very substantial 24-fold difference in viral output. This indicates that cell-associated virions did not account for the differences observed in these titer assays. There was, therefore, a substantial defect in the ability of the p53−/− cells to accumulate infectious virions compared to either THF or HFF cells.
Viral DNA accumulation is delayed in p53−/− cells.
When we observed the kinetic delay and the decrease in late-stage virion production in the p53−/− cells, we immediately analyzed the viral DNA content of these cells compared to HFF and THF controls via slot blot analysis. Figure 2 shows representative blots from parallel experiments, with DNA extracted from infected cells at 48, 72, and 96 h p.i. None of the three cell types showed viral DNA accumulation above background hybridization levels at 24 h p.i. (data not shown). The p53−/− cells appeared to begin accumulation more slowly than either of the control cells, as was evidenced by lower levels of viral DNA at 48 h p.i. The widest range of values was observed at this time point, where densitometric analysis of six experiments (for HFF) and three experiments (for THF) showed average differences of 4.3-fold and 3.3-fold, respectively, which was reflected in the small differences in viral titers at this time described above. However, the differences between total viral DNA content at 72 and 96 h p.i. were not as substantial and mutant DNA approached the levels of wt controls (average differences of 2.9- and 2.7-fold for HFF and 2.1- and 1.5-fold for THF, respectively). Reduced DNA accumulation at later times (72 and 96 h p.i.) could therefore not entirely account for the dramatically lower production of functional virus observed in the mutant cells at these and later times.
FIG. 2.
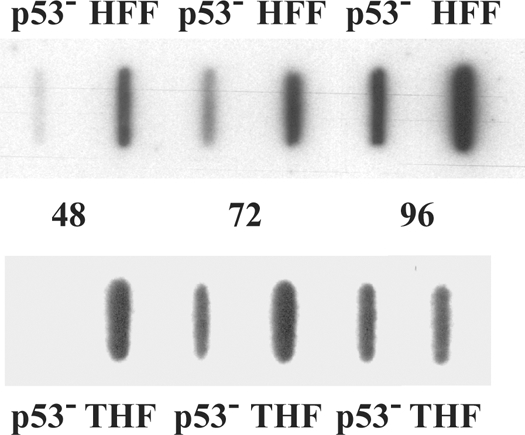
p53−/− cells accumulate DNA more slowly than do wt cells. p53−/−, HFF, and THF cells were infected, and cells were harvested for total cellular DNA at the times indicated. Equivalent concentrations of total DNA were slotted in each well. Experiments were performed six (HFF) or three (THF) times. Representative slot blots demonstrating the differences between HFF (top) or THF (bottom) and p53−/− cell types for viral DNA accumulation over the course of infection are shown.
Steady-state protein accumulation is delayed for several key viral proteins in p53−/− cells.
The p53−/− cells were obviously able to replicate the virus; however, the infection appeared, at least phenotypically, to progress more slowly than in either the HFF or THF cells. We therefore asked several questions with regard to the specifics of the progression of infection. We began by examining the steady-state protein accumulation of several different viral antigens representative of the different temporal classes, IE, early, and late. Figure 3 illustrates representative profiles obtained for each of the different subclasses of proteins compared to both HFF (A) and THF (B) cells. Western blots were analyzed for each protein class multiple times, with similar results obtained during each time course.
FIG. 3.

p53−/− cells exhibit substantial delays in the accumulation of several viral proteins. Cells were infected at an MOI of 5 and harvested at the indicated times p.i. Equivalent amounts of total cellular lysates were separated by SDS-polyacrylamide gel electrophoresis, transferred to a Protran membrane, and probed with the indicated Abs. Representative protein profiles are shown for IE, early, and late proteins. See Materials and Methods for Ab specifics. (A) Representative blots comparing p53−/− to HFF with 2 × 10⁵ cell equivalents. (B) Representative blots comparing p53−/− to THF with 1 × 10⁵ cell equivalents.
We examined the expression of the major IE proteins IE72 and IE86 to see whether the initiation of infection was dramatically delayed. Although there may be some minor differences, Fig. 3 shows that the timing and pattern of expression for these two key transactivating proteins were not significantly delayed or varied throughout the course of infection in the mutant cells compared to either HFF or THF cells. It should be noted that we and others (D. H. Spector, personal communication) have observed some variability in the affinity of the CH16.0 antibody for the IE72 protein, depending on how much protein is present on the blots (in Fig. 3A, 2 × 10⁵ cell equivalents were loaded; in Fig. 3B, the amount was 1 × 10⁵). What is important in our observations, however, is the consistency of the pattern of expression between the two cell types being compared in any given experiment. We also examined expression of these proteins at earlier times, both by Western blot and immunofluorescence (IF) (as early as 8 h p.i.), with similar results observed for all three cell types (data not shown).
We next examined a protein that displays an early pattern of expression, the processivity factor for the viral polymerase, UL44. Compared to either type of control cell, this protein was both delayed in expression by 24 h and showed dramatically lower steady-state levels at 48 h p.i.; however, levels approached that of the wt cells by 72 h p.i. It should be noted that levels of UL44 in the THF cells were somewhat lower than in HFF cells at 24 h p.i. (see below). The major tegument protein, pp65 (UL83), which shows delayed early patterns of accumulation, did not lag significantly in timing of appearance in the p53−/− cells; however, appearance of the smaller forms of the pp65 protein was delayed until approximately 96 h p.i. (significantly behind either the HFF or THF cells). It should be noted here that accumulation of these lower forms of pp65 in the p53−/− cells was variable in different experiments and sometimes was not observed at all over the course of infection (data not shown). Although it is unclear what the function of these lower forms is during infection, their slower appearance seems to be correlated with delays in transition to the late stage of infection (9, 48) (see below).
Two important structural proteins that display late patterns of accumulation, the major capsid protein (MCP; UL86) and the tegument protein pp28 (UL99), were also examined. We found delays of at least 24 h for both of these major structural components of the virus in the p53−/− cells, with levels never accumulating to the same degree as in either HFF or THF control cells for either protein out to 96 h p.i. Thus, although the initial infection appears to proceed normally with respect to IE protein expression, the data in Fig. 3 indicate major delays in accumulation of key early and late viral proteins compared to either type of control cells. Delays in the former could help explain the lower levels of viral DNA accumulation (especially at 48 h p.i.), as early proteins are primarily involved in the process of viral DNA replication. Additionally, lower levels of structural proteins may help to explain the lower overall infectious virion output at later times p.i.
Delay in UL44 accumulation is coupled with substantial effects on replication center formation and development.
In an HCMV infection in wt fibroblasts, replication center formation begins relatively early, with small foci becoming clearly visible between 12 and 24 h p.i. (43). Although not the first protein to localize to the sites of viral replication (43), UL44, the processivity factor for the viral polymerase, does localize to these small foci by 24 h p.i. and is a good marker that is easily visualized by IF techniques. As the infection progresses in wt fibroblasts, the small foci are replaced by two larger foci located at the poles of the nucleus by 48 h p.i. (43). Late stages of infection (after 72 h p.i.) are characterized further by fusion of these domains to form one very large focus, which covers the vast majority of the infected cell nucleus. Figure 4A shows this progression from multiple small foci to a single large focus for an HFF infection, with the appropriate times p.i. indicated at the right. The same pattern of progression can be observed in THF cells (data not shown). This figure also shows the delayed kinetics of focus formation in the p53−/− cells, which is discussed in more detail below.
FIG. 4.

Replication center formation and development are delayed in p53−/− cells. Cells were seeded onto glass coverslips and infected, and coverslips were harvested at the indicated times p.i. Cells were stained for the presence of UL44 as described in Materials and Methods. Cells were scored for the presence of UL44 foci, and then focus-positive cells were scored for the size/stage of development of these foci as indicated in the text. (A) Representative staining for UL44 foci in HFF and p53−/− cells at the indicated times p.i. Images on the left of each grouping depict UL44 foci as small multiple foci, two large foci, or one single focus. Images on the right are Hoechst staining of the same nuclei. Scale bar, 5 μm. (B) Graphic representation of the results of scoring at least three experiments for each cell type for the presence and size of UL44 foci. At least 100 cells were scored for each cell type at each time point. Gray bars represent the percentages of cells with multiple small UL44 foci (see panel A, HFF, 24 h p.i.). Black bars represent the percentages of cells that have advanced-stage foci at that time point (see panel A, HFF, 48 or 72 h p.i.).
We monitored the course of infection for p53−/−, HFF, and THF cells, scoring the percentages of cells that displayed UL44 foci at the time points indicated (Fig. 4B). For each cell that scored positive for the presence of foci, we also assessed the size of these replication centers, scoring cells either as having small, multiple foci, as is seen at 24 h p.i. in wt fibroblasts, or as having advanced-stage foci (i.e., at least at the two-large-focus stage). Figure 4B shows the averaged results of a minimum of three time course experiments for each cell type. There was a distinct correlation between the IF and Western analysis data for the 24-h-p.i. time point; that is, the p53−/− cells showed essentially no staining for UL44 foci at this time point by IF (see Fig. 4A for an example), just as they showed no substantial steady-state accumulation in Fig. 3. In contrast, many HFF and THF cells displayed small UL44 foci (gray bars), although the percentage was approximately twofold higher in the former, also consistent with the data presented in Fig. 3. Although we began to observe cells with UL44 foci in the p53−/− cells at the 48-h time point (35% with foci), the large majority of these cells displayed only small foci (see Fig. 4A for an example). In fact, only 33% of the cells that stained positive for UL44 foci displayed advance foci in the p53−/− cells. This was quite different from the HFF cells, where 98% of cells had UL44 foci, 89% of which showed advanced focus formation (mostly at the two-large-focus stage). Although the total percentage of THF cells with UL44 foci was again lower than in HFF (68%), 92% of these cells contained advanced-stage foci at this time point.
As was observed in the Western analysis, the p53−/− cells began to approach their wt counterparts by the 72-h time point but still did not exhibit equivalent focus formation or development. At this time point, 67% of the p53−/− cells had UL44 foci, 70% of which were advanced stage. The large majority of these cells with advanced-stage foci had two large foci, similar to what was observed at the earlier time point, 48 h p.i., in the HFF and THF cells (see Fig. 4A for an example). Almost all of the HFF and THF cells were positive for UL44 foci by 72 h p.i., and by this time point, virtually all focus-containing cells exhibited advanced focus formation. At 96 h p.i., the p53−/− cells approached wt levels, with 89% of the p53−/− cells positive for UL44 foci, 84% of which displayed advanced-stage foci, although many of these had still only progressed to the two-focus stage. While HFF levels remained the same from 72 to 96 h p.i. with respect to UL44 focus-positive cells, THF levels increased slightly.
It is clear that some differences in the rates of focus formation were observed between our two control cell types, particularly at early time points. This may be due to cell type variations or telomerase immortalization. However, by late times p.i., these cells behaved virtually identically in this assay. In sharp contrast, it appeared that not only was UL44 accumulation delayed in the p53−/− cells but the formation and development of the replication centers was also substantially delayed. These observations could help to explain the somewhat lower levels of viral DNA in the p53−/− cells observed in our slot blot analysis at the earlier times p.i., as a lack of well-developed viral replication centers generally equates to less viral DNA synthesis. This is evidenced by progression only to the level of multiple small foci in the presence of the DNA synthesis inhibitors ganciclovir and phosphonoacetic acid (43). This could also help explain the slower accumulation of infectious virus particles in the mutant cells.
Relocalization of the pp65 tegument protein to the cytoplasm is impaired in p53−/− cells.
The major tegument protein, pp65, is localized in the nucleus at early times p.i. (24 h p.i.). As the permissive infection progresses, the pp65 protein begins movement out of the nucleus in a progressive manner. At 48 h p.i., pp65 begins to be localized to the cytoplasm of the infected cell, with a noticeable bolus of pp65 adjacent to the nucleus and diffuse staining throughout the cytoplasm. By 72 h p.i., the large majority of pp65 has exited the nucleus and is located throughout the cytoplasm (9, 48). Figure 5A displays these three distinct stages of pp65 staining during the course of a normal infection in HFF cells (parallel results were obtained for THF cells [not shown]). As there were some delays in the appearance of smaller forms of pp65 in the p53−/− cells, we investigated whether there were delays in the relocalization of this protein to the cytoplasm by using IF detection as our assay. As can be observed in the representative images in Fig. 5A, a clear lack of movement of pp65 was apparent in the p53−/− cells. Figure 5B quantitates this lack of relocalization of the pp65 protein out of the nucleus and into the cytoplasm in infected p53−/− cells in comparison to both HFF and THF control cells. Although there were some differences between the control cells, particularly at 48 h p.i., even after 96 h p.i. the very large majority of p53−/− cells still had pp65 localized predominantly in the nucleus, with only 20% showing any staining in the cytoplasm at all. It should be noted that the large majority of the cells displaying cytoplasmic staining in the p53−/− cells were at the transition stage shown for HFF cells at 48 h p.i. in Fig. 5A. This indicates major obstacles to the normal relocalization of the tegument protein pp65 in the p53−/− cells. This may also help to explain the lower levels of virus particle accumulation at late times p.i. in these cells.
FIG. 5.
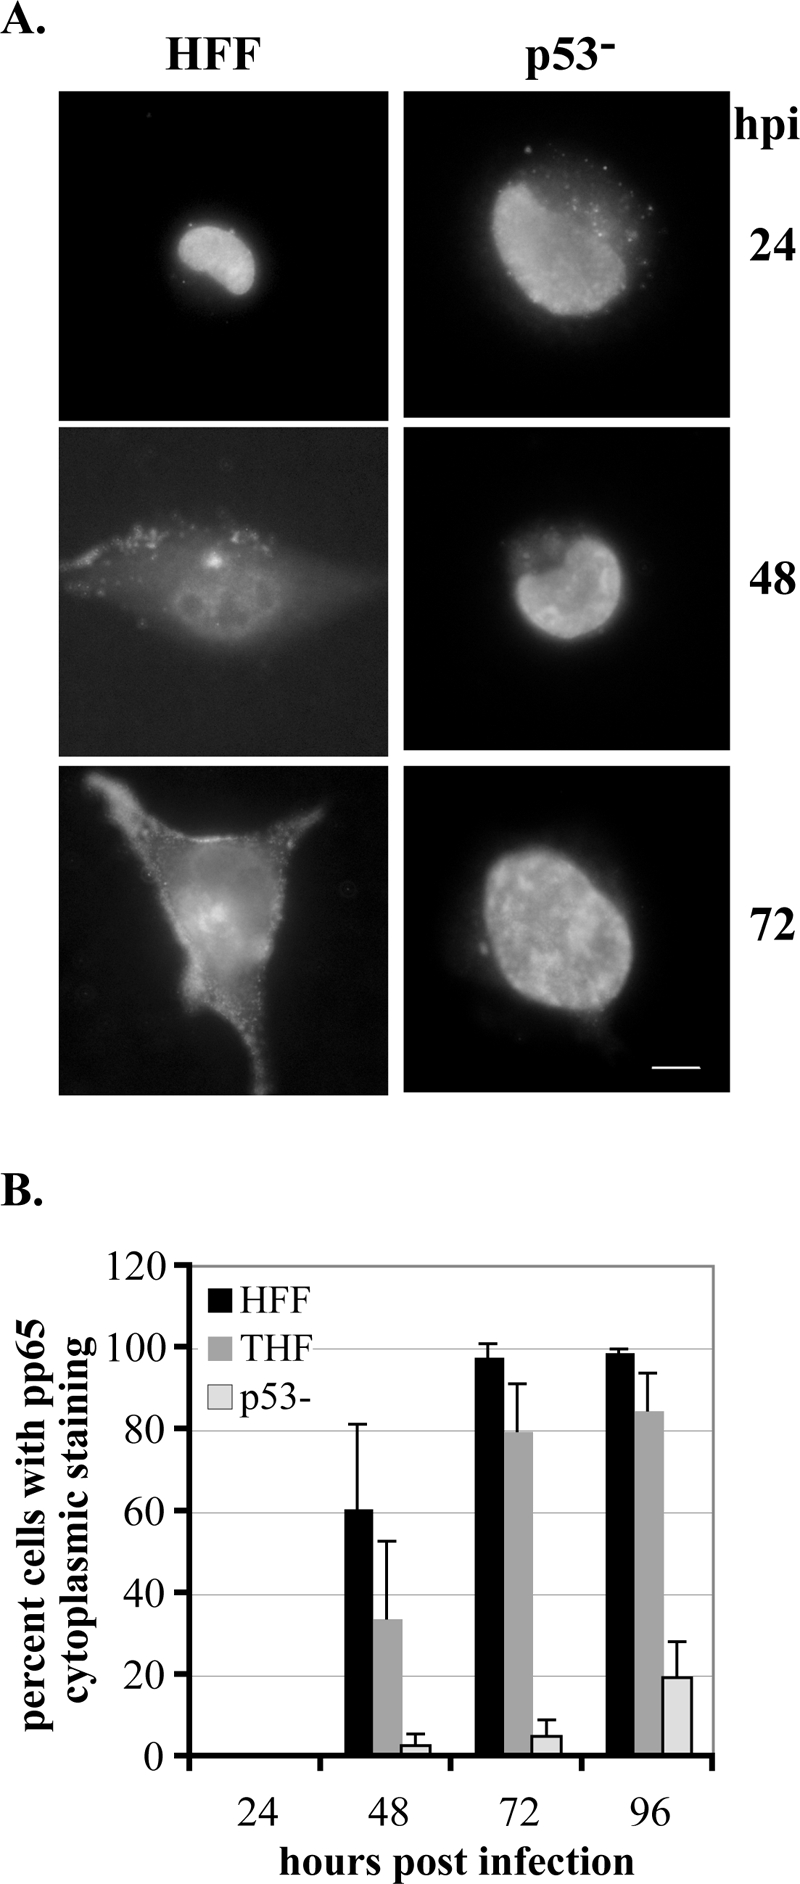
pp65 relocalization is impaired in p53−/− cells. Cells were seeded onto glass coverslips and infected, and coverslips were harvested at the indicated times p.i. Cells were stained for the presence of pp65 as described in Materials and Methods. Cells were scored for localization of pp65 within the cell as delineated in the text. (A) Representative staining for pp65 in HFF and p53−/− cells at the indicated times p.i. Images depict pp65 localization, with HFF images showing the three phases described in the text. Localization begins solely in the nucleus, gradually moves into the cytoplasm at 48 h p.i., and is almost completely in the cytoplasm by 72 h p.i. in these wt cells. For the purposes of our experiments, cells were scored as positive for pp65 in the cytoplasm if they progressed to the stage portrayed at 48 h p.i. in HFF cells. (B) Graphic representation of the results of scoring at least three experiments for each cell type for movement of pp65 into the cytoplasm. At least 100 cells were scored for each cell type at each time point in each experiment. Error bars represent 1 standard deviation.
Reintroduction of p53 restores all parameters toward wt fibroblast levels.
Working with a fibroblast that is derived from cells that do not have p53, the major “guardian of the genome,” presented some questions as to whether or not the phenotypes that we observed with respect to the growth of HCMV were due to the absence of p53 or to some other protein product that might be missing or aberrant in these fibroblasts. We set out to address this question by reintroducing a wt copy of p53 into these cells. To do this, we electroporated a wt p53-GFP construct (see Materials and Methods) into the p53−/− cells. Reintroduction of p53 into these cells was a difficult task. Since these cells have the possibility of multiple mutations due to the lack of p53 surveillance of the genome, we needed to avoid overexpression of the p53 protein, as this could rapidly lead to cell death through activation of the wt p53 apoptotic pathway. To achieve a somewhat lower level of gene expression, we used a plasmid that expressed p53 from its own endogenous promoter (44). The construct also contained a puromycin resistance cassette so that clones could be selected for the presence of either the wt p53-GFP construct or a backbone construct that did not contain the p53 coding sequence. Several positive single clones for both the wt p53 construct and the backbone construct alone were successfully selected and grown out. We have tested these clones by reverse transcription-PCR for the production of a p53 transcript and have been successful in detecting this (data not shown). We have several different independent clones that all behave very similarly to the clone, named WTD, that is presented in the data described below. We have compared these to HFF, THF, and p53−/− cells and single clones that have only the backbone construct. Cells with the backbone plasmid alone behave very similarly to the p53−/− cells in all tests (pCDNA4 and pCDNApool are included as examples of these control cells in the experiments described below).
Since the differences in titers were most dramatic at the 72- and 96-h-p.i. time points, we tested the production of virus from WTD cells versus that from p53−/− cells as well as from either HFF (Fig. 6A) or THF (Fig. 6B) cells in multiple experiments. As can be observed in Fig. 6, although titer levels are not fully restored to wt levels in the WTD cells, they are substantially increased from the p53−/− fibroblasts displaying intermediate levels of virus at both of these key time points. The differences between the average titers of WTD compared to p53−/− are shown above the bars in the figure.
FIG. 6.

Reintroduction of wt p53 into p53−/− cells restores production of infectious virions and accumulation of viral DNA toward wt levels. (A) The results of three separate titering experiments are shown for comparison of p53−/−, WTD, and HFF cells. Each experiment is represented by a different symbol, and bars represent the average titers for that time point. Differences (n = fold) of average titers compared to p53−/− titers are shown above these bars. (B) The results of two separate titer experiments between p53−/−, WTD, and THF cells are displayed. (C and D) All cells were infected and harvested for slot blot analysis as described in Materials and Methods. pCDNA4 is a representative clone that contains only the pPUR-pCDNA3 backbone construct.
Next, we looked at viral DNA accumulation in the WTD cells by slot blot analysis. As can be seen in the representative blots in Fig. 6C and D, although not completely restored to wt levels, the WTD cells showed increased levels of viral DNA at both 72 and 96 h p.i. over that of both the p53−/− and control pCDNA4 cells. We saw this trend consistently each time we performed this analysis with the WTD cells.
In an analysis of UL44 focus staining, we again saw trends tending toward wt fibroblast expression. As we found the most dramatic differences between the p53−/− and wt cells between 24 and 72 h p.i., we concentrated on this time frame for further analyses. Figure 7A shows that although UL44 expression was delayed in the WTD cells (as evidenced by only very low levels of staining at 24 h p.i.), once 48 h p.i. was reached, the total percentage of cells displaying UL44 foci in these reconstituted cells (71%) was equivalent to that of the parental THF cells (68%) and approached that of the HFF fibroblasts (98%). The percentage of WTD cells containing UL44 foci at this time point was dramatically increased above the level of p53−/− cells (35%). Of the UL44 focus-containing WTD cells, 61% possessed advanced-stage foci at 48 h p.i., compared to only 33% in the p53−/− cells. This trend continued at the later time point of 72 h p.i. in the WTD cells, where levels of UL44 (both total foci and advanced-stage foci) were essentially identical to those of the parental THF cells and very close to those of HFF fibroblasts (89% were UL44 focus positive, and of those, 92% had advanced foci).
FIG. 7.

Reintroduction of wt p53 but not mutant p53 into p53−/− cells restores UL44 focus formation and pp65 relocalization toward wt. (A) UL44 focus appearance and development were assayed via IF as described in the text and in the legend to Fig. 4. Percentages for HFF, THF, and p53−/− cells are the same as presented in Fig. 4. (B) pp65 movement into the cytoplasm was assessed via IF as described in the text and in the legend to Fig. 5. Percentages for HFF, THF, and p53−/− cells are the same as presented in Fig. 5. Assays were performed at least twice for each cell type. Error bars represent 1 standard deviation. pCDNA4 is a representative clone that contains only the pPUR-pCDNA3 backbone construct. R273Hpool and H179Qpool are pools of cells with mutant constructs reintroduced into the p53−/− background. pCDNApool is a pool of cells with the backbone construct reintroduced into the p53−/− cells.
pp65 relocalization in the WTD cells was the least affected of the parameters that we assessed (Fig. 7B). Although movement of pp65 out of the nucleus was still delayed in the WTD cells compared to either type of wt fibroblast, there appeared to be a recovery at 72 h p.i. toward wt levels (with an average of 40% of cells showing some amount of pp65 in the cytoplasm, as opposed to only 5% and 9.5% for p53−/− and pCDNA4, respectively).
If our premise that p53 is utilized as a transactivator for viral protein expression by the virus is correct, then reconstitution of the p53−/− cells with a mutant p53 unable to bind DNA should not change the phenotype of these cells with respect to HCMV replication. We therefore repeated our electroporation experiments, this time introducing two different DNA binding domain mutant plasmids (pPur-R273H-pCDNA3 and pPur-H179Q-pCDNA3) (44), along with the pPur-pCDNA3 backbone plasmid as a control, and selected pools of mutants to test in our assays. As can be seen in Fig. 7A and B, these three pools behaved essentially identically to their parental p53−/− cells with respect to UL44 focus formation and pp65 relocalization. In addition, they exhibited no increase in infectious virion production compared to p53−/− and THF cells. In two experiments, the average differences at 72 and 96 h p.i. between the R273Hpool and THF cells were 51- and 76-fold and between the H179Qpool and THF cells were 84.5- and 82-fold, respectively. DNA slot blot analysis showed virtually identical viral DNA levels compared to p53−/− cells (data not shown). When the results from the two mutant p53 pools are compared to the strong progress back toward wt phenotypes exhibited by WTD and similar clones, we must conclude from our reconstitution experiments that the absence of p53 is to a large extent responsible for the defects we have observed in the life cycle of HCMV in the p53−/− cells.
DISCUSSION
It is apparent from our data that although it is not absolutely essential, a functional p53 protein contributes significantly to the timely progression of a fully permissive infection in wt fibroblasts. First and foremost in this assertion is that in p53−/− cells, the accumulation and release of infectious virus particles are both substantially delayed and decreased compared to two different wt cells, even when measured at the very late time point of 144 h p.i. (Fig. 1). Several factors contribute to the substantial difference in infectious virion output in the p53−/− cells. (i) There are lower levels of accumulated viral DNA within the p53−/− cells (Fig. 2) than in wt cells. Although these differences vary greatly at the early time point of 48 h p.i., the average differences observed between the p53−/− and the two wt cell types at all time points tested are only 1.5- to 5-fold, with the levels of DNA in p53−/− cells approaching those of both wt cell types at 96 h p.i. It is not likely, therefore, that these relatively small differences in accumulated viral DNA could entirely account for the larger differences in titers observed at all later time points. (ii) Analysis of protein levels (Fig. 3) reveals no delay in the accumulation of IE gene products, but a delay in UL44, a key early viral protein involved in replication, is observed. Analysis of replication center formation by UL44 localization indicates distinct delays in both formation and progression of viral replication centers. Low levels of DNA accumulation and delayed appearance and development of replication foci at early times point to a role for p53 as a “catalyst” for replication center formation. Perhaps the transactivation function of p53 is utilized to activate transcription of viral proteins needed for replication. An analysis of p53 binding sites on the viral genome reveals that UL44 does have a site directly upstream (44) which is bound by p53 during infection. (iii) Due to low levels of viral DNA replication, late protein accumulation is also delayed, as evidenced by pp28 and MCP steady-state protein levels. Delays in the expression and quantity of these proteins may also contribute to lower infectious virion production. (iv) Lastly, although there is not a delay in pp65 protein expression, there appears to be a delay in the appearance of lower-molecular-weight forms, and relocalization of the protein into the cytoplasm is greatly curtailed. Several investigators working with different viral mutants have observed this delay in pp65 relocalization with various other characteristics (1, 3, 48, 52). What is interesting is that all of these viruses contain mutations in proteins that show some viral transactivating activities (TRS1, UL35, and IE86), pointing again to the possible importance of p53 as a transactivator of viral gene expression.
What is interesting to us is that U373 astrocytoma cells, which are of a very different lineage and exhibit much more rapid growth characteristics than either p53−/− or wt fibroblasts, display a phenotype that is very similar to (and sometimes more pronounced than) the p53−/− cells with respect to viral replication (data not shown). The U373 cells have a well-documented mutation in their cellular p53 (R273H), which renders the protein incapable of transactivating in a sequence-specific manner (60) and is one of the DNA binding domain mutations used in our studies. We find that the U373 cells, like the p53−/− cells, have both delayed and decreased infectious virion production, show slow accumulation of viral DNA, and have very similar profiles for both UL44 and pp65 in terms of localization. Steady-state viral protein profiles that we have tested are also very similar (data not shown). It is tempting to speculate that these similarities in phenotype with respect to HCMV replication, despite the great disparity in cellular backgrounds, may at least in part be due to the absence of a functional p53 protein within these cells.
In cells where wt p53 is partially reconstituted (WTD is used here), we see consistent movement back toward wt phenotypes for all parameters tested, even though these clones express very low levels of the p53 transcript (Fig. 6 and 7). It should be noted that the five individual clones that we isolated behaved similarly, and multiple clones containing only the pCDNA3 backbone behaved essentially as their p53−/− parental cells. It is not surprising that the p53−/− cells would not tolerate large amounts of p53, as it is well documented that reintroduction of p53 into tumor cells leads them to quickly arrest (reviewed in reference 33). These studies are generally done with a strong promoter to drive the expression of p53, which is why we chose to try to get low-level expression through the use of the endogenous p53 promoter in our constructs. Despite the low level of p53 expression, DNA accumulation is increased consistently over p53−/− cells (Fig. 6C), and although they are slow to appear, UL44 localization and replication center development progress faster than in the p53−/− cells and by 48 h p.i. come very close to the levels observed in their telomerase-immortalized parental THF cells (Fig. 7A). In light of these results, we must consider that for UL44 expression, one may need high expression of p53 at early times p.i., but lower levels of the protein suffice later. Although not as markedly changed, the pp65 relocalization to the cytoplasm does increase somewhat in WTD cells (Fig. 7B). Perhaps expression of the lower forms of pp65 and relocalization of the protein to the cytoplasm need relatively high levels of p53 throughout infection. Alternatively, the level of p53 within the cells may only indirectly control pp65 expression. Despite the low level of p53 expression, the endpoint parameter, infectious virion production, was greatly increased in the clones reconstituted with wt p53 (Fig. 6A and B) and came close to wt fibroblast levels.
Since our results showed that the reconstitution of wt p53 did not bring all parameters back to wt levels, we introduced two other DNA binding domain mutant p53 constructs into the p53−/− background (R273H and H179Q). It was quite clear from our results that a functional protein, capable of binding DNA, was important for HCMV replication, as neither of these mutants was capable of increasing any of the parameters tested back to wt levels (Fig. 7; also see above). Taken together, the reconstituted clone data indicate that loss of a functional p53 is at least partially responsible for the development of all of the phenotypes observed in the p53−/− cells.
It has been well documented that one of the major roles for p53 is as a sequence-specific transcription factor. In fact, an earlier study (66) pointed to the presence of a p53 binding site in the UL94 promoter that was a “negative regulator” of transcription. We did not observe changes in UL94 protein levels between the p53−/− cells and wt fibroblasts (data not shown). This emphasizes the importance of context, as those authors saw negative regulation only during overexpression studies with p53, IE86, and a UL94 promoter expression construct transfected into nonpermissive Saos2 cells. A scan of the HCMV genome has indicated that there are 21 exact matches for the p53 DNA binding site within the virus, which includes sites that could influence the expression of both replication and structural proteins (44). It is particularly noteworthy that sites exist within or near UL44 (the processivity factor), UL54 (the viral polymerase), UL57 (the single-stranded DNA binding protein), and UL70 and UL105 (components of the helicase-primase complex), all proteins that are essential for ori-lyt-dependent replication of the virus. It is tempting to speculate that at least part of the delay in replication center formation and development observed in the p53−/− cells stems from a delay in expression of these proteins due to the absence of this cellular transactivator. This is especially important in light of the fact that we have shown that all of these sites show differential binding of p53 during infection, as measured by a chromatin immunoprecipitation assay (44). Delays in relocalization of pp65 to the cytoplasm may also be due to low-level expression of tegument and glycoproteins that possess p53 binding sites. We have identified putative binding sites in several key structural proteins as well, including both UL55 (gB) and UL56 (MCP), which are also bound during infection (44). This would not be the first report of p53 aiding in the expression of viral late proteins (e.g., adenovirus expression [45]).
The p53−/− cells show several defects that all work together to create both delayed and decreased infectious virion production at late times p.i. We propose two scenarios to explain this phenomenon. In the first, replication centers, although present, are smaller and less developed than in a wt fibroblast, which leads to less replicated viral DNA. Under this scenario, higher levels of accumulation of viral DNA within the cells at late times may be due to blocks in both packaging and trafficking of the intact virions within the cells and/or during release into the extracellular space. Taken together, these defects could lead to the observed delays and decreases in titers. Under a second scenario, at late times p.i., replication center development is close to wt levels, but trafficking and processing of intact virions is compromised in the cells. In this scenario, decreased output primarily arises from the low infectivity of released virions, as evidenced by the decrease in the ability to create plaques on new monolayers of permissive cells. The question here lies in the percentage of infectious virions released as opposed to wt fibroblasts. Both models have merit, and we have begun an analysis of infected p53−/− and wt fibroblast cells via electron microscopy and gradient purification of particles to further explore the blocks to virion production in the p53−/− cells. From our further studies, we hope to ascertain the full extent and scope of the role of p53 in permissive HCMV infection and to gain an understanding of the parameters that govern the virus' use of this protein in different cell types.
Acknowledgments
This work was supported by NIH grants RO1 AIO51463, P20 RRO16454 (Idaho INBRE), and P20 RR015587 (COBRE program) to E.A.F.
We thank John Sedivy for providing the p53−/− cells and for helpful discussions, Gary Daughdrill for helpful discussions, and Veronica Sanchez and members of the lab for critical reading of the manuscript.
REFERENCES
- 1.Adamo, J. E., J. Schroer, and T. Shenk. 2004. Human cytomegalovirus TRS1 protein is required for efficient assembly of DNA-containing capsids. J. Virol. 78:10221-10229. [DOI] [PMC free article] [PubMed] [Google Scholar]
- 2.Albrecht, T., M. P. Fons, I. Bologh, S. AbuBakar, C. Z. Deng, and D. Millinoff. 1991. Metabolic and cellular effects of human cytomegalovirus infection. Transplant. Proc. 23:48-55. [PubMed] [Google Scholar]
- 3.Blankenship, C. A., and T. Shenk. 2002. Mutant human cytomegalovirus lacking the immediate-early TRS1 coding region exhibits a late defect. J. Virol. 76:12290-12299. [DOI] [PMC free article] [PubMed] [Google Scholar]
- 4.Boldogh, I., S. AbuBakar, and T. Albrecht. 1990. Activation of proto-oncogenes: an immediate early event in human cytomegalovirus infection. Science 247:561-564. [DOI] [PubMed] [Google Scholar]
- 5.Bonin, L. R., and J. K. McDougall. 1997. Human cytomegalovirus IE2 86-kilodalton protein binds p53 but does not abrogate G1 checkpoint function. J. Virol. 71:5861-5870. [DOI] [PMC free article] [PubMed] [Google Scholar]
- 6.Boppana, S. B., K. B. Fowler, W. J. Britt, S. Stagno, and R. F. Pass. 1999. Symptomatic congenital cytomegalovirus infection in infants born to mothers with preexisting immunity to cytomegalovirus. Pediatrics 104:55-60. [DOI] [PubMed] [Google Scholar]
- 7.Bresnahan, W. A., I. Boldogh, E. A. Thompson, and T. Albrecht. 1996. Human cytomegalovirus inhibits cellular DNA synthesis and arrests productively infected cells in late G1. Virology 224:150-160. [DOI] [PubMed] [Google Scholar]
- 8.Britt, W., and C. Alford. 1996. Cytomegalovirus, p. 2493-2523. In B. N. Fields et al. (ed.), Fields virology. Lippincott-Raven Publishers, Philadelphia, Pa.
- 9.Britt, W. J., and L. Vugler. 1987. Structural and immunological characterization of the intracellular forms of an abundant 68,000 Mr human cytomegalovirus protein. J. Gen. Virol. 68:1897-1907. [DOI] [PubMed] [Google Scholar]
- 10.Bunz, F., A. Dutriaux, C. Lengauer, T. Waldman, S. Zhou, J. P. Brown, J. M. Sedivy, K. W. Kinzler, and B. Vogelstein. 1998. Requirement for p53 and p21 to sustain G2 arrest after DNA damage. Science 282:1497-1501. [DOI] [PubMed] [Google Scholar]
- 11.Castillo, J. P., A. D. Yurochko, and T. F. Kowalik. 2000. Role of human cytomegalovirus immediate-early proteins in cell growth control. J. Virol. 74:8028-8037. [DOI] [PMC free article] [PubMed] [Google Scholar]
- 12.Chung, T. W., Y. C. Lee, J. H. Ko, and C. H. Kim. 2003. Hepatitis B virus X protein modulates the expression of PTEN by inhibiting the function of p53, a transcriptional activator in liver cells. Cancer Res. 63:3453-3458. [PubMed] [Google Scholar]
- 13.Cinque, P., R. Marenzi, and D. Ceresa. 1997. Cytomegalovirus infections of the nervous system. Intervirology 40:85-97. [DOI] [PubMed] [Google Scholar]
- 14.Cobbs, C. S., L. Harkins, M. Samanta, G. Y. Gillespie, S. Bharara, P. H. King, L. B. Nabors, C. G. Cobbs, and W. J. Britt. 2002. Human cytomegalovirus infection and expression in human malignant glioma. Cancer Res. 62:3347-3350. [PubMed] [Google Scholar]
- 15.Debbas, M., and E. White. 1993. Wild-type p53 mediates apoptosis by E1A, which is inhibited by E1B. Genes Dev. 7:546-554. [DOI] [PubMed] [Google Scholar]
- 16.Dittmer, D., and E. S. Mocarski. 1997. Human cytomegalovirus infection inhibits G1/S transition. J. Virol. 71:1629-1634. [DOI] [PMC free article] [PubMed] [Google Scholar]
- 17.Estes, J. E., and E.-S. Huang. 1977. Stimulation of cellular thymidine kinases by human cytomegalovirus. J. Virol. 24:13-21. [DOI] [PMC free article] [PubMed] [Google Scholar]
- 18.Fortunato, E. A., V. Sanchez, J. Y. Yen, and D. H. Spector. 2002. Infection of cells with human cytomegalovirus during S phase results in a blockade to immediate-early gene expression that can be overcome by inhibition of the proteasome. J. Virol. 76:5369-5379. [DOI] [PMC free article] [PubMed] [Google Scholar]
- 19.Fortunato, E. A., and D. H. Spector. 1998. p53 and RPA are sequestered in viral replication centers in the nuclei of cells infected with human cytomegalovirus. J. Virol. 72:2033-2039. [DOI] [PMC free article] [PubMed] [Google Scholar]
- 20.Fowler, K. B., F. P. McCollister, A. J. Dahle, S. Boppana, W. J. Britt, and R. F. Pass. 1997. Progressive and fluctuating sensorineural hearing loss in children with asymptomatic congenital cytomegalovirus infection. J. Pediatr. 130:624-630. [DOI] [PubMed] [Google Scholar]
- 21.Harkins, L., A. L. Volk, M. Samanta, I. Mikolaenko, W. J. Britt, K. I. Bland, and C. S. Cobbs. 2002. Specific localisation of human cytomegalovirus nucleic acids and proteins in human colorectal cancer. Lancet 360:1557-1563. [DOI] [PubMed] [Google Scholar]
- 22.Hirai, K., and Y. Watanabe. 1976. Induction of α-type DNA polymerases in human cytomegalovirus-infected WI-38 cells. Biochim. Biophys. Acta 447:328-339. [DOI] [PubMed] [Google Scholar]
- 23.Hoffman, W. H., S. Biade, J. T. Zilfou, J. Chen, and M. Murphy. 2002. Transcriptional repression of the anti-apoptotic survivin gene by wild type p53. J. Biol. Chem. 277:3247-3257. [DOI] [PubMed] [Google Scholar]
- 24.Hsu, C. H., M. D. Chang, K. Y. Tai, Y. T. Yang, P. S. Wang, C. J. Chen, Y. H. Wang, S. C. Lee, C. W. Wu, and L. J. Juan. 2004. HCMV IE2-mediated inhibition of HAT activity downregulates p53 function. EMBO J. 23:2269-2280. [DOI] [PMC free article] [PubMed] [Google Scholar]
- 25.Isom, H. C. 1979. Stimulation of ornithine decarboxylase by human cytomegalovirus. J. Gen. Virol. 42:265-278. [DOI] [PubMed] [Google Scholar]
- 26.Jault, F. M., J.-M. Jault, F. Ruchti, E. A. Fortunato, C. Clark, J. Corbeil, D. D. Richman, and D. H. Spector. 1995. Cytomegalovirus infection induces high levels of cyclins, phosphorylated RB, and p53, leading to cell cycle arrest. J. Virol. 69:6697-6704. [DOI] [PMC free article] [PubMed] [Google Scholar]
- 27.Jenkins, J. R., P. Chumakov, C. Addison, H. W. Sturzbecher, and A. Wade-Evans. 1988. Two distinct regions of the murine p53 primary amino acid sequence are implicated in stable complex formation with simian virus 40 T antigen. J. Virol. 62:3903-3906. [DOI] [PMC free article] [PubMed] [Google Scholar]
- 28.Jeong, S. J., M. Radonovich, J. N. Brady, and C. A. Pise Masison. 2004. HTLV-I Tax induces a novel interaction between p65/RelA and p53 which results in inhibition of p53 transcriptional activity. Blood 104:1490-1497. [DOI] [PubMed] [Google Scholar]
- 29.Juven, T., Y. Barak, A. Zauberman, D. L. George, and M. Oren. 1993. Wild type p53 can mediate sequence-specific transactivation of an internal promoter within the mdm2 gene. Oncogene 8:3411-3416. [PubMed] [Google Scholar]
- 30.Kartasheva, N. N., A. Contente, C. Lenz-Stoppler, J. Roth, and M. Dobbelstein. 2002. p53 induces the expression of its antagonist p73 Delta N, establishing an autoregulatory feedback loop. Oncogene 21:4715-4727. [DOI] [PubMed] [Google Scholar]
- 31.Ko, L. J., and C. Prives. 1996. p53: puzzle and paradigm. Genes Dev. 10:1054-1072. [DOI] [PubMed] [Google Scholar]
- 32.Kovacs, A., M. L. Weber, L. J. Burns, H. S. Jacob, and G. M. Vercellotti. 1996. Cytoplasmic sequestration of p53 in cytomegalovirus-infected human endothelial cells. Am. J. Pathol. 149:1531-1539. [PMC free article] [PubMed] [Google Scholar]
- 33.Levine, A. J., J. Momand, and C. A. Finlay. 1991. The p53 tumour suppressor gene. Nature 351:453-456. [DOI] [PubMed] [Google Scholar]
- 34.Liu, Y., and M. Kulesz-Martin. 2001. p53 protein at the hub of cellular DNA damage response pathways through sequence-specific and non-sequence-specific DNA binding. Carcinogenesis 22:851-860. [DOI] [PubMed] [Google Scholar]
- 35.Lokensgard, J. R., M. C. Cheeran, G. Gekker, S. Hu, C. C. Chao, and P. K. Peterson. 1999. Human cytomegalovirus replication and modulation of apoptosis in astrocytes. J. Hum. Virol. 2:91-101. [PubMed] [Google Scholar]
- 36.Meertens, L., C. Pise-Masison, N. Quere, J. Brady, A. Gessain, and R. Mahieux. 2004. Utilization of the CBP but not the p300 co-activator by human T-lymphotropic virus type-2 Tax for p53 inhibition. Oncogene 23:5447-5458. [DOI] [PubMed] [Google Scholar]
- 37.Mirza, A., Q. Wu, L. Wang, T. McClanahan, W. R. Bishop, F. Gheyas, W. Ding, B. Hutchins, T. Hockenberry, P. Kirschmeier, J. R. Greene, and S. Liu. 2003. Global transcriptional program of p53 target genes during the process of apoptosis and cell cycle progression. Oncogene 22:3645-3654. [DOI] [PubMed] [Google Scholar]
- 38.Miyashita, T., M. Harigai, M. Hanada, and J. C. Reed. 1994. Identification of a p53-dependent negative response element in the bcl-2 gene. Cancer Res. 54:3131-3135. [PubMed] [Google Scholar]
- 39.Muganda, P., R. Carrasco, and Q. Qian. 1998. The human cytomegalovirus IE2 86 kDa protein elevates p53 levels and transactivates the p53 promoter in human fibroblasts. Cell. Mol. Biol. (Noisy-le-Grand) 44:321-331. [PubMed] [Google Scholar]
- 40.Muganda, P., O. Mendoza, J. Hernandez, and Q. Qian. 1994. Human cytomegalovirus elevates levels of the cellular protein p53 in infected fibroblasts. J. Virol. 68:8028-8034. [DOI] [PMC free article] [PubMed] [Google Scholar]
- 41.Murphy, E. A., D. N. Streblow, J. A. Nelson, and M. F. Stinski. 2000. The human cytomegalovirus IE86 protein can block cell cycle progression after inducing transition into the S phase of permissive cells. J. Virol. 74:7108-7118. [DOI] [PMC free article] [PubMed] [Google Scholar]
- 42.Murphy, M., A. Hinman, and A. J. Levine. 1996. Wild-type p53 negatively regulates the expression of a microtubule-associated protein. Genes Dev. 10:2971-2980. [DOI] [PubMed] [Google Scholar]
- 43.Penfold, M. E., and E. S. Mocarski. 1997. Formation of cytomegalovirus DNA replication compartments defined by localization of viral proteins and DNA synthesis. Virology 239:46-61. [DOI] [PubMed] [Google Scholar]
- 44.Rosenke, K., M. A. Samuel, E. T. McDowell, M. A. Toerne, and E. A. Fortunato. 2006. An intact sequence-specific DNA-binding domain is required for human cytomegalovirus-mediated sequestration of p53 and may promote in vivo binding to the viral genome during infection. Virology 348:19-34. [DOI] [PubMed] [Google Scholar]
- 45.Royds, J. A., M. Hibma, B. R. Dix, L. Hananeia, I. A. Russell, A. Wiles, D. Wynford-Thomas, and A. W. Braithwaite. 2006. p53 promotes adenoviral replication and increases late viral gene expression. Oncogene 25:1509-1520. [DOI] [PubMed] [Google Scholar]
- 46.Salvant, B. S., E. A. Fortunato, and D. H. Spector. 1998. Cell cycle dysregulation by human cytomegalovirus: influence of the cell cycle phase at the time of infection and effects on cyclin transcription. J. Virol. 72:3729-3741. [DOI] [PMC free article] [PubMed] [Google Scholar]
- 47.Samanta, M., L. Harkins, K. Klemm, W. J. Britt, and C. S. Cobbs. 2003. High prevalence of human cytomegalovirus in prostatic intraepithelial neoplasia and prostatic carcinoma. J. Urol. 170:998-1002. [DOI] [PubMed] [Google Scholar]
- 48.Sanchez, V., C. L. Clark, J. Y. Yen, R. Dwarakanath, and D. H. Spector. 2002. Viable human cytomegalovirus recombinant virus with an internal deletion of the IE2 86 gene affects late stages of viral replication. J. Virol. 76:2973-2989. [DOI] [PMC free article] [PubMed] [Google Scholar]
- 49.Sanchez, V., A. K. McElroy, J. Yen, S. Tamrakar, C. L. Clark, R. A. Schwartz, and D. H. Spector. 2004. Cyclin-dependent kinase activity is required at early times for accurate processing and accumulation of the human cytomegalovirus UL122-123 and UL37 immediate-early transcripts and at later times for virus production. J. Virol. 78:11219-11232. [DOI] [PMC free article] [PubMed] [Google Scholar]
- 50.Sax, J. K., and W. S. El-Deiry. 2003. p53 downstream targets and chemosensitivity. Cell Death Differ. 10:413-417. [DOI] [PubMed] [Google Scholar]
- 51.Scheffner, M., B. A. Werness, J. M. Huibregtse, A. J. Levine, and P. M. Howley. 1990. The E6 oncoprotein encoded by human papillomavirus types 16 and 18 promotes the degradation of p53. Cell 63:1129-1136. [DOI] [PubMed] [Google Scholar]
- 52.Schierling, K., C. Buser, T. Mertens, and M. Winkler. 2005. Human cytomegalovirus tegument protein ppUL35 is important for viral replication and particle formation. J. Virol. 79:3084-3096. [DOI] [PMC free article] [PubMed] [Google Scholar]
- 53.Sinzger, C., and G. Jahn. 1996. Human cytomegalovirus cell tropism and pathogenesis. Intervirology 39:302-319. [DOI] [PubMed] [Google Scholar]
- 54.Song, Y. J., and M. F. Stinski. 2005. Inhibition of cell division by the human cytomegalovirus IE86 protein: role of the p53 pathway or cyclin-dependent kinase 1/cyclin B1. J. Virol. 79:2597-2603. [DOI] [PMC free article] [PubMed] [Google Scholar]
- 55.Spector, D. H. 1996. Activation and regulation of human cytomegalovirus early genes. Intervirology 39:361-377. [DOI] [PubMed] [Google Scholar]
- 56.Speir, E., R. Modali, E.-S. Huang, M. B. Leon, F. Sahwl, T. Finkel, and S. E. Epstein. 1994. Potential role of human cytomegalovirus and p53 interaction in coronary restenosis. Science 265:391-394. [DOI] [PubMed] [Google Scholar]
- 57.Stagno, S., R. F. Pass, G. Cloud, W. J. Britt, R. E. Henderson, P. D. Walton, D. A. Veren, F. Page, and C. A. Alford. 1986. Primary cytomegalovirus infection in pregnancy. Incidence, transmission to fetus, and clinical outcome. JAMA 256:1904-1908. [PubMed] [Google Scholar]
- 58.Tamashiro, J. C., L. J. Hock, and D. H. Spector. 1982. Construction of a cloned library of the EcoRI fragments from the human cytomegalovirus genome (strain AD169). J. Virology 42:547-557. [DOI] [PMC free article] [PubMed] [Google Scholar]
- 59.Tsai, H. L., G. H. Kou, S. C. Chen, C. W. Wu, and Y. S. Lin. 1996. Human cytomegalovirus immediate-early protein IE2 tethers a transcriptional repression domain to p53. J. Biol. Chem. 271:3534-3540. [PubMed] [Google Scholar]
- 60.Van Meir, E. G., T. Kikuchi, M. Tada, H. Li, A. C. Diserens, B. E. Wojcik, H. J. Huang, T. Friedmann, N. de Tribolet, and W. K. Cavenee. 1994. Analysis of the p53 gene and its expression in human glioblastoma cells. Cancer Res. 54:649-652. [PubMed] [Google Scholar]
- 61.Wade, M., T. F. Kowalik, M. Mudryj, E. S. Huang, and J. C. Azizkhan. 1992. E2F mediates dihydrofolate reductase promoter activation and multiprotein complex formation in human cytomegalovirus infection. Mol. Cell. Biol. 12:4364-4374. [DOI] [PMC free article] [PubMed] [Google Scholar]
- 62.Wang, J., P. H. Marker, J. D. Belcher, D. E. Wilcken, L. J. Burns, G. M. Vercellotti, and X. L. Wang. 2000. Human cytomegalovirus immediate early proteins upregulate endothelial p53 function. FEBS Lett. 474:213-216. [DOI] [PubMed] [Google Scholar]
- 63.Wang, X. W., K. Forrester, H. Yeh, M. A. Feitelson, J. R. Gu, and C. C. Harris. 1994. Hepatitis B virus X protein inhibits p53 sequence-specific DNA binding, transcriptional activity, and association with transcription factor ERCC3. Proc. Natl. Acad. Sci. USA 91:2230-2234. [DOI] [PMC free article] [PubMed] [Google Scholar]
- 64.Wei, W., R. M. Hemmer, and J. M. Sedivy. 2001. Role of p14(ARF) in replicative and induced senescence of human fibroblasts. Mol. Cell. Biol. 21:6748-6757. [DOI] [PMC free article] [PubMed] [Google Scholar]
- 65.Werness, B. A., A. J. Levine, and P. M. Howley. 1990. Association of human papillomavirus types 16 and 18 E6 proteins with p53. Science 248:76-79. [DOI] [PubMed] [Google Scholar]
- 66.Wing, B. A., R. A. Johnson, and E. S. Huang. 1998. Identification of positive and negative regulatory regions involved in regulating expression of the human cytomegalovirus UL94 late promoter: role of IE2-86 and cellular p53 in mediating negative regulatory function. J. Virol. 72:1814-1825. [DOI] [PMC free article] [PubMed] [Google Scholar]
- 67.Xu, Y. 2003. Regulation of p53 responses by post-translational modifications. Cell Death Differ. 10:400-403. [DOI] [PubMed] [Google Scholar]
- 68.Zaika, A. I., N. Slade, S. H. Erster, C. Sansome, T. W. Joseph, M. Pearl, E. Chalas, and U. M. Moll. 2002. DeltaNp73, a dominant-negative inhibitor of wild-type p53 and TAp73, is up-regulated in human tumors. J. Exp. Med. 196:765-780. [DOI] [PMC free article] [PubMed] [Google Scholar]
- 69.Zantema, A., J. A. Fransen, A. Davis-Olivier, F. C. Ramaekers, G. P. Vooijs, B. DeLeys, and A. J. Van der Eb. 1985. Localization of the E1B proteins of adenovirus 5 in transformed cells, as revealed by interaction with monoclonal antibodies. Virology 142:44-58. [DOI] [PubMed] [Google Scholar]
- 70.Zhu, H., Y. Shen, and T. Shenk. 1995. Human cytomegalovirus IE1 and IE2 proteins block apoptosis. J. Virol. 69:7960-7970. [DOI] [PMC free article] [PubMed] [Google Scholar]