

Abstract
The observed rates and deleterious impacts of biological invasions have caused significant alarm in recent years, driving efforts to reduce the risk (establishment) of new introductions. Characterizing the supply of propagules is key to understanding invasion risk and developing effective management strategies. In coastal ecosystems, ships' ballast water is an important transfer mechanism (vector) for marine and freshwater species. Commercial ships exhibit a high degree of variation in ballast water operations that affect both the quantity and quality of propagule supply, and thereby invasion risk. The per-ship inoculation size from ballast water depends upon both the volume discharged and the organism density. Moreover, propagule quality will vary among source regions (ports) and voyage routes, due to differences in species composition and transport conditions, respectively. We show that significant differences exist in (i) the frequency and volume of ballast water discharge among vessel types, (ii) the frequency of vessel types and routes (source regions) among recipient ports, and (iii) the transit success (survivorship) of zooplankton in ballast tanks among voyage routes. Thus, propagule supply is not a simple function of total ship arrivals. For ships, as well as other vectors, variation in propagule quantity and quality must be explicitly considered to estimate invasion risk and advance predictive ability.
Keywords: biological invasion, ballast water, propagule supply, survivorship, shipping patterns
1. Introduction
Biological invasions are reshaping the structure, dynamics and function of biological communities throughout the world (Carlton 1989; Lodge 1993; Mack et al. 2000). In recent times, the observed rate of new invasions has increased dramatically across global regions, habitat types and taxonomic groups (Mills et al. 1993; Cohen & Carlton 1998). For coastal ecosystems, this increase is often driven by dispersal of marine and freshwater organisms through commercial shipping (Ruiz et al. 2000; Fofonoff et al. 2003; Hewitt et al. 2004; but see also Galil 2000). Ships transport rich assemblages of organisms in their ballast tanks, which are routinely filled with coastal waters and discharged at subsequent ports of call (Carlton 1985; Carlton & Geller 1993; Smith et al. 1999). Organisms are also transferred on the outer surfaces of vessels (Coutts 1999; Gollasch 2002; Fofonoff et al. 2003; Minchin & Gollasch 2003). For any transfer mechanism (vector), understanding how propagule supply varies in space and time is of critical importance for advancing predictive capacity and implementing effective management strategies (Williamson 1996; Drake & Lodge 2004; Endresen et al. 2004). Propagule supply is characterized not only by size (density or total number), but also by frequency and duration of inoculation. Differences in propagule abundance or geographical source of inocula can strongly affect colonization (Grevstad 1999; Lonsdale 1999; Ruiz et al. 2000). For example, total number of ship arrivals may be a poor predictor of invasion risk if propagule supply varies as a function of the type of vessel and its ballast discharge behaviour, the source region, or the duration of the voyage. Using several independent datasets, we assess the magnitude of variation in propagule supply via ballast water among vessels and consider its importance in estimates of invasion risk for coastal ecosystems. First, we compare the frequency and amount of ballast water discharge among vessel types arriving at US ports from overseas. Second, we characterize and contrast the relative contributions of different vessel types and geographical source regions (last port of call) for arrivals to individual US ports. Third, we test for differences in survivorship of ballasted zooplankton communities among three different shipping routes, using replicated voyages on each route: Hadera (Israel) to Chesapeake Bay (USA); Massachusetts (USA) to Chesapeake Bay (USA); and California and Washington (USA) to Prince William Sound, Alaska (USA).
2. Material and methods
(a) Effect of ship type on ballast discharge volume
We compared ballast water discharge volumes among vessel types, using data from the National Ballast Information Clearinghouse (NBIC; http://invasions.si.edu/nbic). The ballast water volumes were reported by ships arriving from foreign ports to all US ports during the 3-year period between July 1999 and June 2002 (n=45 072). The ships were classified into one of seven identifiable categories, which reflected different types of trade (cargo), including: bulker, chemical carrier, container, general cargo, passenger vessel, roll on–roll off (ro-ro) and tanker. In addition, some arrivals (2.6% of total) belonged to an unspecified ship type and were classified as an eighth category, ‘other’. For each ship type, we estimated (i) the proportion of arrivals that discharged ballast water and (ii) the mean volume of ballast water released for those ships that reported discharge. We compared the discharge amount among vessel types, using ANOVA. Data from all vessels reporting during this 3-year period were used in this analysis. We note that only approximately 35% of all incoming vessels as recorded by the US Maritime Administration (MARAD) also reported ballast water information to NBIC; although NBIC reporting is self-selected and therefore may have some bias, these are the most comprehensive national level data of this sort available to date (see Miller et al. 2005 for further discussion).
(b) Effect of recipient port on ship arrival characteristics
We compared the relative contribution of seven different vessel types to foreign shipping traffic at 13 major US ports between July 1999 and June 2002, using US customs data compiled by MARAD. MARAD reported 56 070 foreign arrivals to these 13 ports during this period. All data were used to estimate and compare (chi-square) the frequency of arrivals per ship type among the ports.
Using these same data, we also compared the relative contribution of different geographical source regions (last ports of call) to the arrivals for three port systems: Chesapeake Bay, Houston and Los Angeles/Long Beach. These port systems were selected to include a representative port for each of the US coasts (Atlantic, Gulf of Mexico and Pacific), as the traffic patterns are expected to differ on this regional basis.
(c) Effect of voyage route on zooplankton survivorship
We estimated the survivorship of zooplankton in ballast tanks on 25 separate voyages, involving seven different ships (either oil tankers or coal carriers) on three different routes. For each route, the vessel types, specific routes, average voyage durations and time-intervals were as follows:
coal carrier, 10 trans-Atlantic voyages (16–22 days) from Hadera, Israel or Ashdod, Israel to Baltimore, MD (1994–1997);
coal carrier, seven coastwise Atlantic voyages (1.5 days) from Somerset, MA to Norfolk, VA (1996–1997);
oil tankers, eight coastwise Pacific voyages (between 2 and 8 days) from Seattle, WA to Valdez, AK or San Francisco, CA to Valdez, AK (1998–1999).
Zooplankton samples were collected from wing tanks or cargo holds of vessels. Initial samples were taken immediately after ballasting at the departure port and final samples were taken prior to de-ballasting at the arrival port. In all cases, the same tank was sampled initially and re-sampled at the end of the voyage using an identical protocol. Zooplankton samples were collected using a 30 cm diameter, 80 μm mesh net that was towed vertically through the water column at a rate of approximately 0.5 m s−1 (see Smith et al. 1999 for a more complete description). The tow length was 2 m, except for coastwise Pacific voyages, where tow lengths varied between 12.8 and 26 m, depending on the particular vessel. At least three vertical plankton tows were taken per tank at each time point on all vessels. Samples were fixed in 10% formalin and subsequently preserved in 75% ethanol prior to identification and enumeration. Temperature and salinity measurements of the ballast water were taken at the start and finish using a salinity–conductivity–temperature meter.
All organisms were identified to the lowest identifiable taxonomic level possible and enumerated using a stereomicroscope. We assumed that the taxa identified were alive at the time of capture, as (i) dead organisms are believed to fall out of the water column, (ii) only specimens that showed signs of internal tissue or pigment were counted, and (iii) those with signs of gross damage were excluded. Copepods represented the majority of all taxa among ships (mean relative abundance in initial samples for all voyages: 88±5%; mean relative abundance in final samples for all voyages: 86±5%), but Mollusca, Polychaeta and Cirripedia were also abundant. No significant difference was found in the survivorship of these four most abundant taxonomic groups (F3,67=0.38, p=0.769); therefore all taxonomic groups were combined to examine changes in total zooplankton densities over time.
Initial and final abundance (number of organisms m−3) of total zooplankton were calculated based on tow volume for each voyage. To compare the change in density among voyages, tows were averaged to obtain mean initial and final abundances for total zooplankton per voyage, and the percentage change in density was calculated in the following way: (final density−initial density)/initial density×100. These data were then transformed using an arcsine square-root transformation, and a one-way ANOVA was used to compare the percentage change in abundance among voyage routes, with values for individual ships serving as replicates.
To determine whether total zooplankton density changed significantly over time within a given voyage route, the data were log-transformed and compared using paired t-tests, again with values for individual ships serving as replicates. We also used regression statistics to examine the relationship between voyage duration and percentage change for total zooplankton. This analysis was conducted using arcsine-square-root transformed ‘percentage change’ values to correct for non-constant error variance. All statistical analyses were carried out using Systat v. 10.2 and SAS statistical software.
3. Results
(a) Effect of ship type on ballast discharge volume
Overall, only 11 059 (24.5%) of the total 45 072 foreign arrivals to US ports reported discharge of ballast water. Out of these, significant differences existed in discharge frequency by ship type (table 1; , p<0.001). Bulk carriers, chemical carriers, and passenger vessels reported discharge at approximately twice the frequency (>40% of arrivals) of the other vessel types (less than 20% of arrivals).
Table 1.
The number of vessels arriving and the proportion discharging ballast water to US ports between July 1999 and June 2002.
| vessel type | number of vessels | % discharging |
|---|---|---|
| bulker | 6305 | 40.2 |
| chemical carrier | 97 | 46.4 |
| container | 15 763 | 17.2 |
| general cargo | 1933 | 18.8 |
| passenger | 5609 | 55.1 |
| ro-ro | 4193 | 17.6 |
| tanker | 7959 | 16.4 |
| unknown/other | 3213 | 8.6 |
For those arrivals reporting ballast water discharge, there was also a significant difference in the volume discharged among vessel types (figure 1; F8,12 998=474.9, p<0.001). Bulk carriers and tankers had significantly greater mean discharge amounts than other vessel types (Tukey's pairwise comparison test, p<0.05). Despite the high relative frequency of discharge for passenger vessels (see table 1), these had the lowest average discharge volumes of all ship types. It is also noteworthy that container vessel arrivals exceeded those of other vessel types by at least twofold but had moderate discharge volumes.
Figure 1.

The mean (±1 s.e.) volume of ballast water (metric tons, MT) delivered by different vessel types to US ports between July 1999 and June 2002. Significant differences in means (p<0.05) are denoted by different letters (Tukey's pairwise comparison test). The total numbers of vessel types de-ballasting are indicated above the bars.
(b) Effect of recipient port on ship arrival characteristics
The relative contribution of each ship type to foreign arrivals varied significantly across the 13 study ports (table 2; , p<0.001). For example, 40.9–69.0% of arrivals to the ports of Jacksonville, Long Beach, New York, Oakland and Seattle were container vessels, representing the largest single vessel type for each of these ports, compared with less than 20% of the traffic at Baltimore, Norfolk and three other ports. Bulkers were the single most abundant vessel type arriving to Baltimore, Norfolk and Portland, comprising 37.1–52.5% of the traffic. Tankers were the most abundant vessel type arriving to the ports of Boston, Houston and Tampa, representing 24.6–51.3% of foreign arrivals.
Table 2.
Foreign arrivals to US ports/port systems from July 1999 to June 2002.
| arrival port | bulker (%) | container (%) | general cargo (%) | passenger (%) | ro-ro (%) | tanker (%) | other (%) | total arrivals |
|---|---|---|---|---|---|---|---|---|
| Baltimore, MD | 37.1 | 15.8 | 9.6 | 1.4 | 4.3 | 12.7 | 19.1 | 1846 |
| Boston, MA | 9.1 | 28.0 | 0.2 | 9.1 | 0.6 | 51.3 | 1.7 | 1179 |
| Houston, TX | 11.3 | 11.9 | 7.4 | 1.5 | 1.9 | 46.8 | 19.2 | 11 198 |
| Jacksonville, FL | 8.8 | 40.9 | 5.3 | 0.0 | 13.3 | 12.4 | 19.3 | 2887 |
| LA/Long Beach, CA | 9.2 | 60.1 | 4.5 | 6.7 | 1.1 | 11.5 | 6.9 | 11 169 |
| Miami, FL | 0.7 | 18.5 | 12.7 | 19.2 | 16.1 | 0.2 | 32.6 | 11 453 |
| New York, NY | 9.2 | 47.1 | 4.0 | 4.9 | 2.3 | 29.8 | 2.7 | 7176 |
| Norfolk, VA | 41.1 | 18.6 | 6.6 | 0.6 | 4.2 | 16.6 | 12.3 | 927 |
| Portland, OR | 52.4 | 33.1 | 2.3 | 0.1 | 0.8 | 7.0 | 4.3 | 1508 |
| Seattle, WA | 9.2 | 69.0 | 7.1 | 0.4 | 0.1 | 1.1 | 13.1 | 1263 |
| San Diego, CA | 4.7 | 23.3 | 7.9 | 10.7 | 0.2 | 7.0 | 46.2 | 2251 |
| Oakland, CA | 13.3 | 66.2 | 2.4 | 2.1 | 0.8 | 11.7 | 3.5 | 712 |
| Tampa, FL | 22.8 | 3.2 | 17.6 | 11.2 | 3.5 | 24.6 | 17.1 | 2501 |
Percentage of arrivals belonging to different ship types.
In addition to differences in arrival composition of vessel types among ports, there were also striking differences among ports in the contribution of various geographical source regions for arriving vessels (figure 2). For example, the geographical sources of combined vessel traffic arriving to the port systems of Chesapeake Bay, Houston and Los Angeles differed significantly (, p<0.001). Most of the foreign traffic to the Chesapeake Bay arrived from the northeastern Atlantic, whereas traffic to Houston arrived predominantly from the northwestern Atlantic, and to Los Angeles/Long Beach arrived predominantly from the Pacific basin.
Figure 2.

Number of foreign arrivals to (a) Chesapeake Bay, (b) Houston and (c) Los Angeles/Long Beach from July 1999 to June 2002. Arrivals are grouped by ship type and by source region (Oceans: A, Atlantic; P, Pacific; I, Indian. Regions: NE, northeast; NW, northwest; SE, southeast; SW, southwest E, east; W, west; HS, high seas).
(c) Effect of voyage route on zooplankton survivorship
Zooplankton survivorship differed significantly among the three voyage routes (figure 3a–c; F2,20=21.29, p<0.001). Significantly greater reductions in abundances occurred during transatlantic voyages (91.6±4.3%) than during either the Pacific (29.0±9.8%) or Atlantic (27.3±16.8%) coastwise voyages (Tukey's pairwise comparison test, p<0.001), though there was no significant difference in survivorship between Atlantic and Pacific coastwise voyages (Tukey's pairwise comparison test, p=0.98).
Figure 3.
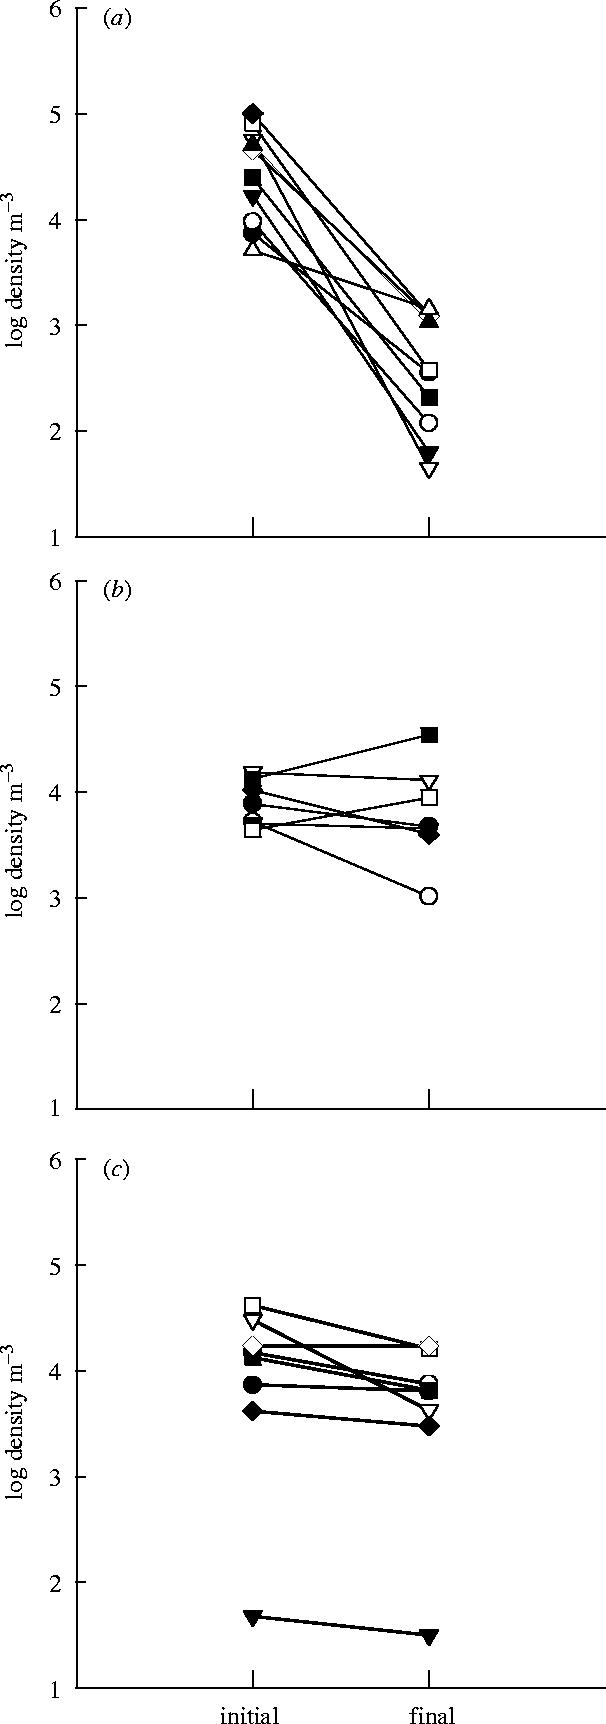
Zooplankton density (organisms m−3) recorded in ballast tanks at the beginning (initial) and end (final) of (a) transatlantic, (b) Atlantic coastwise and (c) Pacific coastwise voyages.
Significant reductions in total zooplankton density were recorded for transatlantic and Pacific coastwise voyages, but not for Atlantic coastwise voyages (paired t-tests; table 3).
Table 3.
Mean (±1 s.e.) initial and final zooplankton density (organisms m−3) for each voyage route and results of paired t-tests for differences in initial and final densities.
| voyage route | (s.e.), n | (s.e.), n | tcrit | p |
|---|---|---|---|---|
| transatlantic | 39 860 (12 393),10 | 613 (210), 10 | 8.26 | <0.001 |
| Atlantic coastwise | 8820 (1642), 7 | 10 145 (4358), 7 | 0.71 | 0.502 |
| Pacific coastwise | 16 148 (5226), 8 | 7648 (2299), 8 | 20.97 | 0.02 |
Zooplankton survivorship was inversely correlated with voyage duration across all routes (figure 4; r2=0.601, p<0.001). Voyage duration, however, was confounded with geographical region (i.e. all of the long duration voyages originated in the eastern Mediterranean) making it difficult to assess the relative effects of voyage duration versus source region.
Figure 4.

Relationship between percentage change in total zooplankton density within ballast tanks and time (days) for transatlantic, Atlantic coastwise, Pacific coastwise voyages. The r2 and p values are based upon transformed (arcsine square root) data, while the values presented and line are based upon raw data.
Physical conditions within tanks remained relatively stable during the course of voyages. Neither temperature (t23=0.468, p=0.644) nor salinity (t23=1.062, p=0.299) conditions changed significantly between the start and finish of voyages
4. Discussion
There is general recognition of the importance of propagule supply in invasion dynamics, including aspects of both organism quantity and quality (Williamson 1996; Ruiz et al. 2000). When controlling for source and recipient regions, previous studies suggest that large inocula are more likely to lead to establishment than smaller ones (Simberloff 1986; Robinson & Edgemon 1988; Grevstad 1999; Kolar & Lodge 2001), and that the risk of establishment increases with inoculation frequency (Drake 1991; Grevstad 1999). In addition to such quantitative aspects of supply, variation in the number of invasions among geographical regions may also result from differences in source regions, which affect species composition as well as other qualities of the donor biota that arrive to different sites (Vermeij 1996; Miller et al. 2002).
For coastal ecosystems, the number of ship arrivals to a region indicates the potential for species transfers, not just via ballast water (as discussed here), but also on the hulls of vessels. Recent models have attempted to evaluate invasion dynamics and consequences of management strategies by using ship arrivals as a proxy for supply, assuming that all ship arrivals present the same degree of risk (e.g. Drake & Lodge 2004). We caution against this approach, which ignores variation, for ships or any other vector. Instead, effective models of vectors and their associated invasion risks require an explicit evaluation and treatment of how propagule supply varies in space and time. For example, propagule supply to an individual port is a complex function by ship types and source regions of the number of ship arrivals and their associated discharge patterns.
Our analyses illustrate that not all ships are created equal with respect to propagule supply. Frequency of ship arrivals alone does not adequately characterize the ballast-mediated species transfers, as it ignores multiple key components that influence the quantity and quality of propagules. More specifically, we expect invasion risk to vary among ports as a function of ballast discharge and source, as well as broader regional biogeographic patterns of the species pool, and these attributes are not reflected by number of ship arrivals.
The operational features of ships and commerce clearly have substantial impacts upon the quantity of ballast water discharged, and thus influence invasion risk. Among ship types, clear differences exist in the overall frequency and volumes of ballast water discharge. For example, container ships dominated the overall number of foreign vessel arrivals to US ports; however, this vessel type discharges relatively infrequently and in small volumes. Thus, ports showing high numbers of arrivals do not necessarily represent ports with the highest invasion risk. Moreover, the same ship type can behave very differently in different ports. Oil tankers and bulk carriers often carry cargo in one direction and ballast water in another, causing some ports to receive large quantities of ballast discharge (20 000–50 000 metric tons) per capita and other ports to receive very little from the same ships (Smith et al. 1999). Because of this variation, the number of ship arrivals is usually a poor proxy for assessing ballast water discharge among ports.
Importantly, ballast water communities differ strongly among ships with respect to their species composition, abundance and physiological condition. Such disparity in ballast composition results from differences in the biota present at different source ports or donor regions, as well as likely differences with season and voyage conditions. In general, the ballast community at the end of a voyage represents only a subset of the original assemblage, and how well organisms survive during ballast water transfer is determined by both donor region characteristics and specific voyage characteristics. In numerical terms, this study and other data (Lavoie et al. 1999; Smith et al. 1999; Wonham et al. 2001) indicate that there are generally declines in zooplankton density during the majority of voyages, regardless of their duration or the source location. However, the magnitude of decline varies between source locations and with voyage route, and much variation still remains unexplained. The extent to which variation in survivorship results from differences in biota, transport conditions, time, or the interactions of these variables, is not clear. For example, entrained species from different donor regions exhibit different dose-response curves upon inoculation to a single site, resulting from inter-regional (quality) differences in (i) environmental tolerance or requirements of the organisms, (ii) the physiological condition of organisms upon arrival, resulting from regional differences in tolerance or conditions experienced during transport and/or (iii) the strength of biotic interactions, such as competition or predation, at the recipient region.
Environmental factors independent of propagule pressure, such as availability of suitable habitat, patch size and local environmental conditions, are also critical in determining the likelihood of a species becoming established in a new environment (e.g. Lonsdale 1999). Thus, habitat heterogeneity, community complexity, species–habitat interactions and the stochastic nature of environmental processes probably play a significant role in determining which invasions are successful and which are not (Elton 1958; Crawley 1986; Simberloff 1989; Mack et al. 2000). Moreover, some environments simply offer poor opportunity for colonization such as those with high species richness (Tilman 1997; Stachowicz et al. 1999) and for many freshwater species transferred to high salinity habitats or vice versa (Smith et al. 1999).
Given the complexities and global scale of invasion pathways, models can be an especially powerful approach to develop predictions and explore effects of propagule supply and management on invasion dynamics. Nonetheless, the value of such models will depend upon the extent to which they incorporate key variables, including sources of variation known to affect invasion outcomes. At the very least, our data underscore a need to explicitly evaluate several aspects of vector operation to adequately characterize propagule supply by ships. We believe this approach is broadly applicable to any vector to understand the dynamics of species transfers and to advance predictive capacity about invasion outcomes.
Acknowledgments
We are grateful to S. Altman, S. Chaves, D. Friedman, T. Huber, D. Lavoie, K. Lion, L. McCann, K. Philips and B. Steves for field and laboratory assistance. We also thank many of our colleagues for valuable discussion and comment on various aspects of the manuscript, particularly R. Everett, C. Hewitt, A. Hines and M. Minton. Funding for this study was provided by Maryland and National Sea Grant Programs, Prince Williams Sound Regional Citizens Advisory Council, Smithsonian Scholarly Studies Program, US Coast Guard and US Fish & Wildlife Service.
Footnotes
As this paper exceeds the maximum length normally permitted, the authors have agreed to contribute to production costs.
References
- Carlton J.T. Transoceanic and interoceanic dispersal of coastal marine organisms: the biology of ballast water. Oceanogr. Mar. Biol. Annu. Rev. 1985;23:313–371. [Google Scholar]
- Carlton J.T. Man's role in changing the face of the ocean: biological invasions and implications for conservation of near-shore environments. Conserv. Biol. 1989;3:265–273. [Google Scholar]
- Carlton J.T, Geller J.B. Ecological roulette: the global transport of non-indigenous marine organisms. Science. 1993;261:78–82. doi: 10.1126/science.261.5117.78. [DOI] [PubMed] [Google Scholar]
- Coutts, A. D. M. 1999 Hull fouling as a modern vector for marine biological invasions: investigation of merchant vessels visiting northern Tasmania. MSc Thesis, Australian Maritime College, Tasmania.
- Cohen A.N, Carlton J.T. Accelerated invasion rate in a highly invaded estuary. Science. 1998;279:555–557. doi: 10.1126/science.279.5350.555. [DOI] [PubMed] [Google Scholar]
- Crawley M.J. The population biology of invaders. Phil. Trans. R. Soc. B. 1986;314:711–731. [Google Scholar]
- Drake J.A. Community-assembly mechanics and the structure of an experimental species ensemble. Am. Nat. 1991;137:1–26. [Google Scholar]
- Drake J.M, Lodge D.M. Global hot spots of biological invasions: evaluating options for ballast water management. Proc. R. Soc. B. 2004;271:574–580. doi: 10.1098/rspb.2003.2629. [DOI] [PMC free article] [PubMed] [Google Scholar]
- Elton C.S. Methuen & Co. Ltd; London: 1958. The ecology of invasions by animals and plants. [Google Scholar]
- Endresen O, Behrens H.L, Brynestad S, Andersen A.B, Skjong R. Challenges in global ballast water management. Mar. Pollut. Bull. 2004;48:615–623. doi: 10.1016/j.marpolbul.2004.01.016. [DOI] [PubMed] [Google Scholar]
- Fofonoff P.W, Ruiz G.M, Steves B, Carlton J.T. In ships or on ships? Mechanisms of transfer and invasion for non-native species to the coasts of North America. In: Ruiz G.M, Carlton J.T, editors. Invasive species: vectors and management strategies. Island Press; Washington, DC: 2003. pp. 152–182. [Google Scholar]
- Galil B.S. A sea under siege: alien species in the Mediterranean. Biol. Invasions. 2000;2:177–186. [Google Scholar]
- Gollasch S. The importance of ship hull fouling as a vector of species introduction in the North Sea. Biofouling. 2002;18:105–121. [Google Scholar]
- Grevstad F. Experimental invasions using biological control introductions: the influence of release size on the chance of population establishment. Biol. Invasions. 1999;1:313–323. [Google Scholar]
- Hewitt C.L, Willing J, Bauckham A, Cassiby A.M, Cox C.M.S, Jones L, Wotton D.M. New Zealand marine biosecurity: delivering outcomes in a fluid environment. NZ J. Mar. Freshwater Res. 2004;38:429–438. [Google Scholar]
- Kolar C.S, Lodge D.M. Progress in invasion biology: predicting invaders. Trends Ecol. Evol. 2001;16:199–204. doi: 10.1016/s0169-5347(01)02101-2. [DOI] [PubMed] [Google Scholar]
- Lavoie D.M, Smith L.D, Ruiz G.M. The potential for intracoastal transfer of non-indigenous species in the ballast water of ships. Estuar. Coast. Shelf Sci. 1999;48:551–564. [Google Scholar]
- Lodge D.M. Biological invasions: lessons for ecology. Trends Ecol. Evol. 1993;8:133–137. doi: 10.1016/0169-5347(93)90025-K. [DOI] [PubMed] [Google Scholar]
- Lonsdale W.M. Global patterns of plant invasions and the concept of invasibility. Ecology. 1999;80:1522–1536. [Google Scholar]
- Mack R.N, Simberloff D, Lonsdale W.M, Evans H, Clout M, Bazzaz F.A. Biotic invasions: causes, epidemiology, global consequences, and control. Ecol. Appl. 2000;10:689–710. [Google Scholar]
- Miller A.W, Hewitt C.L, Ruiz G.M. Invasion success: does size really matter? Ecol. Lett. 2002;5:159–162. [Google Scholar]
- Miller A.W, Ruiz G.M, Lion K. 2005. Status and trends of ballast water management in the United States. Second biennial report of the National Ballast Information Clearinghouse. (In review.) [Google Scholar]
- Mills E.L, Leach J.H, Carlton J.T, Secor C.L. Exotic species in the Great Lakes: a history of biotic crises and anthropogenic introductions. J. Great Lakes Res. 1993;19:1–54. [Google Scholar]
- Minchin D, Gollasch S. Fouling and ships' hulls: how changing circumstances and spawning events may result in the spread of exotic species. Biofouling. 2003;19:111–122. doi: 10.1080/0892701021000057891. [DOI] [PubMed] [Google Scholar]
- Robinson J.V, Edgemon M.A. An experimental evaluation of the effect of invasion history on community structure. Ecology. 1988;69:1410–1417. [Google Scholar]
- Ruiz G.M, Fofonoff P.W, Carlton J.T, Wonham M.J, Hines A.H. Invasion of coastal marine communities in North America: apparent patterns, processes, and biases. Annu. Rev. Ecol. Syst. 2000;31:481–531. [Google Scholar]
- Simberloff D. Introduced insects: a biogeographical and systematic perspective. In: Mooney H.A, Drake J.A, editors. Ecology of biological invasions of North America and Hawaii. Springer; New York: 1986. pp. 3–26. [Google Scholar]
- Simberloff D. Which insect introductions succeed and which fail? In: Drake J.A, Di Castri F, Groves R.H, Kruger F.J, Mooney H.A, Rejmanek M, Williamson M.H, editors. Biological Invasions: a global perspective. Wiley & Sons Ltd; Chichester, UK: 1989. pp. 61–75. [Google Scholar]
- Smith L.D, Wonham M.J, McCann L.D, Ruiz G.M. Invasion pressure to a ballast-flooded estuary and an assessment of inoculant survival. Biol. Invasions. 1999;1:67–87. [Google Scholar]
- Stachowicz J.J, Whitlatch R.B, Osman R.W. Species diversity and invasion resistance in a marine ecosystem. Science. 1999;286:1577–1579. doi: 10.1126/science.286.5444.1577. [DOI] [PubMed] [Google Scholar]
- Tilman D. Community invisibility, recruitment limitation and grassland biodiversity. Ecology. 1997;78:81–92. [Google Scholar]
- Vermeij G.J. An agenda for invasion biology. Biol. Conserv. 1996;78:3–9. [Google Scholar]
- Williamson M. Chapman & Hall; London: 1996. Biological invasions. [Google Scholar]
- Wonham M.J, Walton W.C, Ruiz G.M, Frese A.M, Galil B.S. Going to the source: role of the invasion pathway in determining potential invaders. Mar. Ecol. Prog. Ser. 2001;215:1–12. [Google Scholar]