Abstract
Vanadium compounds can mimic actions of insulin through alternative signalling pathways. The effects of three organic vanadium compounds were studied in non-ketotic, streptozotocin-diabetic rats: vanadyl acetylacetonate (VAc), vanadyl 3-ethylacetylacetonate (VEt), and bis(maltolato)oxovanadium (VM). A simple inorganic vanadium salt, vanadyl sulphate (VS) was also studied.
Oral administration of the three organic vanadium compounds (125 mg vanadium element l−1 in drinking fluids) for up to 3 months induced a faster and larger fall in glycemia (VAc being the most potent) than VS. Glucosuria and tolerance to a glucose load were improved accordingly.
Activities and mRNA levels of key glycolytic enzymes (glucokinase and L-type pyruvate kinase) which are suppressed in the diabetic liver, were restored by vanadium treatment. The organic forms showed greater efficacy than VS, especially VAc.
VAc rats exhibited the highest levels of plasma or tissue vanadium, most likely due to a greater intestinal absorption. However, VAc retained its potency when given as a single i.p. injection to diabetic rats. Moreover, there was no relationship between plasma or tissue vanadium levels and any parameters of glucose homeostasis and hepatic glucose metabolism. Thus, these data suggest that differences in potency between compounds are due to differences in their insulin-like properties.
There was no marked toxicity observed on hepatic or renal function. However, diarrhoea occurred in 50% of rats chronically treated with VS, but not in those receiving the organic compounds.
In conclusion, organic vanadium compounds, in particular VAc, correct the hyperglycemia and impaired hepatic glycolysis of diabetic rats more safely and potently than VS. This is not simply due to improved intestinal absorption, indicating more potent insulin-like properties.
Keywords: Vanadium, organic ligands, glycolytic enzymes, gluconeogenic enzymes, gene expression, antidiabetic agents, streptozotocin-diabetic rats, toxicity
Introduction
Vanadium compounds mimic actions of insulin through alternative signalling pathways which involve the inhibition of phosphotyrosine phosphatases and the interplay between two non-insulin receptor tyrosine kinases (Elberg et al., 1997; Tsiani & Fantus, 1997). The insulin-like potential of vanadium has been demonstrated in vitro, and in vivo in rodents (where the oxidation states IV and V were found to be equipotent (Becker et al., 1994)), and more recently in human diabetic subjects (see Brichard & Henquin, 1995; Tsiani & Fantus, 1997). The clinical studies performed so far have used the simple naturally occurring inorganic vanadium salts (metavanadate (V) or vanadyl sulphate (VS, IV)) (Cohen et al., 1995; Goldfine et al., 1995; Boden et al., 1996).
Vanadium compounds have been synthesized (Posner et al., 1994; Caravan et al., 1995; Sakurai et al., 1995; Crans et al., 1997), among which organic vanadium (IV) complexes (vanadyl cation coordinated to an organic ligand) merit further attention. This study will focus on three of these complexes: vanadyl acetylacetonate (VAc), vanadyl 3-ethylacetylacetonate (VEt) and bis(maltolato)oxovanadium (VM). VM is the first and most studied vanadium complex in diabetic rodents. When administered acutely, VM is two to three times more effective than its inorganic analogue VS in lowering blood glucose. However, no direct comparison of the long-term effects of VM with VS has been reported (Yuen et al., 1993a,1993b; Yuen et al., 1995). VM has been licensed and is targeted to enter clinical trials in the near future (Orvig, personal communication). Recently, VAc was found to be a more potent stimulator of lipogenesis than VS in isolated rat adipocytes (Li et al., 1996). However, the potential efficiency of this compound has not yet been determined in vivo. VEt is a newly synthesized compound chemically related to VAc, the insulin-like properties of which have not been characterized.
In the present study, we compared the long-term effects of VAc, VEt and VM on glucose homeostasis and hepatic glucose metabolism in low-dose streptozotocin-treated rats which developed a non-ketotic, insulin-deficient condition of diabetes. The inorganic salt, VS, was also studied.
Methods
Animals
Male Wistar/CPB rats (7-week-old; 220±1 g) were purchased from IFFA Credo (Brussels, Belgium) and used in two distinct experiments based on different routes and durations of vanadium administration. The animals were housed in individual cages at a constant temperature (22°C) with a fixed 12-h-light-dark cycle (lights on 07.00–19.00 h). In experiment 1, they were also housed for 1 week (week 8 of treatment) in metabolic cages permitting daily recording of food consumption and urine volume as well as daily fluid intake. All rats received a standard pellet diet (A04, Usine d'Alimentation Rationnelle, Villemoisson-sur-Orge, France) composed of (% of wet weight): 59 carbohydrate, 3 fat, 17 protein, 21 water-minerals-cellulose. Non-ketotic diabetes was induced by an i.v. injection of streptozotocin (STZ; 38 mg per kg body weight) into a tail vein. STZ was dissolved in cold 0.1 mol l−1 citrate buffer (pH 4.5) immediately before use. Control animals received buffer only.
All procedures have been approved by the University Animal Care Committee.
Experimental design
Experiment 1: Long-term administration of oral vanadium compounds
Two separate populations of rats were used in this experiment; although, as the results obtained in both series were similar, they were pooled for presentation. In total, 64 rats were divided into seven experimental groups: non-diabetic control rats (C; n=6), untreated diabetic rats (D; n=8), and diabetic rats treated with one of the following four vanadium compounds [bis(maltolato)oxovanadium (VM; n=10), vanadyl ethylacetylacetonate (VEt; n=11), vanadyl acetylacetonate (VAc; n=11) and vanadyl sulphate (VS; n=10)], and calorie-restricted diabetic rats which were matched for body weight with the treated rats (weight-matched, WM; n=8). Seven days after injection of citrate buffer, body weight, plasma glucose and insulin levels of C rats were 258±3 g, 6.4±0.1 mmol l−1 and 3.5±0.5 ng ml−1, respectively. Seven days after injection of STZ, diabetic rats were assigned to untreated, weight- matched or treated groups as mentioned above. The six groups of diabetic rats had similar pre-treatment body weight (D, 238±4 g; WM: 240±4 g; VM, 238±3 g; VEt, 240±4 g; VAc, 240±5 g; VS, 239±3 g) and fed plasma glucose levels (D, 25.2±0.7 mmol l−1; WM, 25.3±0.6 mmol l−1; VM, 25.4±0.8 mmol l−1; VEt, 24.1±1 mmol l−1; VAc, 24.2±1 mmol l−1; VS, 25.1±0.9 mmol l−1). They were also matched, as seen a posteriori, for pre-treatment fed plasma insulin concentrations (D, 1.5±0.6 ng ml−1; WM, 1.8±0.2 ng ml−1; VM, 1.7±0.2 ng mg−1; VAc, 1.8±0.2 ng ml−1; VEt, 1.8±0.2 ng ml−1; VS, 1.6±0.3 ng ml−1).
The four treated groups received the appropriate vanadium compound dissolved in drinking solutions (distilled water empirically supplemented with 85 mmol l−1 NaCl; Heyliger et al., 1985), and solutions were freshly prepared every second day. Vanadyl acetylacetonate (C10H14O5V) and vanadyl sulphate (VOSO4.3H2O) are commercially available, bis(maltolato)oxovanadium (C12H14O8V) was prepared as previously described (Caravan et al., 1995) and vanadyl 3-ethylacetylacetonate (C14H22O5V) was synthesized specifically for this experiment (Figure 1). Briefly, vanadyl 3-ethylacetylacetonate was obtained by adding 3-ethyl-2,4-pentanedione (5.00 g, 39.0 mmol) to vanadyl sulphate trihydrate (3.80 g, 17.5 mmol) in an acidic solution (10% H2SO4). In order for complexation to occur, the pH was raised to 6 with 10% sodium bicarbonate solution. Purification of the compound was achieved by dissolving the compound in chloroform, removing the impurities by filtration, and evaporating the solvent to dryness (Amin et al., manuscript submitted). As VEt was only moderately soluble in aqueous solution, it was necessary to sonicate it in order to obtain a complete dissolution. The colours of the administration solutions were as follows: VS, blue; VAc, turquoise; VEt, green and VM, yellowish-green.
Figure 1.
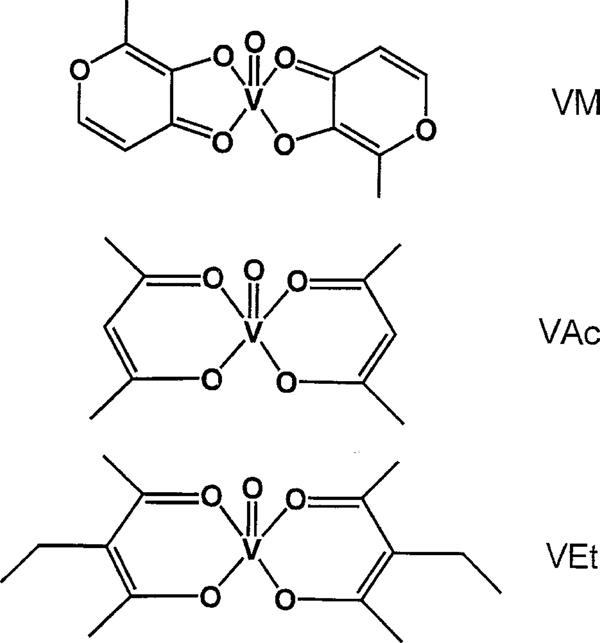
Chemical structures of the vanadium complexes with organic ligands: bis(maltolato)oxovanadium (VM), vanadyl acetylacetonate (VAc) and vanadyl ethylacetylacetonate (VEt).
The quantity required of each compound was calculated to yield the same concentration of vanadium element in the drinking solutions in all four groups. To partially overcome an initial aversion to the taste of vanadium and to ensure long-term fluid intake, this concentration was progressively increased during the first 4 weeks (from 40 to 125 mg l−1), then remained unchanged until the end of the study (11–12 weeks). Vanadium intake per rat (expressed per kg body weight) was calculated on the basis of body weight, fluid intake, molecular mass and concentration. Because vanadium treatment was accompanied by a reduced weight gain, which may possibly influence glucose homeostasis (see Brichard & Henquin, 1995), a last group of untreated diabetic rats (WM) received a restricted amount of food to ensure a body weight gain similar to that of vanadium-treated rats. This amount was empirically adjusted daily and administered in two rations (one-third at 09.30 h and two-thirds at 18.00 h).
Experiment 2: Acute administration of intraperitoneal vanadium compounds
Seven days after STZ injection, 32 diabetic rats were divided into four experimental groups treated with one of the four vanadium compounds (VM, n=8; VEt, n=8; VAc, n=8; VS, n=8). Rats received food ad libitum throughout the experiment. As in experiment 1, the four groups of rats were matched for pre-treatment body weight (VM, 231±2 g; VEt, 230±3 g; VAc, 231±5 g; VS, 229±4 g). They were also matched for pre-treatment fed plasma glucose levels. We had also checked that i.p. injection of saline the day before the treatment (day −1) did not modify the glycemia (day 0). Thus, fed (08.30–09.00 h) plasma glucose levels (mmol l−1) on days −1 and 0 were, respectively, 24.8±0.9 and 25.6±0.8 in VM, 25.1±0.8 and 25.7±0.5 in VEt, 25.0±1.1 and 26.1±1.3 in VAc, and 25.0±0.7 and 25.5±0.7 in VS rats. On day 0 (i.e. 7 days after STZ), rats received at 09.30 h a single i.p. injection of the appropriate compound dissolved in 9 g l−1 NaCl at a dose of 1.275 mg (or 0.025 mmol) vanadium element per kg body weight. This dose, much lower than that administered orally, was estimated from the knowledge that intestinal absorption of vanadium is low (Llobet & Domingo, 1984), and based on doses used in previous work (Yuen et al., 1993a). Subsequently, body weight was monitored on a daily basis and plasma glucose levels were measured on days 1, 4 and 5 after i.p. injection.
Sampling and tests
On several occasions, tail vein blood (100 μl) was collected from fed rats (between 08.30–09.00 h) for the determination of plasma glucose levels.
In experiment 1, at some time points, larger blood samples (250 μl) were also collected for plasma insulin or vanadium measurements. Additionally, all rats from this experiment underwent an oral glucose tolerance test (OGTT) after 6 weeks of treatment. On the day before the test, food was removed at 18.00 h (thus, WM rats did not receive their evening ration). The test started at 08.30 h. Glucose (30% w/v in water) was introduced directly into the stomach through a fine gastric catheter at a dose of 2 g kg body wt−1. Rats were gently wrapped in a towel to restrain them during blood sampling. Between 11 and 12 weeks of treatment, the rats were killed by decapitation between 01.30 and 04.30 h (i.e. in the absorptive state). Pancreas, liver and muscle (tibialis anterior) were immediately removed, frozen in liquid nitrogen and stored at −70°C for subsequent insulin or RNA extraction, and for enzyme or vanadium measurements. Blood samples were also collected for determination of toxicological parameters.
RNA extraction and Northern blot analysis
Total RNA was isolated with an acid guanidinium-thiocyanate-phenol-chloroform mixture after removal of liver glycogen as previously described (Ozcelikay et al., 1996). The concentration of RNA was determined by absorbance at 260 nm. At 260–280 nm, all samples had an absorbance ratio of about 1.8. For Northern blot analysis, RNA (30 μg) was denaturated in a solution containing 2.2 mM formaldehyde and 50% formamide (v/v) by heating at 95°C for 2 min. RNA was then size-fractionated by 1% agarose gel electrophoresis, transferred to a Hybond-N membrane (Amersham Int., Amersham, Bucks, U.K.) and cross-linked by ultraviolet irradiation. The integrity and relative amounts of RNA were assessed by methylene blue staining of the blot.
The cDNA probes were kindly supplied by Drs P. Iynedjian for glucokinase (GK) (Iynedjian et al., 1987). A Kahn for pyruvate kinase (L-PK) (Simon et al., 1983) and R.W. Hanson for phosphoenolpyruvate carboxykinase (PEPCK) (Yoo-Warren et al., 1983). Probes were labelled with 32P using the Multiprime labelling system kit (Amersham). Hybridizations with GK, L-PK, PEPCK probes and subsequent washings of the membranes were performed as reported earlier (Ozcelikay et al., 1996; Reul et al., 1997). The filters were thereafter exposed to Kodak X-OMAT AR films for 2–72 h at −70°C with intensifying screens. The same filters were successively hybridized with the different radiolabelled cDNA probes. The intensity of the mRNA bands on the blots was quantified by scanning densitometry (Sharp Scanner JX 325 combined with Image Master Software, Pharmacia, Uppsala, Sweden). To verify that each lane was loaded with equivalent amounts of total RNA, blots were hybridized with a synthetic oligonucleotide specific for ribosomal 18S RNA (Chan et al., 1984), and then levels of specific mRNAs were expressed relative to those of ribosomal 18S RNA.
Measurement of enzyme activities
The activities of GK (EC 2.7.1.1), L-PK (EC 2.7.1.40) and PEPCK (EC 4.1.1.32) were measured at 37°C, as previously described (Ozcelikay et al., 1996). L-PK activity was measured at 6.6 mM phosphoenolpyruvate (PEP) which corresponds to the maximal activity of the enzyme. Results were expressed as milliunits (mU) of enzyme per mg protein of liver cytosolic fraction, 1 mU of enzyme being defined as that amount which catalyzes the conversion of 1 nmol substrate per min under the assay conditions.
Analytical procedures
Plasma glucose was measured by a glucose oxidase method (Glucose Analyzer, Beckman, Fullerton, CA, U.S.A.) Plasma insulin was determined by a double-antibody radioimmunoassay, using rat insulin as standard (Novo Research Institute, Bagsvaerd, Denmark). Pancreatic insulin was extracted by homogenization and sonication of the tissue in acidified ethanol. Liver glycogen was measured after extraction with KOH, precipitation in ethanol, and hydrolysis with α-amylo-glucosidase. Plasma urea, creatinine, glutamic-oxaloacetic transaminase, and glutamic-pyruvic transaminase were measured with a Hitachi 717 Automatic Analyzer (Tokyo, Japan). Proteins in liver cytosolic fractions or in urine were determined by the method of Bradford (Bio-Rad, Munich, Germany), using bovine serum albumin as standard. Plasma and tissue vanadium levels were measured by atomic absorption spectrometry, as described previously (Buchet et al., 1982).
Materials
STZ was obtained from Upjohn Co. (Kalamazoo, MI, U.S.A.), VAc and VS from Aldrich Chemie (Steinheim, Germany), molecular biology reagents from Sigma Chemical Co. (St. Louis, MO, U.S.A.) and substrates for measurement of enzyme activities from Boehringer-Mannheim (Mannheim, Germany).
Statistical analysis
Results are presented as means±s.e.mean for the indicated numbers of rats. Comparisons between the different groups of rats were carried out by analysis of variance followed by the Newman-Keuls test for multiple comparisons. When indicated, comparisons were performed between only two groups of rats by the unpaired Student's t-test. In experiment 2, the acute decrease in glycemia produced by the treatment was analysed within a same group by repeated measures of analysis of variance followed by the Newman-Keuls test. The correlation analysis was performed using Pearson's test. Differences were considered statistically significant when P<0.05.
Results
Experiment 1: Long-term administration of oral vanadium compounds
As expected, untreated diabetic (D) rats gained weight at a much lower rate than control (C) rats (Figure 2). The body weight of vanadium-treated rats (VM, VEt, VAc, VS) was slightly but similarly decreased in comparison to D rats (this phenomenon could partly be explained by an aversion to the element, Brichard et al., 1988). Diabetic rats submitted to moderate calorie restriction (WM) exhibited a body weight gain similar to that of treated rats (Figure 2). Average fed plasma glucose levels were around 25 mmol l−1 in D rats. Hyperglycemia was unmodified by calorie restriction, but was decreased by vanadium treatment. Among these compounds, VAc induced the fastest (from the fifth day onward) and largest decrease in glycemia [P<0.05 or less vs VS throughout the study (except at week 6) and vs VM or VEt at most time points]. Average fed plasma insulin levels were not significantly different between vanadium-treated and untreated (D and WM) diabetic rats, and were reduced by ∼50% compared to C rats (P<0.01 or less at each sampling).
Figure 2.
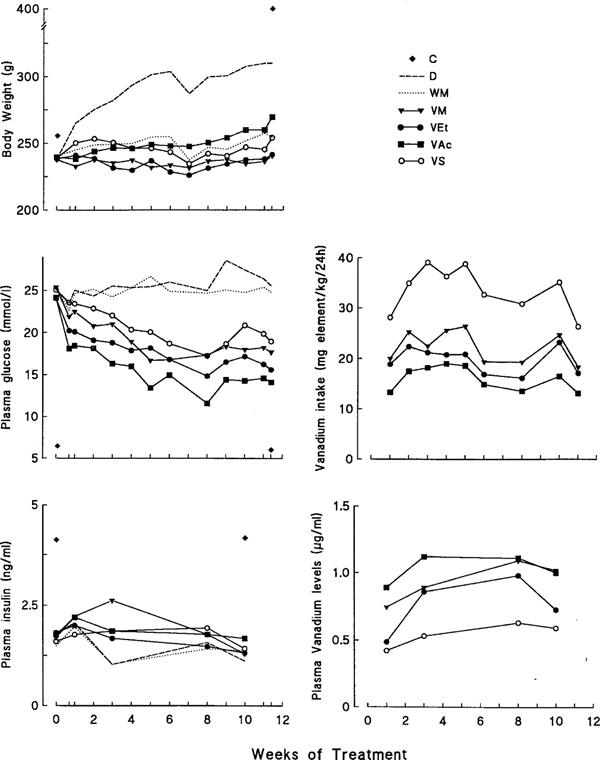
Influence of treatment with vanadium compounds on body weight, plasma glucose and insulin levels, and plasma concentrations and intake of vanadium in diabetic rats. Vanadium-treated diabetic rats receiving either VM, VEt, VAc or vanadyl sulphate (VS) compounds were compared to non-diabetic control (C), untreated diabetic (D) and body weight-matched diabetic (WM) rats. Each treated group received the same concentration of vanadium element in drinking solutions. This concentration was progressively increased during the first 4 weeks of the experiment (from 40 mg l−1 to 125 mg l−1), and then remained unchanged until the end of the study (i.e. between 11 and 12 weeks). Values are means for 6–11 rats in each group. s.e.mean which were always <10% of the mean (except for insulin, 20% at week 3) were omitted for sake of clarity.
The metabolic balance of the seven groups of rats was measured during week 8 of the treatment (Figure 3). Diabetic polydypsia, polyuria and glucosuria were partly attenuated by mere calorie restriction in WM rats, whereas larger reductions were produced by vanadium treatment. These reductions were more pronounced in rats treated with VM, VEt or VAc than in those treated with VS (Figure 3). Accordingly, daily consumption of vanadium element (provided in drinking solutions) was lower (P<0.05 or less) in rats receiving the organic compounds than in those receiving VS (Figure 2). In spite of higher levels of vanadium intake, VS rats exhibited the lowest (P<0.05 or less) levels of plasma vanadium throughout the study (Figure 2). Thus, there was no correlation between daily vanadium intake and the corresponding plasma vanadium levels at any time point studied (r⩽0.02; data not shown). VS rats also presented the greatest urinary excretion rate of vanadium, possibly due to their higher urine output (Figure 3). Daily food intake was increased ∼2.4 fold in D rats. It proved necessary to reduce by ∼45% food consumption of WM rats to ensure a body weight evolution similar to that of treated rats. The energy consumption of rats receiving VM, VEt or VAc was slightly depressed when compared to those receiving VS. However, when food intake was corrected for urinary losses of glucose, energy consumption (cal/rat d−1) was similar in all four groups of treated rats (VM: 43±1; VEt: 43±3; VAc: 45±2; VS: 50±3) (as well as in WM rats: 48±2).
Figure 3.
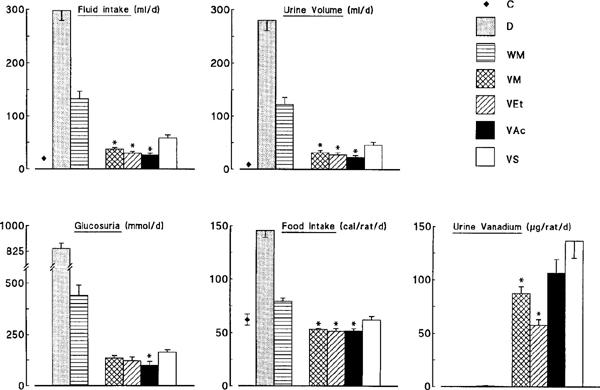
Metabolic balance of control (C), untreated diabetic (D), body weight-matched diabetic (WM) and vanadium-treated diabetic rats receiving one of the following compounds: bis(maltolato)oxovanadium (VM), vanadyl ethylacetylacetonate (VEt), vanadyl acetylacetonate (VAc) or (VS). Measurements were made daily during week 8 of the treatment, while the animals were housed in metabolic cages. Values are means±s.e.mean for 6–11 rats in each group. *P<0.05 or less for the indicated group of rats treated with organic (VM, VEt or VAc) vs inorganic (VS) vanadium compounds [ANOVA or t-test for glucosuria].
After an overnight fast, plasma glucose concentrations (time 0 of the OGTT) were lower (P<0.01 or less) in the four groups of treated rats than in D or WM rats, but were not different from those in C rats (Figure 4). Fasting plasma insulin levels were similar in diabetic rats whether they were treated or not, and were reduced by ∼60% compared to those in C rats (P<0.05 or less, scarcely visible in Figure 4).
Figure 4.
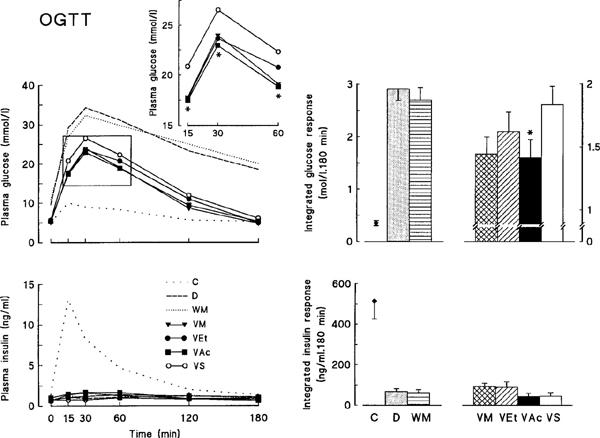
(Left panels) Plasma glucose and insulin levels during an oral glucose tolerance test (OGTT) in control (C), untreated diabetic (D), body weight-matched diabetic (WM) and vanadium-treated diabetic rats receiving either VM, VEt, VAc or VS compounds. (Insert) Early time points of glycemia in vanadium-treated rats. (Right panels) Integrated glucose and insulin responses during the OGTT. The test was performed after 6 weeks of treatment. Values are means±s.e.mean for 6–11 rats in each group. In the left panels, s.e.mean which were always <10% of the mean were omitted for sake of clarity. *P⩽0.05 for the indicated group of rats treated with organic (VM, VEt or VAc) vs inorganic (VS) vanadium compounds (t-test).
During the OGTT, plasma glucose levels remained less than 10 mmol l−1 in C rats, but rose to more than 30 mmol l−1 in D and WM rats and did not thereafter return to basal levels (Figure 4). In the four groups of vanadium-treated rats, glucose concentrations were consistently lower (P<0.01 or less) than in D or WM rats and were normalized at 180 min. Importantly, among the four treated groups, VAc rats had significantly lower plasma glucose levels than VS rats during the surge of glycemia (P⩽0.05 or less at 15, 30 and 60 min by t-test). Accordingly, the integrated glucose responses (areas under the curves and above basal values) were reduced by ∼35–60% in vanadium-treated rats as compared to D and WM rats, and by 25% in VAc rats compared to VS rats. In contrast to the rise of plasma insulin levels in C rats, the insulinemia and associated integrated insulin responses did not change and were similarly blunted in all six groups of diabetic rats (Figure 4).
Pancreatic insulin reserves (in μg pancreas−1) were also markedly reduced (by ∼95%, P<0.001) in diabetic rats whether they were treated (VM: 5±0.8; VEt: 8±3.2; VAc: 7±1.6; VS: 3±0.3) or not (D: 3±0.6; WM: 3±0.9), as compared to those in C rats (163±13).
Hepatic glycogen stores (in mg g liver−1), which were decreased by 55% in D rats (18±2 vs 40±3 in C rats; P<0.001), were unmodified by calorie restriction (26±3), but were fully and similarly replenished by vanadium treatment (VM: 42±1; VEt: 43±2; VAc: 44±2; VS: 46±2). Vanadium administration to diabetic rats also corrected the abnormal activity and expression of certain key enzymes involved in hepatic glucose metabolism, although the extent to which levels of activity and expression were corrected varied with the compounds used. GK activity and mRNA levels, which were markedly reduced in D and WM rats (<15% of C rats), were partly corrected by vanadium treatment. Among the four compounds used, VAc resulted in a greater restoration of both GK parameters than VS (Figure 5). L-PK activity and mRNA levels were also reduced in D and WM liver (∼30% of C rats), and were corrected by vanadium administration (Figure 5). Again, the most complete restoration of L-PK parameters was achieved by VAc. Activity and mRNA levels of the gluconeogenic enzyme, PEPCK, were increased in diabetic liver (250–300% of C levels). These parameters remained unchanged by food restriction but were similarly normalized by all four vanadium compounds (no significant differences between them) (Figure 5).
Figure 5.
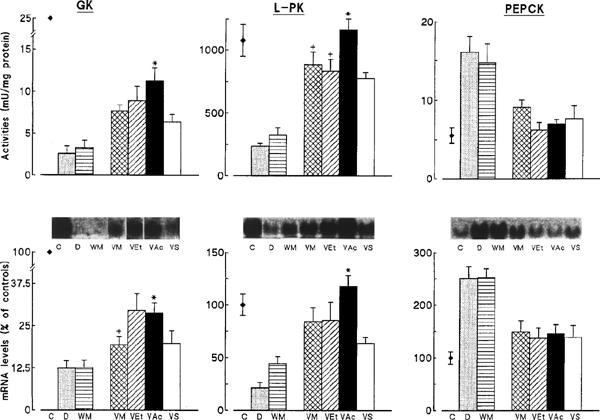
Influence of treatment with vanadium compounds on glucokinase (GK), L-type pyruvate kinase (L-PK) and phosphoenolpyruvate carboxykinase (PEPCK) activities and mRNA levels in the liver of diabetic rats. Values are means±s.e.mean for 6–11 control (C), untreated diabetic (D), body weight-matched diabetic (WM) and vanadium-treated diabetic rats receiving either VM, VEt, VAc or VS compounds. mRNA levels obtained from Northern-blots, like those in the inserts, are expressed as percentages of values in C rats. *P<0.05 or less for the indicated group of rats treated with organic (VM, VEt, or VAc) vs inorganic (VS) vanadium compounds. +P<0.05 for indicated group of rats treated with VM or VEt vs VAc treated rats (ANOVA or t-test (GK mRNA)).
Potential relationships between vanadium concentrations and the improvement of glucose homeostasis or hepatic glucose metabolism were examined. Besides plasma vanadium measurements, vanadium concentrations were also measured in two of the main target tissues for insulin action (liver and muscle) (Figure 6A). In liver, vanadium concentrations were the highest in VM and VAc rats and lowest in VS rats. Yet, the concentration reached in the later treated group remained larger (P<0.001) than those observed in C (0.02±0.001 ng mg−1, n=3) and D animals (0.01±0.003 ng mg−1, n=4). In muscle, the rats treated with the three organic compounds (VM, VEt, VAc) had significantly higher vanadium concentrations than those treated with VS, with the greatest value being produced by VAc. Vanadium concentrations in VS rats still remained ∼15 fold higher than those in C (0.02±0.01 ng mg−1, n=4) or D (0.04±0.01 ng mg−1, n=3) rats. There were strong positive correlations between vanadium concentrations in liver (r=0.73, P<0.0001) or muscle (r=0.63, P<0.0001) and those observed in plasma (Figure 6B, end of the study; the former correlation being in agreement with that of Mongold et al., 1990). However, there was no correlation between plasma vanadium levels and plasma glucose levels at any time point studied (week 10 is shown on Figure 6B as an example; r=0.18, P=0.25). Likewise, there was neither a correlation between vanadium concentrations in muscle and final period of glycemia (not shown), nor between vanadium concentrations in liver and L-PK activity (Figure 6B) or mRNA (not shown). Similarly, there was no correlation between liver vanadium concentrations and GK parameters (not shown).
Figure 6.
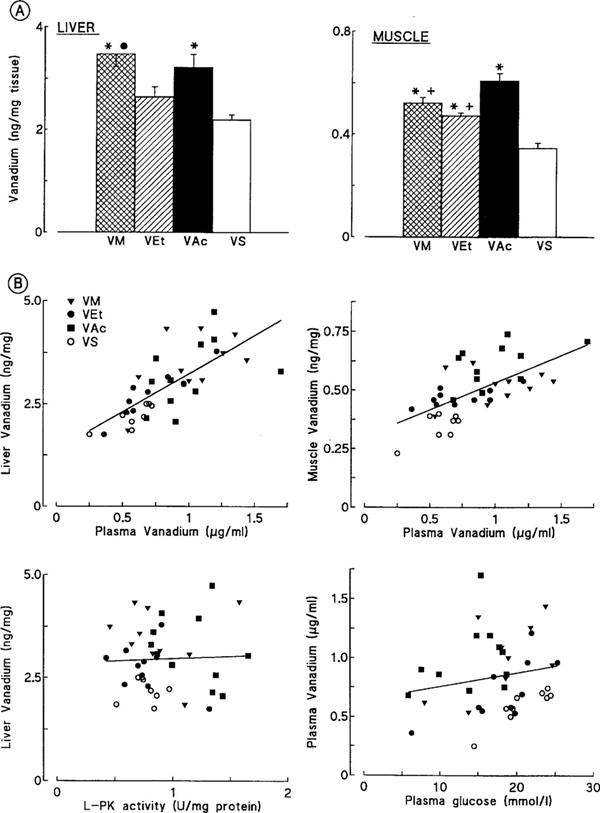
(A) Influence of treatment with vanadium compounds on vanadium concentrations in liver and muscle of diabetic rats. Values are means±s.e.mean for 8–11 vanadium-treated diabetic rats receiving either VM, VEt, VAc or VS compounds. *P<0.01 or less vs VS rats; •P<0.05 vs VEt rats; +P<0.01 or less vs VAc rats (ANOVA). (B) Upper panels: Relationships between tissue vanadium concentrations in liver and muscle versus plasma in treated rats. The whole population of treated (VM, VEt, VAc and VS together) rats was studied at the end of the experiment, the measurements being made after death (tissue) or after 10 weeks (plasma). Correlation coefficients were, respectively, r=0.73 for liver (P<0.0001) and r=0.63 for muscle (P<0.0001). Lower panels: Relationships between vanadium concentrations in liver and L-PK activity, and vanadium concentrations in plasma and glycemia in treated rats. Correlation coefficients were, respectively, r=0.043 (P=0.8) and r=0.18 (P=0.25).
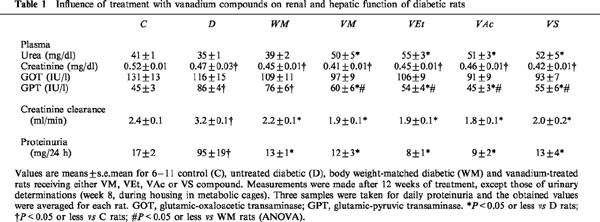
Twelve weeks of vanadium treatment had no obvious toxic side effects on renal or hepatic function (Table 1). The rise in urea observed in the four treated groups may reflect a marginal dehydration due to a decreased fluid consumption resulting from an aversion to the taste of vanadium (Brichard et al., 1988). Plasma creatinine levels were not different in untreated (D and WM) or vanadium-treated diabetic rats, and indeed were lower than those seen in C rats, which may result from a decrease in lean body mass. The creatinine clearance, which is augmented by diabetes due to a glomerular hyperfiltration rate (Jensen et al., 1981), was normalized in vanadium-treated rats, but this correction was not specific as it was achieved by mere calorie restriction (and decreased glucosuria) in WM rats. Accordingly, diabetic proteinuria was corrected in both WM and vanadium-treated diabetic rats. Levels of the liver cytosolic enzyme, GPT, which were elevated in diabetes due to hepatic steatosis (Ozcelikay et al., 1996), were unchanged by food restriction, but were specifically corrected by vanadium compounds. However, among these agents, VS resulted in diarrhoea in 50% of the rats from the sixth week of treatment onwards. In some animals, the diarrhoea was severe, leading to dehydration and weight loss. Two of ten VS rats subsequently died. Usually, the diarrhoea spontaneously ceases after treatment withdrawal or a reduction in the dose (Brichard & Henquin, 1995). In the present study, the treatment was maintained unchanged as the aim was to compare similar concentrations of vanadium element provided by the different compounds. No gastrointestinal disturbances were caused by any of the three organic compounds tested, which were likely better resorbed by the intestinal tract.
Table 1.
Influence of treatment with vanadium compounds on renal and hepatic function of diabetic rats
Experiment 2: Acute administration of intraperitoneal vanadium compounds
We next examined whether the blood glucose-lowering effect of the different vanadium compounds was affected when the gastrointestinal tract was bypassed (i.e. when the compounds were administered parenterally).
To this end, four groups of diabetic rats matched for initial body weight and glycemia, received a single i.p. injection of the appropriate vanadium compound (1.275 mg vanadium element per kg body weight). Under these conditions, only VAc induced a significant reduction in glycemia from day 1, an effect which persisted for up to 5 days. VM, VEt and VS were unable to induce such changes in glycemia (Figure 7). When blood samples were collected earlier (2, 4, 6 and 8 h after i.p. injection in day 0), we found no hypoglycaemic action for any of the compounds tested (not shown). Body weight (g) in the four groups was not significantly affected by the treatment (day 1: VM, 232±3; VEt, 230±2; VAc, 231±4; VS, 230±4 and day 5: VM, 239±3; VEt, 238±3; VAc, 238±6; VS, 237±5).
Figure 7.
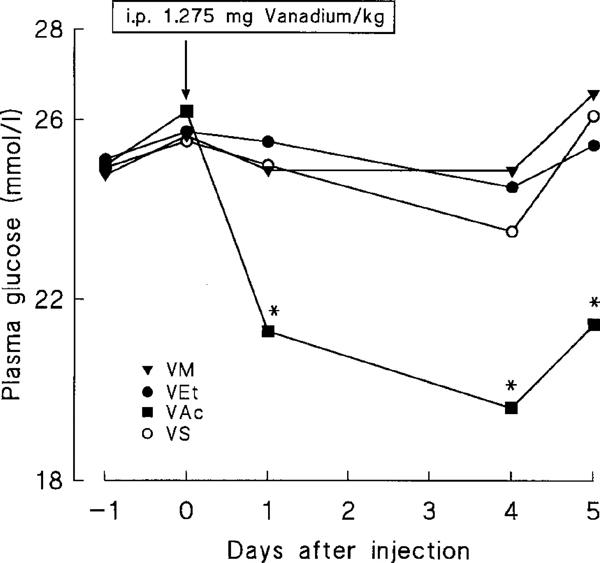
Influence of a single intraperitoneal injection of vanadium compounds on plasma glucose levels in diabetic rats. On day 0 (09.30 h), either VM, VEt, VAc or VS were injected into diabetic rats at a dose of 1.275 mg vanadium element per kg body weight. Values are means for eight rats in each group (s.e.mean which were always <10% of the mean were omitted for sake of clarity). *P<0.05 or less vs respective glycemia on day 0 (repeated measures of ANOVA).
Discussion
This study shows that organic vanadium compounds, in particular VAc, ameliorate more efficaciously and with fewer apparent side-effects than VS the hyperglycemia and impaired hepatic glucose metabolism seen in diabetic rats. This superiority is not simply due to an improved intestinal absorption, but may also be ascribed to more potent insulin-like properties.
The greater efficacy of VAc in lowering blood glucose may be explained partly by its greater efficiency of action on the diabetic liver. VAc reverses more potently than other compounds the impaired hepatic glycolysis (GK and L-PK activities), a correction which occurs at the pre-translational level. As this effect may partly be reproduced by treatment of rats with phlorizin (Brichard et al., 1993), the superiority of VAc on liver could result from more profound alleviation of glucose toxicity on this tissue. However, phlorizin treatment did not modify the low mRNA levels and activity of L-PK (Brichard et al., 1993). This suggests that VAc is more efficacious at eliciting insulin-like actions upon liver gene expression and metabolism.
Despite of the lowest levels of vanadium consumption, VAc rats had the highest levels of plasma or tissue vanadium. This may be due to a greater intestinal rate of absorption of the element, as urinary excretion of vanadium was low in all treated groups (1.5–2% of the ingested dose; compare Figures 2 and 3). Inorganic vanadium is usually poorly (1–10%) absorbed by the gastrointestinal tract (Llobet & Domingo, 1984; Yuen et al., 1993b), and the organic ligand is expected to increase the lipophilicity of the vanadium complex and consequently its absorption (Yuen et al., 1993a).
Could the superiority of VAc be explained solely by these observations (i.e. higher intestinal absorption and subsequent higher plasma or tissue vanadium)? This is unlikely for several reasons. Firstly, VAc retained its potency when the gastrointestinal tract was bypassed. Thus, after a single i.p. injection of the element (1.275 mg vanadium kg−1), only VAc significantly decreased the hyperglycemia in diabetic rats for up to 5 days. VS, VEt or VM were ineffective. This does not contradict a previous report where VM was effective by the i.p. route, but at substantially higher doses (3.21 mg vanadium kg−1) (Yuen et al., 1995). Secondly, at week 7, VAc rats had strikingly lower glycemia as compared to VEt or VM rats in spite of similar levels of vanadium intake and plasma vanadium (Figure 2). Indeed, there was no apparent relationship between plasma vanadium and glucose levels throughout the study (i.e. at any time point examined). There was also no relationship between liver vanadium and hepatic glucose metabolism, [glycolytic parameters (GK or L-PK mRNA or activity) specifically improved by VAc in particular] or muscle vanadium and glycemia. Taken together, these data suggest that either circulating or tissue vanadium concentrations may not reflect true intracellular vanadium levels or that another confounding factor – as yet unidentified – may interfere with the situation in vivo. Alternatively, differences in potency between vanadium compounds are rather explained by differences in their insulin-like properties. Recent in vitro studies support the latter hypothesis. VAc was more effective than VS in stimulating lipogenesis in isolated adipocytes under conditions where both compounds permeated cells similarly (Li et al., 1996). These differences in insulin-like properties were accounted for by a higher redox stability of VAc as compared to VS (i.e. prolonged intracellular stability of vanadium (IV) against oxidation; Li et al., 1996). Higher hydrophilic stability could also be involved (Li et al., 1996; Crans, unpublished data).
In spite of their higher potency, organic vanadium compounds were not more toxic than VS. Firstly, like VS, they did not alter hepatic or renal function as shown by the lack of increase in liver cytolytic enzymes or in creatinine and proteinuria. Secondly, the slowing of body weight gain, a common feature of vanadium treatment (Brichard & Henquin, 1995) was similar for all compounds tested. It turned out that energy-restricted rats matched for body weight with vanadium rats, were also matched for net (i.e. corrected for glucosuria) energy consumption. This indicates that the decrease in body weight in vanadium-treated rats can largely be ascribed to the lower food intake rather than to an additional toxic effect. Vanadium-induced anorexia is currently an adverse reaction in insulin-deficient diabetic rats in a catabolic state, but might be regarded as an advantage in non-insulin-dependent diabetes which is often associated with obesity. Thirdly, diarrhoea occurred in 50% of rats chronically treated with VS (thereby leading to increased mortality), but not in those rats receiving the organic compounds. In clinical studies with diabetic patients, VS and Na metavanadate, two inorganic vanadium salts, though given at much lower (∼100 fold) doses than in animal studies, resulted in mild gastrointestinal symptoms (nausea, mild diarrhoea, abdominal cramps and flatulence) which were either transient or responded to a decrease in dose (Cohen et al., 1995; Goldfine et al., 1995; Boden et al., 1996). In agreement with previous work (Yuen et al., 1993a; McNeill et al., 1995), our study showed that modification of the vanadium species with organic ligands may decrease the gastrointestinal side-effects of the element, possibly by enhancing its rate of absorption.
The presence of an organic ligand within a vanadium complex may thus influence the potency and the toxicity of the compound. Increasing the mass of the ligand by introducing ethyl groups does not seem to improve the parent compound (c.f. VEt vs VAc). The chemical rules determining which ligands will generate the most suitable complexes are still unclear, but relevant in view of their potential therapeutic value. Ideally, the use of one ligand should even direct the complex into one insulin-target tissue in preference to another, as has been shown for peroxovanadium compounds (Bevan et al., 1995). Clearly, the development of new analogues of vanadium is of importance for the management of diabetes. Since vanadium can utilize non-insulin-dependent pathways to exert its insulin-like activities, these novel derivatives will be potentially interesting for the treatment of the insulin-resistant state associated with non-insulin-dependent diabetes.
Acknowledgments
We are grateful to Professor J.C. Henquin for critical comments, Dr R. Walters for revising the English version, and Mrs A.M. Pottier for skilled assistance. This work was supported by grants from the Foundation of Scientific and Medical Research (3.4513.93), the Fund for Scientific Development (University of Louvain), the Fonds S and J Pirart (ABD) (to S.M.B.), and the Institute for General Medical Sciences, National Institutes of Health (to D.C.C.). S.M.B. is Chercheur Qualifié of the Fonds National de la Recherche Scientifique.
Abbreviations
- C
non-diabetic control rats
- D
untreated diabetic rats
- GK
Glucokinase
- L-PK
L-type pyruvate kinase
- OGTT
oral glucose tolerance test
- PEPCK
phosphoenolpyruvate carboxykinase
- STZ
streptozotocin
- VAc
vanadyl acetylacetonate
- VEt
vanadyl ethylacetylacetonate
- VM
bis(maltolato)oxovanadium
- VS
vanadyl sulphate
- WM
weight-matched diabetic rats
References
- BECKER D.J., ONGEMBA L.N., HENQUIN J.C. Comparison of the effects of various vanadium salts on glucose homeostasis in streptozotocin-diabetic rats. Eur. J. Pharmacol. 1994;260:169–175. doi: 10.1016/0014-2999(94)90334-4. [DOI] [PubMed] [Google Scholar]
- BEVAN A.P., BURGESS J.W., YALE J.F., DRAKE P.G., LACHANCE D., BAQUIRAN G., SHAVER A., POSNER B.I. In vivo insulin mimetic effects of pV compounds: role for tissue targeting in determining potency. Am. J. Physiol. 1995;268:E60–E66. doi: 10.1152/ajpendo.1995.268.1.E60. [DOI] [PubMed] [Google Scholar]
- BODEN G., CHEN X., RUIZ J., VAN ROSSUM G.D.V., TURCO S. Effects of vanadyl sulfate on carbohydrate and lipid metabolism in patients with non-insulin-dependent diabetes mellitus. Metabolism. 1996;45:1130–1135. doi: 10.1016/s0026-0495(96)90013-x. [DOI] [PubMed] [Google Scholar]
- BRICHARD S.M., HENQUIN J.C. The role of vanadium in the management of diabetes. Trends Pharmacol. Sci. 1995;16:265–270. doi: 10.1016/s0165-6147(00)89043-4. [DOI] [PubMed] [Google Scholar]
- BRICHARD S.M., HENQUIN J.C., GIRARD J. Phlorizin treatment of diabetic rats partially reverses the abnormal expression of genes involved in hepatic glucose metabolism. Diabetologia. 1993;36:292–298. doi: 10.1007/BF00400230. [DOI] [PubMed] [Google Scholar]
- BRICHARD S.M., OKITOLONDA W., HENQUIN J.C. Long term improvement of glucose homeostasis by vanadate treatment in diabetic rats. Endocrinology. 1988;123:2048–2053. doi: 10.1210/endo-123-4-2048. [DOI] [PubMed] [Google Scholar]
- BUCHET J.P., KNEPPER E., LAUWERYS R. Determination of vanadium in urine by electrothermal atomic absorption spectrometry. Anal. Chim. Acta. 1982;136:243. [Google Scholar]
- CARAVAN P., GELMINI L., GLOVER N., HERRING F.G., LI H., MCNEILL J.H., RETTIG S.J., SETYAWATI I.A., SHUTER E., SUN Y., TRACEY A.S., YUEN V.G., ORVIG C. Reaction chemistry of BMOV, Bis(maltolato)oxovanadium(IV)- a potent insulin mimetic agent. J. Am. Chem. Soc. 1995;117:12759–12770. [Google Scholar]
- CHAN Y.L., GUTELL R., NOLLER H.F., WOOL I.G. The nucleotide sequence of a rat 18S ribosomal ribonucleic acid gene and a proposal for the secondary structure of 18S ribosomal ribonucleic acid. J. Biol. Chem. 1984;259:224–230. [PubMed] [Google Scholar]
- COHEN N., HALBERTHAM M., SHLIMOVICH P., CHANG C.J., SHAMSON H., ROSSETTI L. Oral vanadyl sulfate improves hepatic and peripheral insulin sensitivity in patients with non-insulin dependent diabetes mellitus. J. Clin. Invest. 1995;95:2501–2509. doi: 10.1172/JCI117951. [DOI] [PMC free article] [PubMed] [Google Scholar]
- CRANS D.C., KERAMIDAS A.D., HOOVER-LITTY H., ANDERSON O.P., MILLER M.M., LEMOINE L.M., PLEASIC-WILLIAMS S., VANDENBERG M., ROSSOMANDO A.J., SWEET L.J. Synthesis, structure, and biological activity of a new insulinomimetic peroxovanadium compound: Bisperoxovanadium imidazole monoanion. J. Am. Chem. Soc. 1997;119:5447–5448. [Google Scholar]
- ELBERG G., HE Z., LI J., SEKAR N., SHECHTER Y. Vanadate activates membranous nonreceptor protein tyrosine kinase in rat adipocytes. Diabetes. 1997;46:1684–1690. doi: 10.2337/diab.46.11.1684. [DOI] [PubMed] [Google Scholar]
- GOLDFINE A.B., SIMONSON D.C., FOLLI F., PATTI M.E., KAHN C.R. Metabolic effects of sodium metavanadate in humans with insulin-dependent and noninsulin-dependent diabetes mellitus in vivo and in vitro studies. J. Clin. Endocrinol. Metab. 1995;80:3311–3320. doi: 10.1210/jcem.80.11.7593444. [DOI] [PubMed] [Google Scholar]
- HEYLIGER C.E., TAHILIANI A.G., MCNEILL J.H. Effect of vanadate on elevated blood glucose and depressed cardiac performance of diabetic rats. Science. 1985;227:1474–1477. doi: 10.1126/science.3156405. [DOI] [PubMed] [Google Scholar]
- IYNEDJIAN P.B., UCLA C., MACH B. Molecular cloning of glucokinase cDNA. Development and dietary regulation of glucokinase mRNA in rat liver. J. Biol. Chem. 1987;262:6032–6038. [PubMed] [Google Scholar]
- JENSEN P.K., CHRISTIANSEN J.S., STEVEN K., PARVING H.H. Renal function in streptozotocin-diabetic rats. Diabetologia. 1981;21:409–414. [PubMed] [Google Scholar]
- LI J., ELBERG G., CRANS D.C., SHECHTER Y. Evidence for the distinct vanadyl(+4)-dependent activating system for manifesting insulin-like effects. Biochemistry. 1996;35:8314–8318. doi: 10.1021/bi960209i. [DOI] [PubMed] [Google Scholar]
- LLOBET J.M., DOMINGO J.L. Acute toxicity of vanadium compounds in rats and mice. Toxicology Letters. 1984;23:227–231. doi: 10.1016/0378-4274(84)90131-0. [DOI] [PubMed] [Google Scholar]
- MCNEILL J.H., YUEN V.G., DAI S., ORVIG C. Increased potency of vanadium using organic ligands. Mol. Cell. Biochem. 1995;153:175–180. doi: 10.1007/BF01075935. [DOI] [PubMed] [Google Scholar]
- MONGOLD J.J., CROS G.H., VIAN L., TEP A., RAMANADHAM S., SIOU G., DIAZ J., MCNEILL J.H., SERRANO J.J. Toxicological aspects of vanadyl sulphate on diabetic rats: effects on vanadium levels and pancreatic B-cell morphology. Pharmacol. Toxicol. 1990;67:192–198. doi: 10.1111/j.1600-0773.1990.tb00812.x. [DOI] [PubMed] [Google Scholar]
- OZCELIKAY A.T., BECKER D.J., ONGEMBA L.N., POTTIER A.M., HENQUIN J.C., BRICHARD S.M. Improvement of glucose and lipid metabolism in diabetic rats treated with molybdate. Am. J. Physiol. 1996;270:E344–E352. doi: 10.1152/ajpendo.1996.270.2.E344. [DOI] [PubMed] [Google Scholar]
- POSNER B.I., FAURE R., BURGESS J.W., BEVAN A.P., LACHANCE D., ZHANG-SUN G., FANTUS I.G., NGG J.B., HALL D.A., SOO LUM B., SHAVER A. Peroxovanadium compounds: a new class of potent phosphotyrosine phosphatase inhibitors which are insulin mimetics. J. Biol. Chem. 1994;269:4596–4604. [PubMed] [Google Scholar]
- REUL B.A., BECKER D.J., ONGEMBA L.N., BAILEY C.J., HENQUIN J.C., BRICHARD S.M. Improvement of glucose homeostasis and hepatic insulin resistance in ob/ob mice given oral molybdate. J. Endocrinol. 1997;155:55–64. doi: 10.1677/joe.0.1550055. [DOI] [PubMed] [Google Scholar]
- SAKURAI H., FUJII K., WATANABE H., TAMURA H. Orally active and long-term acting insulin-mimetic vanadyl complex: bis(picolinato)oxovanadium(IV) Biochem. Biophys. Res. Com. 1995;214:1095–1101. doi: 10.1006/bbrc.1995.2398. [DOI] [PubMed] [Google Scholar]
- SIMON M.P., BESMOND C., COTTREAU D., WEBER A., CHAUMET-RIFFAUD P., DREYFUS J.C., SALA TREPAT J., MARIE J., KAHN A. Molecular cloning for L-type pyruvate kinase and aldolase B. J. Biol. Chem. 1983;258:14576–14584. [PubMed] [Google Scholar]
- TSIANI E., FANTUS I.G. Vanadium Compounds: Biological Actions and Potential as Pharmacological Agents. Trends Endocrinol. Metab. 1997;8:51–58. doi: 10.1016/s1043-2760(96)00262-7. [DOI] [PubMed] [Google Scholar]
- YOO-WARREN H., MONAHAN J.E., SHORT J., SHORT H., BRUZEL A., WYNSHAW-BORIS A., MEISNER H.M., SAMOLS D., HANSON R.W. Isolation and characterization of the gene coding for cytosolic phophoenolpyruvate carboxykinase (GTP) from the rat. Proc. Natl. Acad. Sci. U.S.A. 1983;80:3656–3660. doi: 10.1073/pnas.80.12.3656. [DOI] [PMC free article] [PubMed] [Google Scholar]
- YUEN V.G., ORVIG C., MCNEILL J.H. Glucose-lowering effects of a new organic vanadium complex, bis(maltolato)oxovanadium(IV) Can. J. Physiol. Pharmacol. 1993a;71:263–269. doi: 10.1139/y93-041. [DOI] [PubMed] [Google Scholar]
- YUEN V.G., ORVIG C., THOMPSON K.H., MCNEILL J.H. Improvement in cardiac dysfunction in streptozotocin-induced diabetic rats following chronic oral administration of bis(maltolato)oxovanadium (IV) Can. J. Physiol. Pharmacol. 1993b;71:270–276. doi: 10.1139/y93-042. [DOI] [PubMed] [Google Scholar]
- YUEN V.G., ORVIG C., MCNEILL J.H. Comparison of the glucose-lowering properties of vanadyl sulfate and bis(maltolato)oxovanadium(IV) following acute and chronic administration. Can. J. Physiol. Pharmacol. 1995;73:55–64. doi: 10.1139/y95-008. [DOI] [PubMed] [Google Scholar]


